Article
J. Braz. Chem. Soc., Vol. 25, No. 4, 734-742, 2014. Printed in Brazil - ©2014 Sociedade Brasileira de Química 0103 - 5053 $6.00+0.00
A
*e-mail: [email protected], [email protected], [email protected]
Combination of Directly Suspended Droplet Microextraction and Flame Atomic
Absorption Spectrometry for Determination of Trace Amounts of Iron and Copper
Shahed Hassanpoor and Gholamreza Khayatian*
Department of Chemistry, Faculty of Science, University of Kurdistan, Sanandaj, Iran
Um procedimento de extração em fase líquida miniaturizado, baseado na microextração direta em gota suspensa combinada com espectrometria de absorção atômica com chama foi desenvolvido para a determinação de traços de ferro e cobre, sem a necessidade da etapa de centrifugação para a separação de fases. O método consiste na extração de complexos de ferro e
cobre com 2-mercaptopiridina-N-óxido em uma microgota de metil-isobutil-cetona (MIBK) como
solvente extrator. Os fatores que afetam a extração foram otimizados. Nas condições otimizadas um fator de enriquecimento de ~25 foi obtido para ambos, ferro e cobre, a partir de 6,5 mL de
fase aquosa. As curvas analíticas mostraram-se lineares no intervalo de 40 a 800 µg L-1 e de 25 a
1200 µg L-1 para ferro e cobre, respectivamente. Os limites de detecção foram 3,76 e 1,84 µg L-1
para ferro e cobre, respectivamente. O método proposto foi aplicado para a determinação de íons ferro e cobre em águas, frutas, vegetais e também em materiais de referência certificados, com resultados bastante eficientes.
A miniaturized liquid-phase extraction procedure based on directly suspended droplet microextraction combined with flame atomic absorption spectrometry was developed for determination of trace amounts of iron and copper, without any need for the centrifugation step for phase separation. The method was based on the extraction of the iron and copper complexes with
2-mercaptopyridine-N-oxide onto a microdrop of methyl isobutyl ketone (MIBK) as extractant
solvent. The factors influencing the extraction were optimized. Under optimum conditions, an enrichment factor of ~25 was obtained for both iron and copper from only 6.5 mL of aqueous
phase. The analytical curves were linear between 40-800 µg L-1 and 25-1200 µg L-1 for iron and
copper, respectively. The limits of detection were 3.76 µg L-1and 1.84 µg L-1 for iron and copper,
respectively. The developed method has been successfully applied for the determination of iron and copper ions in environmental waters, fruits, vegetables and also certified reference materials, with high efficiency.
Keywords: directly suspended droplet,microextraction,iron,copper
Introduction
Recently, pollution of water and food samples by appreciable amount of heavy metals has been considered as a result of human activities. Heavy metal composition of foods is of interest because of their essential or toxic nature. For example, iron, zinc, copper, chromium, cobalt and manganese are essential, while lead, cadmium, nickel and mercury are toxic at certain levels. Toxic elements can be very harmful even at low concentrations when ingested over a long time. Other elements (iron, zinc, copper, etc.), are essential for human life at low concentrations, however,
they can also be toxic at high concentrations.1 Iron is an
essential nutritional element for all life forms, i.e., it is a cofactor for a number of enzymes and is essential for oxygen transport and electron transfer. Although daily requirements for iron are 8 and 18 mg for men and women, respectively, it is potentially toxic in excess concentrations because of its prooxidant activity. Hence, its concentrations
in body samples should be frequently controlled.2 On
Because of this, there is an increasing need to control the trace copper content in water and food samples on a daily basis.3
However, due to matrix effect and low concentration of metal ions, efficient separation and preconcentration steps are essential prior to analytical measurements.
Several preconcentration methods such as co-precipitation,4
liquid-liquid extraction (LLE)5 and solid phase extraction
(SPE)6,7 have been developed for the separation and
preconcentration of iron from environmental matrices. Among the methods of copper preconcentration reported
are liquid-liquid extraction,8,9 coprecipitation10 and also
several systems based on solid phase extraction.11-14
However, the uses of classical extraction methods for these purposes are usually time-consuming, labor-intensive and require large amounts of high purity solvents for extraction.
In recent years, there has been a growing interest in the development of miniaturized preconcentration methods
based on liquid-liquid or solid-phase extraction.15-18
Liquid-phase microextraction (LPME) technique, which
emerged in the 1990s,19-22 is a miniaturized format of LLE
and overcomes many of disadvantages of solid phase microextraction (SPME), e.g., non-dependence on a commercial supplier. It is generally simple to use, a quick procedure, which is characterized by affordability and reliance on widely available materials. Research on this technique began by using small droplets of organic solvents suspended from the tip of a microsyringe needle. However, new approaches have been developed to analyze compounds of a different nature and to obtain large enrichment factors
using relatively short extraction times.23 LPME based on
static microdroplets does have some drawbacks. First of all, the microdroplet can be lost from its support due to gravity, shear force and flow-field turbulence. Also, constrained stirring decreases the extraction efficiency or enrichment factor. The volume of the microdroplet is limited to 5 µL, which results in poor compatibility with some instruments that require larger injection volumes (e.g., high performance liquid chromatography (HPLC)).
In recent years, Yangcheng and co-workers24 developed
directly suspended droplet microextraction(DSDME) as
a new sampling method. In this method, a stirring bar is placed at the bottom of a vial containing an aqueous sample and rotated at a speed required to cause a gentle vortex. If a small volume of an immiscible organic solvent is added to the surface of the aqueous solution, the vortex results in the formation of a single droplet at or near the center of rotation. The droplet itself may also rotate on the surface of the aqueous phase, increasing mass transfer. In comparison with the other LPME techniques based on droplet systems (e.g., SDME), it provides more flexibility in the choice
of the operational parameters, especially the amount of the solvent and the stirring frequency. The possibility of applying larger volumes of organic solvents in this method also makes it a useful technique to match with HPLC in
addition to gas chromatography (GC).25
The aim of this study was the combination of green and simple directly suspended droplet microextraction (DSDME) with flame atomic absorption spectrophotometry (FAAS) for determination of Cu(II) and Fe(III) in different samples for the first time without need of any special glass tube for extraction solvent collection.
Experimental
Instrumentation
Determination of iron and copper was performed on a Shimadzu AA-670 atomic absorption spectrometer (Kyoto, Japan) under the recommended condition for each metal ion. The instrumental parameters were as follows: wavelengths 248.3 and 324.8 nm for iron and copper, respectively. Bandwidths were 0.2 and 0.5 nm for iron and copper, respectively. All pH measurements were made using a Metrohm E-691 digital pH meter with a combined glass electrode. A 100 µL Hamilton syringe (Hamilton Bonaduz AG, Bonaduz, Switzerland), was used for methyl isobutyl ketone (MIBK) injection and withdrawal of the enriched drop at the end of the DSDME process. Stirring of the solution was carried out by a magnetic stirrer (Rodwell
Monostir, England) and a stir bar (8 mm × 3 mm). A
home-made microsample introduction system was constructed from a 25 mL pipette valve and was coupled to the nebulizer
needle by a small length of the PTFE capillary tube.26,27
Reagents and materials
Nitric acid, hydrogen peroxide, formic acid, perchloric
acid, hydrofluoric acid and MIBK from Merck (Darmstadt,
Germany) were ofanalytical grade. The stock solution of
1000 mg L-1 of iron and copper were prepared by dissolving
Fe(NO3)3.9H2O and Cu(NO3)2.3H2O from Merck (Darmstadt,
Germany) in 1% HNO3.
1 The calibration standards for
the analytes were prepared using the atomic absorption
standard solutions (Fe(NO3)3 1000 mg L
-1 Fe, and Cu(NO
3)2
1000 mg L-1 Cu from Merck (Darmstadt, Germany)).
A 1.0 g L-1 solution of 2-mercaptopyridine-N-oxide
General procedure
A 5 mL water sample solution (0.5 µg mL-1 Fe3+ and
Cu2+) or real samples, a stir bar (8 mm × 3 mm), 1.0 mL
of 0.1 mol L-1 formate buffer (concentration in solution
is 0.0154 mol L-1), and 0.5 mg of
2-mercaptopyridine-N-oxide (equal to 0.5 mL of 1.0 g L-1 solution in water)
were placed in a 10 mL glass tube. The magnetic stirrer was subsequently turned on and the stirring rate fixed at 700 rpm in order to form a steady vortex. Then, 210 µL of MIBK was injected onto the surface of the aqueous solution with a microsyringe. The solvent immediately formed a drop-shape upon contact with aqueous solution. After 27 min, the remaining microdrop (50 ± 3 µL) was taken back into the microsyringe and diluted with ethanol to 250 µL. Then 100 µL of the final solution was aspirated into the flame atomic absorption spectrometer for each metal using a home-made microsample introduction
system.26,27 The described method was successfully
applied for the determination of Fe(III) and Cu(II) in water, vegetable, fruit and certified reference material samples (JA-1a, JB-3, SRM 1643e and 1640a). The samples were prepared as follows.
Preparation of natural water and water certified reference materials
River water from Sepid Rood (Astaneh Ashrafieh, Iran), mineral water (Hayat, Iran) and drinking water (Sanandaj,
Iran) were acidified to pH < 2.0 with concentrated HNO3,
immediately filtered (for river water) and stored in precleaned polyethylene bottles. In order to determine the total iron and copper, a 50.0 mL aliquot of each sample
was oxidized by addition of 5.0 mL concentrated HNO3
and 1.0 mL concentrated H2O2 (30% m/m). The beaker
was covered with watch glass and heated at 100 °C for
30 min to complete the oxidation.5,28 Then, the sample was
transferred into the 50 mL flask and diluted to mark with deionized water. Further, 5 mL of this solution was tested for determination of iron and copper under the general
procedure.Preparation of natural water certified reference
materials (SRM 1643e and SRM 1640a) followed the same method.
Preparation of vegetable and fruit samples
One gram of sample was placed in a 100 mL beaker,
and 10 mL of concentrated HNO3 (65% m/m) was added to
the beaker. The mixture was evaporated near to dryness on a hot plate at about 130 ˚C for 4 h. After cooling to room temperature, 3 mL of concentrated hydrogen peroxide (30% m/m) was added. The mixture was again evaporated near to dryness. The resulting solution was diluted to 25 mL
with distilled water. The filtration procedure was made for some vegetable samples which were not completely
dissolved.1 For the analysis of concentrated samples another
dilution was done. After adjusting the pH, analysis was done as previously mentioned.
Preparation of rock certified reference materials
The rock sample was analyzed according to the
literature29-31 with a little modification: 0.1 g of powdered
rock was weighed in a 50 mL Teflon beaker and 4 mL HNO3
(65% m/m), 3 mL HClO4 (70% m/m) and 5 mL HF (40%
m/m) were added. These were mixed well and this mixture was kept for more than 30 min at room temperature, then the beaker was covered and heated at ca. 160 °C for one day. Then the mixture was recovered and evaporated to dryness at ca. 140 °C for 2-3 days. The residue was dissolved with 10 mL (1+1) HCl by heating and dilution to 50 mL for analysis. After another dilution (1000 and 500 times for Fe and Cu, respectively) and adjusting the pH, analysis was done as previously mentioned.
Results and Discussion
In order to obtain high enrichment factor and absorbance, the effect of different parameters such as MIBK volume,
pH, amount of 2-mercaptopyridine-N-oxide, extraction
time, stirring rate and salt addition was optimized. Then, the effect of coexisting ions was investigated and different real samples such as natural water, vegetable and fruit were subjected to the proposed method to evaluate the concentration of iron and copper. Finally, method validation was made using rock certified reference material.
For DSDME, as a special type of LLE, the equilibrium organic phase concentration is given by
Co eq = κ C
aq eq = κ C
aq
0 / (1 + κ (V
o / Vaq)) (1)
where Co
eq and C
aq
eq are the equilibrium concentration in
the organic phase and aqueous phase, respectively, Caq0
is the initial concentration in the aqueous phase, κis the
distribution coefficient, Vaq is the sample volume, and Vo is
the organic solvent volume.
TheCo/Caq at time tis defined as κt, and the enrichment
factor Eis expressed by24
E = Co / Caq = κt / (1+ κt (Vo / Vaq)) (2)
The organic solvent volume has great impact on the extraction of target analytes, since the kinetics of extraction depend upon the interfacial area (A) and the organic solvent
k = (A / Vo) βo (1 + κ (Vo/Vaq)) (3)
where k is the observed rate constant, Vaq is the sample
volume, Vo is the extractant organic phase and βo is the
overall mass transfer coefficient with respect to the
extractant phase.32
The recovery of extraction (ER) was calculated according to:
ER = (Co Vo) / (Caq 0 V
aq) × 100 (4)
where Co is the concentration in the organic phase.
33
Selection of organic solvent and effect of organic solvent volume
Selection of organic solvent is very important for achieving efficient analyte preconcentration. The analyte in the sample solution (donor phase) should have high partition coefficient into the organic solvent. The appropriate organic solvent in this work should also have low solubility in water to minimize dissolution in the aqueous phase. It should also have high viscosity to hold the microdroplet and a lower density than water to float over the aqueous sample solution.34
Three low-density solvents (toluene, n-hexane, MIBK)
differing in polarity and water solubility were tested for this purpose. In the same experimental condition, the absorbance results for MIBK were better than other solvents. Therefore, methyl isobutyl ketone (MIBK) (density: 0.80 g mL-1; solubility in water: 1.91 g per 100 mL
(20 °C)) was selected as extraction solvent for subsequent experiments. In order to evaluate the effect of the extraction solvent volume, different volumes of MIBK were added to 6.0 mL aqueous phase (5.0 mL of sample solution containing 500 µg L-1 of Fe3+and 500 µg L-1 Cu2+ ions and
1.0 mL ligand 1.0 g L-1) in the range of 150-300 µL and the
remained organic phase diluted to 250 µL with ethanol and the determination of iron and copper was done according to the recommended procedure. The results are shown in Figure 1. As can be seen, the absorbance increases by increasing the MIBK volume in the range of 150-200 µL. These results are consistent with equation 3, since a larger interfacial area-to-drop volume ratio is provided by smaller
drops.26 Furthermore, the use of MIBK volumes higher
than 250 µL gradually decreases the absorbance signal which is due to increasing the volume of the organic phase. Therefore, in the subsequent studies, 210 µL of MIBK was selected as the optimum volume of the extraction solvent.
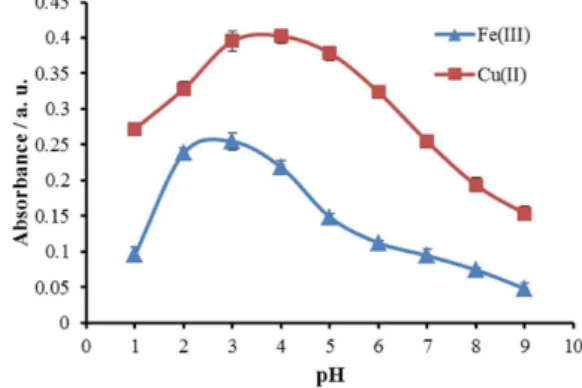
Effect of pH
One of the most important parameters affecting the preconcentration procedure is the pH of the solution, because the formation of soluble metal complexes and their stabilities in aqueous solutions are strongly related to
the pH of the medium.35 The effect of pH on the complex
formation and extraction of Fe3+ and Cu2+ from 6.0 mL
of aqueous phase into organic phase (210 µL MIBK) was studied in the range of 1.0-9.0. The pH values were adjusted by either nitric acid or sodium hydroxide solution. The experimental results are illustrated in Figure 2, showing that the maximum absorbance is obtained at pH 3.0 and pH 3.0-4.0 for iron and copper, respectively. The decrease in extraction of iron and copper ions at higher pH is due to the competition of hydroxyl ions with pyrithion for reaction with analytes. Therefore, pH 3.0 was chosen for subsequent experiments and the pH adjustment was carried out by formic acid/sodium formate buffer solution.
Figure 1. Effect of volume of extraction solvent on the absorbance of iron and copper. Conditions: water sample volume, 5.0 mL; 1.0 mL 2-mercaptopyridine-N-oxide 1.0 g L-1; extraction solvent, MIBK; concentration of Fe(III) and Cu(II), 0.5 µg mL-1; extraction time, 20 min; stirring rate, 600 rpm; n = 3.
Effect of amount of 2-mercaptopyridine-N-oxide
In order to study the influence of the
2-mercaptopyridine-N-oxide amount on the extraction and analytical response for
iron and copper, 6.0 mL of aqueous phase (5.0 mL of sample solution containing 0.5 µg mL-1 of Fe3+ and 0.5 µg mL-1 of
Cu2+ ions and 1.0 mL of 0.1 mol L-1 formate buffer) were
extracted into organic phase (210 µL of MIBK) using various
amounts of ligand (1.0 g L-1) ranging from 0.0-1.0 mg. As
can be seen from Figure 3, the absorbance increased rapidly as the amount of ligand increased from 0.2 to 0.4 mg, and then slowly decreased upon further increasing in the ligand
amount. Therefore, a 2-mercaptopyridine-N-oxide amount
of 0.5 mg (equal to 0.5 mL of 1.0 g L-1 ligand solution) was
chosen for subsequent experiments.
Effect of extraction time
Extraction is an equilibrium process, and the maximum extraction efficiency is obtained when the system is at equilibrium. Therefore, optimum time is required to reach equilibrium.36 Thus, the effect of time on extraction efficiency
of iron and copper from 6.5 mL of aqueous phase (5.0 mL
of sample solution containing 0.5 µg mL-1 of Fe3+ and
0.5 µg mL-1 of Cu2+ ions, 1.0 mL 0.1 mol L-1 formate buffer
and 0.5 mL 2-mercaptopyridine-N-oxide solution) into
organic phase (210 µL of MIBK) was examined in the range of 5-35 min. The results showed that absorbance increased by the increase in time, up to 25 min and then remained constant upon further increasing in extraction time. Thus, the extraction time of 27 min was selected for further experiments.
Effect of stirring rate
Stirring speed is one of the major factors that affect the extraction efficiency. Agitation of the sample is routinely
applied to the mass transfer coefficient in aqueous solution and accelerates the extraction kinetics. Increasing the stirring rate can decrease the thickness of the diffusion film in the aqueous phase and improve the repeatability
the extraction method.37 The effect of the stirring rate was
studied in the range of 200-1000 rpm. The results showed that the analytical signal increased with increasing stirring rate from 0 to 600 rpm, and then it remained nearly constant upon further increase in the stirring rate up to 800 rpm. Thus, 700 rpm was chosen as the optimum stirring rate.
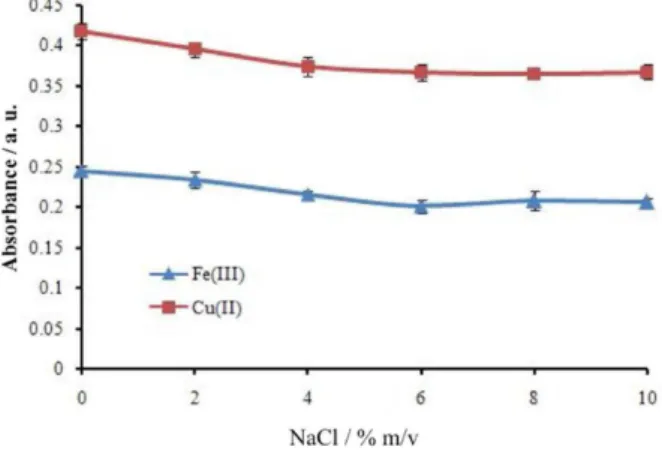
Effect of salt
The effect of salt on extraction efficiency was studied by varying the concentration of NaCl within the range of 0-10% m/v. Based on the obtained results (Figure 4), addition of salt did not improve the extraction efficiency and the extraction efficiency was higher without addition of sodium chloride. In fact, apart from the salting out effect, salt addition causes a second effect and changes the physical properties of the Nernst diffusion film and reduces the rate of diffusion of the target analyte into the
droplet.38 Hence, the extraction experiments were carried
out without additional salt.
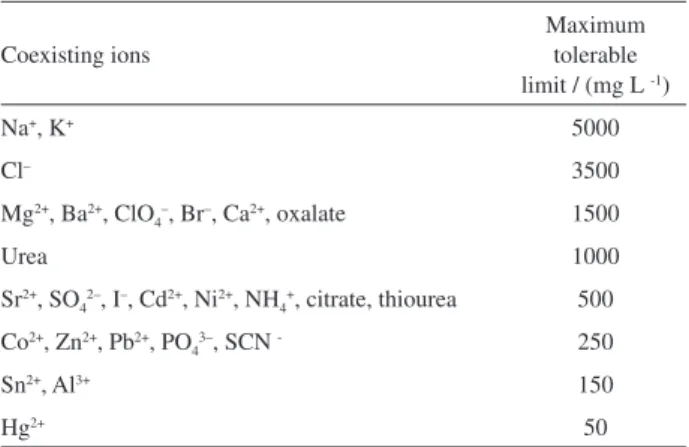
Effect of coexisting ions
The effects of common coexisting ions on the extraction of iron and copper were also studied. In these experiments,
5.0 mL of solutions containing 0.5 µg mL-1 of metal ions
and various amounts of interfering ions were treated according to the recommended procedure. A species was considered to interfere if it resulted in a ± 5% variation of the absorbance signal. The results are given in Table 1. As
Figure 3. Effect of amount of 2-mercaptopyridine-N-oxide on the absorbance of iron and copper. Conditions: water sample volume, 5.0 mL; 1.0 mL formate buffer 0.1 mol L-1; extraction solvent, MIBK 210 µL; concentration of Fe(III) and Cu(II), 0.5 µg mL-1; extraction time, 20 min; stirring rate, 600 rpm; n = 3.
can be seen from Table 1, the majority of the investigated ions have no significant influence on the extraction of Fe(III) and Cu(II) under the selected conditions. This may be due to formation of more stable complexes of Fe(III) and Cu(II) with pyrithione than the other metal ions studied. Lofts showed that the order of stability constants and, hence, the reactivity of the ligand toward metal ions followed the trend of Fe(III) > Cu(II) > Pb(II) > Zn(II) > Ni(II) > Co(II) > Cd(II) > Mn(II) > Ca(II).39 Thus, it is not
surprising that other cations cannot significantly interfere in the extraction of Fe3+ and Cu2+ from aqueous solution. In
the case of Hg2+ ions the data given in Table 1 shows that
the interference effect of this ion is higher than the other
metal ions studied. This is probably because Hg2+ ion as
a soft acid has a high affinity for the sulfur atom of the pyrithion as a soft base, which results in strong interactions
that increase the stability of Hg2+-pyrithion complex and
therefore, an increase in interference of this ion.
Analytical figures of merit
The analytical characteristics of the proposed method, including linear range, limit of detection, relative
standard deviation (RSD), correlation coefficient (R2),
and enrichment factor, were obtained. Under the optimum experimental conditions, analytical curves were achieved by analyzing 5.0 mL of standard solution containing a
known amount of target ions in the range of 10-1400 µg L−1.
The organic phase (50 ± 3 µL) was diluted to 250 µL with ethanol, and 100 µL of this solution was aspirated into the flame atomic absorption spectrometer for determination of
each metal. The linear dynamic range was 40-800 µg L-1
and 25- 1200 µg L-1 for iron and copper respectively. The
limit of detection (LOD), calculated as the concentration of the absolute amount of analyte yielding a signal equivalent to three times the standard deviation of the blank
(LOD = 3 σblank / m, n = 10), where m is the slope of the
analytical curve in accordance to IUPAC recommendation, were 3.76 and 1.84 µg L-1 for Fe3+ and Cu2+, respectively.
The limit of quantification (LOQ = 10 σblank / m, n = 10),
were 12.53 and 6.13 µg L-1 for Fe3+ and Cu2+, respectively.
The results are summarized in Table 2.
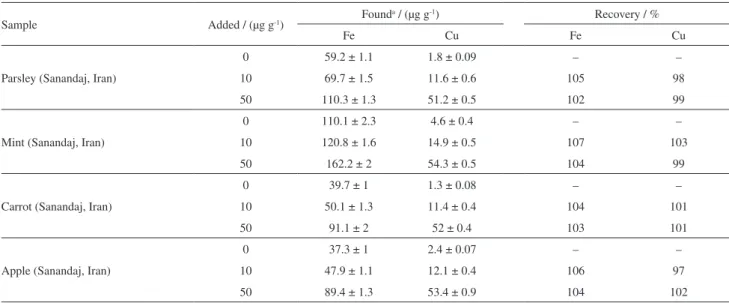
Applications
The proposed method was successfully used for the determination of total iron and copper in several water, fruit and vegetable samples. The results, along with the recovery for the spiked samples, were given in Tables 3 and 4. As can be seen, added iron and copper are quantitatively recovered from all samples. The accuracy of the proposed method was evaluated by means of recovery experiments and analysis of certified reference materials JA-1a and JB-3 (andesite and basalt, Geological Survey of Japan), SRM 1643e and SRM 1640a (trace elements in natural water from NIST). The results are shown in Table 5. These results indicate the validity of the proposed methodology for analysis of iron and copper in real samples.
Conclusions
In the present study, an efficient and straightforward mode of microextraction technique (DSDME) has been developed for trace analysis of metallic cations such as iron and copper. This technique provides multi-element enrichment capability, simplicity, low consumption of organic solvent, such as MIBK, which is less toxic than other chlorinated extracting solvents, and doesn’t need any centrifugation step for phase separation. The
Table 2. Analytical figures of merit
Analytical parameters Fe3+ Cu2+
Linear dynamic range / (µg L-1) 40-800 25-1200
Slope / (abs mg-1 L) 0.253 0.816
Intercept 0.001 0.007
Correlation coefficient 0.999 0.998
RSD / %a 1.7 2.1
Limit of detection / (µg L-1) 3.76 1.84
Limit of quantification / (µg L-1) 12.53 6.13
Recovery of extraction / % 98 96
Enrichment factorb 25.7 25.4
Enrichment factorc 20.0 20.0
aRelative standard deviation (n = 10, 0.5 µg mL-1); bthe enrichment factor is the ratio of iron and copper concentration in ethanol (250 µL) to that of the bulk phase initially; cthe enrichment factor is the ratio of sample volume/final volume (5 mL/0.25 mL).
Table 1. Effect of coexisting ions on the extraction of 0.5 µg mL-1 Fe(III) and 0.5 µg mL-1 Cu(II)
Coexisting ions
Maximum tolerable limit / (mg L -1)
Na+, K+ 5000
Cl– 3500
Mg2+, Ba2+, ClO
4–, Br–, Ca2+, oxalate 1500
Urea 1000
Sr2+, SO
42–, I–, Cd2+, Ni2+, NH4+, citrate, thiourea 500 Co2+, Zn2+, Pb2+, PO
43–, SCN - 250
Sn2+, Al3+ 150
developed DSDME method possesses a high potential for the separation of iron and copper ions from a host of coexisting alkali, alkaline earth, transition and heavy metal ions. Determination of iron and copper can be easily achieved by flame atomic absorption spectrometry with an inexpensive homemade micro sample introduction
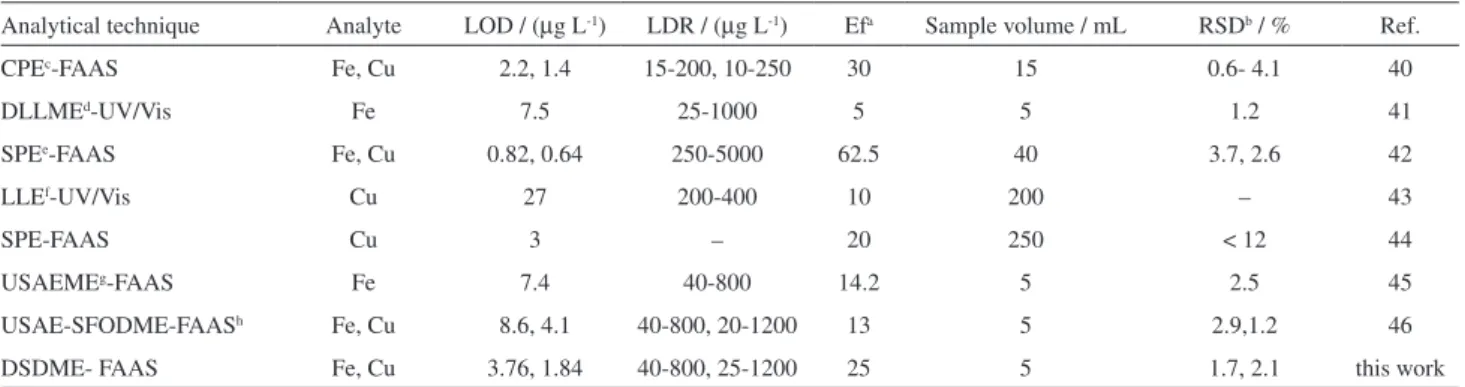
system. DSDME-FAAS was compared with other reported methods for determination of iron and copper (Table 6). As can be seen, the proposed procedure shows a good limit of detection and precision, wide linear dynamic range and more drastic preconcentration factor, which are better in most cases and are comparable with reported methods in
Table 5. Analytical results for certified reference materials (n = 3)
Sample JA-1a JB-3 SRM 1643e SRM 1640a
Fe / % Cu / ppm Fe / % Cu / ppm Fe / ppb Cu / ppb Fe / ppb Cu / ppb
Certified value 5.08 41.7 8.27 194 95.7 ± 1.4a BLDRb BLDR 85.75 ± 0.51
Found 5.14 ± 0.5 41.1 ± 1.9 8.35 ± 0.2 188 ± 2.3 96.5 ± 2.1 – – 81.70 ± 2.5
Recovery / % 101 98 101 97 98 – – 95
aMean ± standard deviation; bBLDR: below linear dynamic range.
Table 4. Application of the proposed method for analysis of vegetable and fruit samples (n = 3 and three samples for each type of fruit and vegetable were analyzed)
Sample Added / (µg g-1) Found
a / (µg g-1) Recovery / %
Fe Cu Fe Cu
Parsley (Sanandaj, Iran)
0 59.2 ± 1.1 1.8 ± 0.09 – –
10 69.7 ± 1.5 11.6 ± 0.6 105 98
50 110.3 ± 1.3 51.2 ± 0.5 102 99
Mint (Sanandaj, Iran)
0 110.1 ± 2.3 4.6 ± 0.4 – –
10 120.8 ± 1.6 14.9 ± 0.5 107 103
50 162.2 ± 2 54.3 ± 0.5 104 99
Carrot (Sanandaj, Iran)
0 39.7 ± 1 1.3 ± 0.08 – –
10 50.1 ± 1.3 11.4 ± 0.4 104 101
50 91.1 ± 2 52 ± 0.4 103 101
Apple (Sanandaj, Iran)
0 37.3 ± 1 2.4 ± 0.07 – –
10 47.9 ± 1.1 12.1 ± 0.4 106 97
50 89.4 ± 1.3 53.4 ± 0.9 104 102
aMean ± standard deviation.
Table 3. Application of proposed method for analysis of natural waters (n = 3)
Sample Added / (µg L-1) Found
a / (µg L-1) Recovery / %
Fe Cu Fe Cu
Tap water (Sanandaj, Iran)
0 113 ± 3 BDLb − −
50 161 ± 3 48 ± 2 96 96
100 208 ± 5 96 ± 2 95 96
Mineral water (Hayat, Iran)
0 BDL BDL − −
50 49 ± 2 49 ± 3 98 98
100 97 ± 3 96 ± 3 97 96
River water (Sepid Rood, Iran)
0 214 ± 5 32 ± 2 – –
50 261 ± 5 79 ± 3 94 94
100 311 ± 6 127 ± 3 97 95
other cases. The application of MIBK as an extracting solvent in comparison with dodecanol and chlorinated solvents have advantages like adaptability with flame
AAS and no need for dilution or solvent evaporation.45,46
The method was successfully applied to the separation and determination of iron and copper in different real samples.
References
1. Tokalıoglu, S.; Gurbuz, F.; Food Chem. 2010, 123, 183. 2. Yaman, M.; Kaya, G.; Anal. Chim. Acta 2005, 540, 77. 3. Zeeb, M.; Ganjali, M. R.; Norouzi, P.; Kalaee, M. R.; Food
Chem. Toxicol. 2011, 49, 1086.
4. Grotti, M.; Soggia, F.; Ardini, F.; Frache, R.; J. Anal. Atom. Spectrom. 2009, 24, 522.
5. Sacmaci, S.; Kartal, S.; Anal. Chim. Acta 2008, 623, 46. 6. Pehlivan, E.; Kara, D.; Microchim. Acta 2007, 158, 137. 7. Khayatian, G.; Hassanpoor, S.; Nasiri, F.; Zolali, A.; Quim.
Nova 2012, 35, 535.
8. Sachsenberg, S.; Klenke, T.; Krumbein, W. E.; Zeeck, E.; Fresenius. J. Anal. Chem. 1992, 342, 163.
9. Zhang, X. Y.; Keiichi, S.; Satoh, A.; Sawada, K.; Suzuki, T.; Anal. Sci. 1997, 13, 891.
10. Tokalıoglu, S.; Yildiz, S.; Microchim. Acta 2009, 165, 129. 11. Atanasova, D.; Stefanova,V.; Russeva, E.; Talanta1998, 45,
857.
12. Uzawa, A.; Narukawa, T.; Okutani, T.; Anal. Sci. 1998, 14, 395. 13. Jain, V. K.; Sait, S. S.; Shrivastav, P.; Agrawal, Y. K.; Talanta
1997, 45, 397.
14. Taher, M. A.; J. Anal. Chem. 2001, 56, 149.
15. Pena-Pereira, F.; Lavilla, I.; Bendicho, C.; Spectrochim. Acta B 2009, 64, 1.
16. Nerín, C.; Salafranca, J.; Aznar, M.; Batlle, R.; Anal. Bioanal. Chem. 2009, 393, 809.
17. Rivas, R. E.; Lopez-Garcia, I.; Hernandez-Cordoba, M.; Spectrochim. Acta B 2009, 64, 329.
18. Liu, Y.; Zhao, E. C.; Zhu, W. T.; Gao, H. X.; Zhou, Z. Q.; J. Chromatogr. A 2009, 1216, 885.
19. Jeannot, M. A.; Cantwell, F. F.; Anal. Chem. 1996, 68, 2236. 20. Liu, H.; Dasgupta, P. K.; Anal. Chem 1996, 68, 1817. 21. Jeannot, M. A.; Cantwell, F. F.; Anal Chem. 1997, 69, 235. 22. Ma, M.; Cantwell, F. F.; Anal. Chem. 1999, 71, 388.
23. Mahugo-Santana, C.; Sosa-Ferrera, Z.; Torres-Padrón, M. E.; Santana-Rodríguez, J. J.; TrAC, Trends Anal. Chem. 2011, 30, 731.
24. Yangcheng, L.; Quan, L.; Guangsheng, L.; Youyuan, D.; Anal. Chim. Acta, 2006, 566, 259.
25. Sarafraz-Yazdi, A.; Amiri, A.; TrAC, Trends Anal. Chem. 2010, 29, 1.
26. Yousefi, S. R.; Shemirani, F.; Anal. Chim. Acta 2010, 669, 25. 27. Yousefi, S. R.; Ahmadi, S. J.; Microchim. Acta 2011, 172, 75. 28. Pereira, A. S.; Ferreira, G.; Caetano, L.; Martines, M.; Padilha,
P. M.; Santos, A.; Castro, G. R.; J. Hazard. Mater. 2010, 175, 399.
29. Imai, N.; Anal. Sci. 1990, 6, 389.
30. Khayatian, G.; Hassanpoor, S.; Azar, A. R. J.; Mohebbi, S.; J. Braz. Chem. Soc. 2013, 24, 1808.
31. Azizi, H.; Chung, S. L.; Tanaka, T.; Asahara, Y.; Precambrian Res. 2011, 185, 87.
32. Pena-Pereira, F.; Cabaleiro, N.; de la Calle, I.; Costas, M.; Gil, S.; Lavilla, I.; Bendicho, C.; Talanta 2011, 85, 1100. 33. Mirzaei, M.; Behzadia, M.; Mahmoud Abadi, N.; Beizaei, A.;
J. Hazard. Mater. 2011, 186, 1739.
34. Sarafraz-Yazdi, A.; Mofazzeli, F.; Eshaghi, Z.; Chromatographia 2008, 67, 49.
35. Tokalıoğlu, Ş.; Livkebabc, A.; Microchim. Acta 2009, 164, 471. 36. Gao, W.; Chen, G.; Chen, T.; Zhang, X.; Chen, Y.; Hu, Z.;
Talanta 2011, 83, 1673.
37. Eshaghi, Z.; Mohtaji, M.; Hasanzade-Meidani, M.; Masrournia, M.; J. Chromatogr.B 2010, 878, 903.
38. Sarafraz-Yazdi, A.; Raouf-Yazdinejad, S.; Eshaghi, Z.; Chromatographia 2007, 66, 613.
Table 6. Comparison of the proposed method with other reported methods for determination and preconcentration of iron and copper
Analytical technique Analyte LOD / (µg L-1) LDR / (µg L-1) Efa Sample volume / mL RSDb / % Ref.
CPEc-FAAS Fe, Cu 2.2, 1.4 15-200, 10-250 30 15 0.6- 4.1 40
DLLMEd-UV/Vis Fe 7.5 25-1000 5 5 1.2 41
SPEe-FAAS Fe, Cu 0.82, 0.64 250-5000 62.5 40 3.7, 2.6 42
LLEf-UV/Vis Cu 27 200-400 10 200 – 43
SPE-FAAS Cu 3 – 20 250 < 12 44
USAEMEg-FAAS Fe 7.4 40-800 14.2 5 2.5 45
USAE-SFODME-FAASh Fe, Cu 8.6, 4.1 40-800, 20-1200 13 5 2.9,1.2 46
DSDME- FAAS Fe, Cu 3.76, 1.84 40-800, 25-1200 25 5 1.7, 2.1 this work
39. Lofts, S.; Speciation of Pyrithione in Freshwaters; CEH Project Number C03634; NERC/Centre for Ecology and Hydrology, 2009; available at http://nora.nerc.ac.uk/9924/ accessed in January 2014.
40. Ghaedi, M.; Niknam, K.; Niknam, E.; Soylak, M.; J. Chin. Chem. Soc. 2009, 56, 981.
41. Tabrizi, A.; J. Hazard. Mater. 2010, 183, 688.
42. Yıldız, O.; Citak, D.; Tuzen, M.; Soylak, M.; Food Chem. Toxicol. 2011, 49, 458.
43. Rekha, D.; Suvardhan, K.; Kumar, K. S.; Reddy Prasad, P.; Jayaraj, B.; Chiranjeevi, P.; J. Serb. Chem. Soc. 2007, 72, 299.
44. Aydemir, N.; Tokman, N.; Akarsubasi, A. T.; Baysal, A.; Akman, S.; Microchim. Acta 2011, 175, 185.
45. Khayatian, G.; Hassanpoor, S.; J. Chin. Chem. Soc. 2012, 59, 659.
46. Khayatian, G.; Hassanpoor, S.; J. Iran. Chem. Soc. 2013, 10, 113.
Submitted: November 25, 2013