Article
Printed in Brazil - ©2017 Sociedade Brasileira de Química0103 - 5053 $6.00+0.00*e-mail: [email protected]
Effects of Iron Enrichment of Adzuki Bean (
Vigna angularis
) Sprouts on Elemental
Translocation, Concentrations of Proteins, Distribution of Fe-Metalloproteins, and
Fe Bioaccessibility
Aline P. de Oliveira and Juliana Naozuka*
Universidade Federal de São Paulo, Rua Prof. Artur Riedel, 275, 09972-270 Diadema-SP, Brazil
Iron (Fe) is an essential element for human nutrition, and its deficiency or low hemoglobin levels are a global health issue. Strategies aimed at increasing the amounts of essential elementals
in agricultural products, as sprouts of adzuki bean (Vigna angularis), can be a way to minimize
deficiencies, mainly in the populations of developing countries. Therefore, in this work was evaluated: production of Fe-enriched adzuki bean sprouts; Fe accumulation and translocation in plants in different culture media enriched with different Fe masses (500, 1000, 2000, and
3000 µg); and effects of the enrichment by means of 3000 µg FeIII-ethylenediaminetetraacetic
acid (FeIII-EDTA): on the distribution of Ca, Cu, Fe, K, P, Mg, S, and Zn in different parts of the
plant; on protein concentrations (albumins, globulins, prolamins, and glutelins) and their association with Fe in edible parts of the plant (stems); and on Fe bioaccessibility in the edible part of the
plant (stems). The enrichment via FeIII-EDTA favored the translocation and increased Fe content of
sprouts (75%), besides promoting interactions of Fe with albumins (141%), globulins (180%), and glutelins (93%). In the bioaccessibility assays, Fe was 83% bioaccessible in Fe-enriched sprouts.
Keywords: adzuki bean, sprout, enrichment, iron, protein, bioaccessibility
Introduction
Iron (Fe) is an essential element for cellular homeostasis, oxygen transport, DNA synthesis, and energy metabolism as well as a cofactor for enzymes of the mitochondrial respiratory chain and nitrogen fixation. In human nutrition, Fe is used mainly in the hemoglobin synthesis in erythrocytes, myoglobin in the muscles, and cytochromes in the liver.1 One of the main public health concerns in
developing countries is Fe deficiency,2 where ca. 40% of
the world population have Fe deficiency or low hemoglobin levels.3 According to the US Food and Drug Administration
(FDA) regulations, the recommended dietary allowance for Fe is 18 mg.4
Leguminous plants have major social and economic importance, being one of the main sources of proteins, plant-derived micronutrients, and minerals for the population.5 Furthermore, beans are the vegetable sources
with the largest total Fe amount. Nonetheless, knowledge about the total elemental concentration of foods cannot result in information on the nutritional, toxicological, and essentiality characteristics because such studies have shown
that legumes contain a low concentration of Fe species available for absorption and hence are ineffective sources for rectifying nutritional Fe deficiencies.6 Accordingly,
the strategies aimed at increasing the levels of essential elements, such as Fe, in agricultural products can help to minimize deficiencies, mainly in the populations of developing countries.
Alternatives that facilitate adjustment to new healthy, sustainable, and pesticides-free nutrition are becoming increasingly important. Consumption of sprouted foods is a segment that should be promoted in nutrition and can be established even in urban areas.7 Sprout production is
a simple and fast germination process, which is extremely inexpensive. Although several kinds of seeds may be eaten as sprouts, adzuki beans (Vigna angularis) and mung beans (Vigna radiata) are usually preferred and are commonly used for the sprout production.8 The adzuki bean seeds
containing ca. 50% starch and 25% protein are among the 12 most important legume products grown worldwide.9-12
Additionally, the germination has been identified as an effective technology that improves the quality and nutritional value of grain legumes.13 Some studies have
Effective ways to increase Fe levels in plants include spraying with a Fe salt solution,17 adding Fe salts to the
culture medium,18 and hydroponic cultivation of seeds in
a nutrient-enriched solution.19 The fertilizers commonly
used to enrich agricultural crops contain FeSO4⋅7H2O,
FeCl3⋅6H2O, or a chelate of Fe.20 On the other hand, the
absorption and translocation of Fe in plants are limited, where superoxide and hydrogen peroxide production in cells during reduction of molecular oxygen is catalyzed by Fe2+ and Fe3+, which can damage cellular components,
such as the DNA, proteins, lipids, and sugars. Thus, the Fe uptake by plants is highly regulated to prevent an excess.21
Therefore, to select the best source of Fe to enrich a food product, a technologist should also consider the influence of the Fe species added to the culture medium on elemental translocation to the edible part of the plant, as well as the physical and chemical characteristics of the plant, in order to maintain the product intake and Fe bioavailability.
Therefore, in this work was (i) produced Fe-enriched adzuki bean sprouts; (ii) evaluated the Fe accumulation and translocation in plants in various culture media (FeCl3, FeSO4, and FeIII-ethylenediaminetetraacetic
acid (FeIII-EDTA)) enriched with different Fe masses
(500, 1000, 2000, and 3000 µg); and (iii) evaluated the effects of the enrichment by means of 3000 µg FeIII-EDTA: on the distribution of Ca, Cu, Fe, K, P, Mg,
S, and Zn in different parts of the plant (roots, stems, and cotyledons); on protein concentrations (albumins, globulins, prolamins, and glutelins) and their association with Fe in the edible part of the plant (stems); and on Fe bioaccessibility in the edible part of the plant (stems).
Experimental
Instrumentation
For the quantification of elements (Ca, Cu, Fe, K, Mg, P, S, and Zn), an inductively coupled plasma optical emission spectrometer (model iCAP 6300 Duo, Thermo Fisher Scientific, England), equipped with axial and radial viewed plasma was used throughout the study. The spectrometer was equipped with a charge-injection device (CID), allowing for analyses from 166.25 to 847.00 nm. An Echelle polychromator was purged with argon, a 27.12 MHz radiofrequency source and plasma axial-view were used. A Meinhard nebulizer combined with a cyclonic spray chamber served as the sample introduction system. The injector tube diameter of the torch was 2.0 mm.
For the Fe quantification in water, NaCl (1.0 mol L−1),
ethanol (70% v/v) and NaOH (1.0 mol L−1) extracts,
a ZEEnit 60 model atomic absorption spectrometer
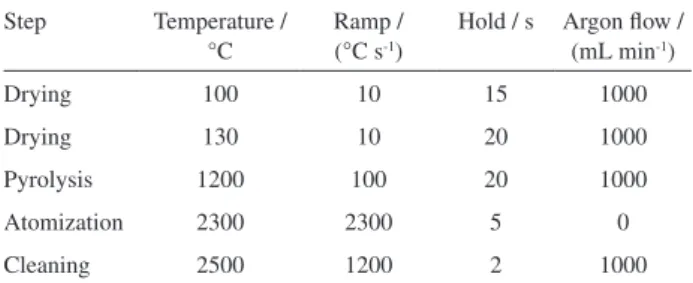
(Analytikjena AG, Germany) equipped with a transversely heated graphite atomizer, pyrolytically coated graphite tube, and transversal Zeeman-effect background correction were used. The spectrometer was operated with a hollow cathode lamp operated by a wavelength, lamp current and slit equal to 248.3 nm, 4 mA, and 0.8 nm, respectively. All measurements were based on integrated absorbance values. A 10 µL aliquot of different supernatants was introduced into the graphite tube without adding a chemical modifier. The instrumental conditions for the spectrometer and the heating program are shown in Table 1.22 Argon
99.998%, v/v (Air Liquide Brasil, Brazil) was used as a protective and purging gas.
An Ultrospec 2100 Pro spectrophotometer (Biochrom Ltd., UK), equipped with a xenon lamp and with a 190-900 nm range wavelength was used for protein quantification at 595 nm. A centrifuge (Q222TM model, Quimis, Brazil), was used for the phase separation.
The digestion of samples and standard reference materials [peach leaves (SRM 1547) from the National Institute of Standards and Technology (NIST)] were carried out in a closed-vessel microwave system (Speedwave-4, Germany) equipped with 16 fluoropolymer vessels and a ceramic vessel jacket. For simulated gastrointestinal digestion, a water bath at 36 °C was used for 120 min (Q226M2 model, Quimis, Brazil).
For preliminary preparation of the samples, different parts of the adzuki bean sprouts were dried in a freeze dryer (Thermo Fisher Scientific, England). Homogenization of the culture medium was performed by means of an orbital shaker (model 0225M, Quimis, Brazil).
Reagents and samples
A 500 g package of adzuki bean seeds was purchased at the local market of São Paulo, Brazil. The producers assert that the geographic origin is São Paulo.
All solutions were prepared from analytical reagent-grade chemicals, with high-purity deionized water from a Milli-Q water purification system (Millipore, USA) as a
Table 1. Heating program for Fe determination by GF AAS
Step Temperature / °C
Ramp / (°C s-1)
Hold / s Argon flow / (mL min-1)
Drying 100 10 15 1000
Drying 130 10 20 1000
Pyrolysis 1200 100 20 1000
Atomization 2300 2300 5 0
solvent. Analytical grade 65% (m/v) HNO3, distilled in a
quartz sub-boiling still (Marconi, Brazil), and 30% (m/v) H2O2 (Merck, Germany) were used for the sample digestion.
A solution containing 1.0 mg L−1 Mg (Merck, USA)
was utilized to assess the robustness of the spectrometer.23
Titrisol standard solutions of 1000 mg L−1 for Ca (CaCl 2),
Cu (CuCl2), Fe (FeCl3), K (KCl), Mg (MgCl2), P (H3PO4),
S (H2SO4), and Zn (ZnCl2) (Merck, USA) were applied to
prepare the reference analytical solutions, after dilution in HNO3 0.1% (v/v) for elemental analysis by inductively
coupled plasma optical emission spectrometry (ICP OES) and FeCl3 for determining the Fe content by graphite
furnace atomic absorption spectrometry (GF AAS). For the sequential extraction, the following reagents (Merck, USA) were used: acetone, chloroform, ethanol, methanol, NaCl, and NaOH.
The total protein concentration in the extractants was assayed by means of the Bradford’s reagent (BioAgency, Brazil), diluted five-fold with deionized water before the analysis. The stock solution for construction of a standard curve was prepared by dissolving 4.0 mg of ovalbumin (BioAgency, Brazil) in 2.0 mL of deionized water with vortex stirring for 2 min. The solution was then diluted 10-fold with deionized water.
Gastrointestinal fluids were prepared using NaCl (Merck, Germany), pepsin (Sigma-Aldrich, USA), HCl (Merck, Germany), NaHCO3 (Reagen, Brazil), K2HPO4
(Synth, Brazil), NaOH (Merck, Germany), pancreatin (Sigma-Aldrich, USA), and bile salts (Sigma-Aldrich, USA). A 3% (m/v) solution of NaHCO3 (Reagen, Brazil)
was employed to adjust pH. The dialysis procedure was performed using cellulose membranes (Sigma-Aldrich, USA) in 32 mm tubes with 12.4 kDa porosity. For the
treatment of the membranes, Na2S (Merck, Germany)
0.3% (m/v) and H2SO4 (Merck, Germany) 0.2% (v/v)
solutions were used.
Seeds were sterilized with NaClO (Sigma-Aldrich, USA). Fe salt solutions [FeCl3⋅6H2O, FeSO4⋅7H2O,
or ethylenediaminetetraacetic acid ferric sodium (NaFeIII-EDTA)] (Sigma-Aldrich, USA)] were prepared
for the enrichment procedure.
Procedures
Cultivation of sprouts and preliminary sample preparation
Cultivation of adzuki bean sprouts was carried out in triplicate for each treatment. The adzuki bean seeds were first cleaned with deionized water. After sterilization of the seeds for 5 min in NaClO (12% v/v),24 the seeds (ca. 5 g)
were cleaned again and left to soak in deionized water (ca. 200 mL) at room temperature for 24 h, to promote the
breaking of seed dormancy.25 Absorbent cotton (ca. 3 g)
was spread over the base of a glass container previously decontaminated with HNO3 (10% v/v). The seeds were
cultivated in a portable greenhouse in the dark and long-day temperature conditions at ca. 27 °C during the long-day and 18 °C at night at 70% relative humidity, with a total culture period of 13 days.
During the germination, all the sprouts were soaked once a day with 20 mL of deionized water. The germination of adzuki beans seeds was carried out with deionized water alone (control group) or with Fe salt solutions [FeCl3⋅6H2O,
FeSO4⋅7H2O, and NaFeIII-EDTA containing 500, 1000,
2000, or 3000 µg of Fe (20 mL of Fe salt solutions)]. The total germination period was 13 days.
The adzuki bean sprouts were collected and washed with deionized water, and different parts of the plant (roots, stems, and cotyledons) were separated. They were dried by lyophilization (ca. 2 days) and ground by means of a pestle and mortar (decontaminated) after freezing the samples in liquid nitrogen.
Sample digestion
To determine the total levels of the elements (Ca, Cu, Fe, K, Mg, P, S, and Zn), different parts of the plant (roots, stems, and cotyledons) or SRM were subjected to acid digestion in a closed-vessel microwave system. Samples masses of ca. 250 mg were digested with 2 mL HNO3 +
1 mL H2O2 + 3 mL H2O.26 The heating program consisted
of three steps (temperature / °C; ramp / min; hold / min): (i) (140; 5; 1); (ii) (180, 4, 5); and (iii) (220, 4, 10). The system was cooled by forced ventilation for 20 min. The final volume was 10 mL, completed with deionized water, and the digestion procedures were performed in duplicate (roots) or in triplicate (stems and cotyledons).
Quantification of Ca, Cu, Fe, K, Mg, P, S, and Zn by ICP OES
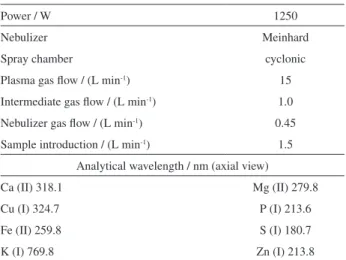
The Mg (II) 280.265/Mg (I) 285.208 nm emission line intensity ratio was used to assess the robustness of the ICP system.23,27 A good response was observed with the
instrumental parameters of the ICP OES analysis shown in Table 2. Under such conditions, the Mg (II)/Mg (I) ratios were 17.0 for the axial view.
The calibration was carried out by means of analytical solutions prepared in a medium with the same acid concentration as that used in the digestion procedure: Ca: 1.75-224 mg L−1; Fe, K, Mg, P, and S: 1.25-160 mg L−1;
Zn: 0.06-8 mg L−1; and Cu: 0.02-3.2 mg L−1.
the sample were 56 (Ca), 0.8 (Cu), 40 (Fe), 40 (K), 20 (Mg), 40 (P), 40 (S), 2 (Se) and 2 mg L−1 (Zn),
after acid digestion in a microwave oven or simulated gastrointestinal digestion.
Peach leaves (SRM 1547) were subjected to acid digestion and were used to check the accuracy of the analytical method applied to determination of total concentrations.
Sequential extraction and quantification of Fe associated with albumins, globulins, prolamins, and glutelins
A sequential extraction procedure described by Naozuka and Oliveira28 was utilized in this study, with
some modifications. Approximately 200 mg of dried and ground stems (control and enriched with 3000 µg of FeIII-EDTA groups) were used for the solid-liquid
extraction with the following extractors and extraction periods, sequentially: methanol/chloroform mixture (3 mL, 1:2 v/v; 30 min), acetone (3 mL, 70% v/v; 30 min),29
deionized water (4 mL; 30 min), NaCl (2 mL, 1 mol L−1;
15 min), ethanol (1 mL, 75% v/v; 30 min), and NaOH (10 mL, 1 mol L−1; 60 min), in which the mixture of
a solid sample and extractants was prepared using an orbital shaker at 1520 × g. The methanol/chloroform and acetone extractions were consecutively repeated 3 times, but 1 time for ethanol, 3 times for water, 4 times for NaCl, and 5 times for NaOH. The solid phase separation at each step of the sequential extraction was carried out by centrifugation at 2778 × g for 10 min.
The protein quantification was performed by the Bradford method.30 Spectrophotometer calibration was
performed by means of analytical reference solutions of 4, 6, 8, 10, 12, 16, and 20 µg of ovalbumin in 1.0 mL of the
Bradford reagent. Water, NaCl, and NaOH extracts were diluted 2- to 40-fold in deionized water, except for ethanol extracts (without dilution).
The Fe determination was carried out by GF AAS in water, NaCl, ethanol, and NaOH extracts. The instrument calibration was carried out using analytical solutions with concentrations ranging from 10 to 80 µg L−1 in 0.1% v/v
HNO3. All the supernatants were diluted 2- to 20-fold
beforehand in deionized water and no chemical modifier was used. The chemical interferences were assessed by an addition-and-recovery test, adding a solution of 20 µg L−1
Fe in the different extracts.
An assay of simulated gastrointestinal digestion
The in vitro gastrointestinal digestion procedure using fluids prepared according to U.S. Pharmacopeia & National XXIV recommendations31 was employed to evaluate the
Fe bioaccessibility. The gastric juice was prepared by dissolving 0.2 g of NaCl and 0.32 g of pepsin in water, 7 mL of HCl at 10% (v/v) was subsequently added, and this solution was diluted to 100 mL with deionized water. This solution was maintained at pH 1.5. Then, 3 g of NaHCO3 was dissolved in 100 mL of high-purity deionized
water to obtain a 3% solution (m/v). The intestinal fluid was prepared by dissolving 0.680 g of K2HPO4, 1.0 g
of pancreatin, 1.25 g of bile salts, in 7.7 mL of NaOH (0.2 mol L−1). This solution was diluted to 100 mL and
final pH was 6.8 with NaOH.
For an in vitro gastrointestinal digestion procedure, it was added 3.0 mL of the artificial gastric juice (pH 1.5) to 200 mg of the edible part of adzuki bean plant (stem). The mixture was shaken continuously in a thermostatic bath with horizontal linear shaking (100 Hz) at 36 °C for 2 h. To adjust the pH to 6.8, it was added 0.4 mL of NaHCO3 3% (m/v).
Then, 3.0 mL of intestinal fluid (pH 6.5) was added, and the extract solution was shaken again using the same conditions as in the gastric digestion step, the samples were placed in an ice bath to stop the enzymatic activity (and consequently the simulated digestion) and were centrifuged to separate the supernatant. These supernatants were analyzed by ICP OES, resulting in the soluble fraction of Fe.
The dialysis procedure was performed to simulate nutrient absorption by human organisms. The membranes were initially treated before the dialysis step, they were washed in water for 3-4 h for the removal of glycerol, washed in Na2S (0.3% m/v) at 80 °C for 1 min, and stored
in H2SO4 (3% v/v). The supernatants (2 mL) were added
into bags made from cellulose membranes, tied with polyethylene tapes, and immersed into tubes filled with 30 mL of water. After 12 h, the membrane was carefully opened, and the solution was collected from inside and
Table 2. Instrumental conditions for Ca, Cu, Fe, K, Mg, P, S, and Zn determination by ICP OES
Power / W 1250
Nebulizer Meinhard
Spray chamber cyclonic
Plasma gas flow / (L min-1) 15
Intermediate gas flow / (L min-1) 1.0
Nebulizer gas flow / (L min-1) 0.45
Sample introduction / (L min-1) 1.5
Analytical wavelength / nm (axial view)
Ca (II) 318.1 Mg (II) 279.8
Cu (I) 324.7 P (I) 213.6
Fe (II) 259.8 S (I) 180.7
K (I) 769.8 Zn (I) 213.8
analyzed by ICP OES, and was designated as a dialyzed fraction of Fe. The bioaccessible fraction was calculated by subtracting the element’s concentration in the dialyzed fraction from that in the soluble fraction.32
Before the sample analyses by ICP OES, the soluble and dialyzed fractions were centrifuged and an aliquot of 3 mL of the supernatants was mixed with 0.5 mL of 10% v/v HNO3,
and the volume was increased to 5 mL with deionized water. The Fe determination was conducted at the above-mentioned robustness-tested settings of the spectrometer.
Statistical analyses
Cultivation of the adzuki bean sprouts (all treatments) and analyses were carried out in triplicate.
Statistical significance of differences (p < 0.05) in the results on Fe translocation, in each plant part separately, was analyzed in the Statistica 12.0 System Software (StatSoft, Inc., Tulsa, OK), using one-way analysis of variance (ANOVA). Student’s t-test at a 95% confidence limit was applied to the different groups of Fe-enriched sprouts that showed significant differences (p < 0.05), for comparison of the Fe-enriched and control groups.
In the edible part of the plant (sprouts), the obtained results (total concentrations of elements, proteins, and Fe-proteins) were compared by Student’s t-test at a 95% confidence limit.
Results and Discussion
The method for determination of Ca, Cu, Fe, K, Mg, P, S, and Zn by ICP OES
The limits of detection (LODs) were calculated by means of the equation LOD = 3 × BEC × RSD/100, where BEC = Crs / SBR, SBR = (Irs – Iblank) / Iblank (Crs is
the concentration of the multielemental reference solution, Irs and Iblank are the emission intensities for the
multielemental reference and blank solutions, respectively), and RSD is the relative standard deviation for 10 consecutive measurements of a blank solution.26,33,34 For
all analytes of interest, the LOD ranged from 0.01 (Zn) to 0.54 mg g−1 (K).
The absence of chemical interference was verified by the addition-and-recovery test, and the recovery rates ranged from 86 (S) to 116% (Zn). According to NBR ISO/IEC 17025,35 the recovery tolerance ranges from 80 to 120%.
Additionally, the accuracy was assessed by analyzing the SRM 1547, and it was attained good agreement, as indicated by Student’s t-test at the 95% confidence limit; it was obtained recoveries (comparison between certified and experimental results) that ranged from 96.5 (S) to 101% (P).
Uptake, translocation, and accumulation of Fe in adzuki bean sprouts: enrichment via different Fe compounds
The Fe concentration in different parts of the adzuki bean sprouts (root, cotyledon, and stem) in control and enrichment groups (FeCl3⋅6H2O, FeSO4⋅7H2O, and NaFeIII-EDTA) with
different masses of Fe (500, 1000, 2000, or 3000 µg) added to the culture medium are shown in Table 3. The standard deviations (SD) are related to the expanded error associated with instrumental measurements (n = 3) and the two digested solutions of each part of the plant.
After 13 days, the control and Fe-enriched sprouts showed similarities in color, odor, and length. Nevertheless, using FeCl3 or FeSO4 in the culture medium at Fe concentrations
higher than 1000 µg, a low sprout yield was observed: the germination process was inhibited, and the sprouts were intoxicated and unable to grow. Additionally, after the Fe enrichment via the chloride and sulfate, Fe accumulated both in the roots and cotyledon of the plants. The Fe translocation was not favored; instead, it noted a 39% increase when 1000 µg of Fe was added to the culture medium.
Table 3. Iron translocation from the root, cotyledon, and stem of the adzuki beans plant cultivated in Fe-enriched medium with different masses of iron added to the culture medium
Iron concentration ± standard deviation (n = 3) / (µg g-1)
Root
500 µg 1000 µg 2000 µg 3000 µg
FeSO4 150 ± 4b 173 ± 1b ND ND
FeCl3 199 ± 1b 340 ± 1b ND ND
FeIII-EDTA 65 ± 3a 79 ± 1b 143 ± 12b 145 ± 1b
Control 66 ± 1a
Cotyledon
500 µg 1000 µg 2000 µg 3000 µg
FeSO4 198 ± 1b 156 ± 1b ND ND
FeCl3 144 ± 1b 366 ± 1b ND ND
FeIII-EDTA 80 ± 1b 100 ± 1b 244 ± 1b 332 ± 22b
Control 54 ± 2a
Stem
500 µg 1000 µg 2000 µg 3000 µg
FeSO4 84 ± 3a 126 ± 2b ND ND
FeCl3 89 ± 1a 124 ± 1b ND ND
FeIII-EDTA 103 ± 5b 110 ± 2b 125 ± 1b 156 ± 2b
Control 89 ± 1a
a,bDifferent letters between the control and enrichment results of the same
After the enrichment via FeIII-EDTA, the Fe
concentration in the roots did not show a significant alteration when compared to the control and enrichment (500 µg) groups. In addition, the accumulation of Fe in the roots and cotyledons was less favored (500 and 1000 µg Fe) when compared to the enrichment via FeCl3 and FeSO4.
On the other hand, the highest enrichment potential of the edible part of the plant was observed after cultivation with FeIII-EDTA mass up to 3000 µg.
It should be pointed out that the Fe complex (coordination compound) was found to be less toxic and favored the translocation of Fe because (i) Fe enrichment of the culture medium with 3000 µg FeIII-EDTA resulted in
a 75% increase in the total Fe concentration in the stems; (ii) Fe accumulated less in the roots when compared to the other Fe salts; and (iii) produced mass and physical characteristics were similar between control and enriched sprouts.
Different Fe sources such as ferrous sulfate, ferrous fumarate, FeIII-EDTA, reduced Fe, electrolytic Fe, and Fe
glycinate chelate, with different bioavailability, can be used for the fortification food products such as wheat or corn flour. Studies have shown that the relative bioavailability can vary from 100 to 5% depending on the Fe source used for the fortification, and FeIII-EDTA is the compound that
shows higher bioavailability than the other compounds tested. The use of EDTA complexes has the potential to reduce the negative effect of antinutrients, such as oxalate and phytate, on mineral absorption in cereal grains and legumes.36
The absorption and translocation of Fe in plants are highly regulated, with reduced mobility in the xylem and incorporation into chloroplasts.37 The secretion of exudates
and Fe accumulation in cellular organelles in roots, e.g., vacuoles, immobilize Fe in roots.38 Furthermore, cations
absorbed by plant cells form complexes with organic compounds. Thus, due to the higher stability of the FeIII-EDTA molecule and the ability of the Fe complex to
move through the root without complexation with organic compounds, this Fe complex appears to be less toxic, and the Fe translocation was favored.38
Effects of enrichment on the distribution of Ca, Cu, Fe, K, P, Mg, S, and Zn
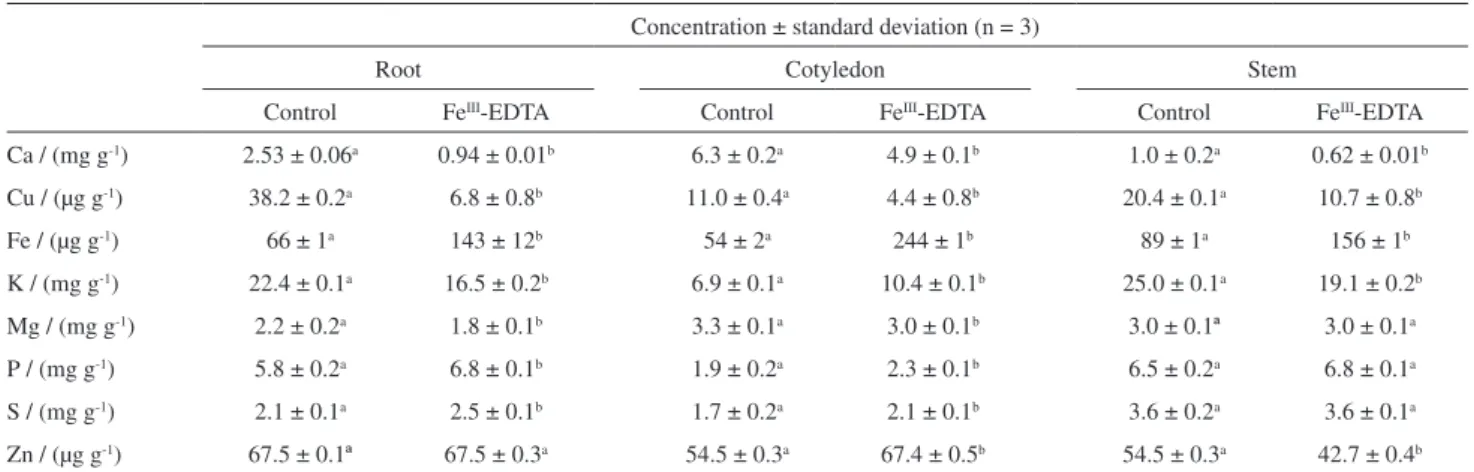
The effects of enrichment on the above distributions and elemental translocation were evaluated. The Ca, Cu, Fe, K, Mg, P, S, and Zn concentrations in the control and enrichment groups (FeIII-EDTA, 3000 µg) are shown in
Table 4. The SD are related to the expanded error associated with instrumental measurements (n = 3) and the two analyses of each sample.
As expected, Ca, K, Mg, P, and S can be considered the macroelements in those samples. In the roots, a decrease in the Ca (63%) and Cu (82%) concentrations and a 116 (Fe), 17 (P) and 19% (S) increase were observed as compared to the control group. In cotyledons, the concentration of most elements remained constant after the enrichment, except for Ca and Fe. In the stem, the concentration of Mg, P, and S did not change significantly after the Fe enrichment procedure.
Elemental competition was induced in Fe enrichment procedures, mainly when the elements show chemical similarities (elemental or ionic characteristics). Most plants absorb selenate due to its similarity to sulfate and metabolize it via the sulfur assimilation pathway.39 In the
literature,40 it was observed different antagonistic reactions
in the absorption and transport of Fe and Cu in plants. The mechanism of competition in elemental translocation between Cu and Fe is not well understood, but the similarity of the ionic radii of these elements has been suggested as
Table 4. Concentration of Ca, Cu, Fe, K, Mg, P, S, and Zn in different parts of the plant cultivated in iron enriched medium
Concentration ± standard deviation (n = 3)
Root Cotyledon Stem
Control FeIII-EDTA Control FeIII-EDTA Control FeIII-EDTA
Ca / (mg g-1) 2.53 ± 0.06a 0.94 ± 0.01b 6.3 ± 0.2a 4.9 ± 0.1b 1.0 ± 0.2a 0.62 ± 0.01b
Cu / (µg g-1) 38.2 ± 0.2a 6.8 ± 0.8b 11.0 ± 0.4a 4.4 ± 0.8b 20.4 ± 0.1a 10.7 ± 0.8b
Fe / (µg g-1) 66 ± 1a 143 ± 12b 54 ± 2a 244 ± 1b 89 ± 1a 156 ± 1b
K / (mg g-1) 22.4 ± 0.1a 16.5 ± 0.2b 6.9 ± 0.1a 10.4 ± 0.1b 25.0 ± 0.1a 19.1 ± 0.2b
Mg / (mg g-1) 2.2 ± 0.2a 1.8 ± 0.1b 3.3 ± 0.1a 3.0 ± 0.1b 3.0 ± 0.1ª 3.0 ± 0.1a
P / (mg g-1) 5.8 ± 0.2a 6.8 ± 0.1b 1.9 ± 0.2a 2.3 ± 0.1b 6.5 ± 0.2a 6.8 ± 0.1a
S / (mg g-1) 2.1 ± 0.1a 2.5 ± 0.1b 1.7 ± 0.2a 2.1 ± 0.1b 3.6 ± 0.2a 3.6 ± 0.1a
the possible cause for such competition and antagonistic reactions.38 In baby leaves, Ca enrichment promotes a
reduction in Mg content in all biofortified vegetables, confirming the antagonism between Ca and Mg.41 One of
the reasons justifying the foliar application of Zn to improve nutritional quality of pea seeds is the large amounts of N and P that decrease Zn uptake.42
Most people consume stems of adzuki bean sprouts. Thus, people eating 115 g (dry mass) of sprouts cultivated in the medium enriched with 3000 µg Fe (FeIII-EDTA)
should achieve the recommended daily allowance (18 mg).
Effects of enrichment on the distribution of proteins and Fe metalloproteins
The protein quantification was carried out by the Bradford method30 at a wavelength of 595 nm, and Fe
determination in the various extracts (water, NaCl, ethanol, and NaOH) was conducted by GF AAS. The characteristic parameters of the analytical calibration curves [linear range, correlation coefficient (R2), and sensitivity], and the LODs
and limits of quantification (LOQs) are shown in Table 5. The LOD was calculated from the standard deviation of 10 measurements of the analytical blank sample (3 × σblank, where σ is the standard deviation), and the LOQ was calculated as 3.3 × LOD.34 The LOD and LOQ values were
obtained considering a 200 mg sample and a final volume of 4 (water), 2 (NaCl, 1 mol L−1), 1 (ethanol, 70% v/v), and
10 mL (NaOH, 1 mol L−1).
After quantification of Fe in the different extracts (water, NaCl, ethanol, and NaOH) by GF AAS, the recovery rates were 92 (water), 82 (NaCl), 104 (ethanol), and 118% (NaOH), indicating the absence of chemical interference during the Fe analysis in the various extracts.
The extractants (water, NaCl, ethanol, and NaOH) promote separation of proteins from albumins, globulins, prolamins, and glutelins, respectively.34 In adzuki
beans, 84% of the proteins are albumins and globulins. Methionine, lysine, threonine, and tryptophan contents are higher in the albumin fraction than in the globulin fraction. On the other hand, the high concentration of glutamic and aspartic acids were found in the globulin fraction.42,43 The
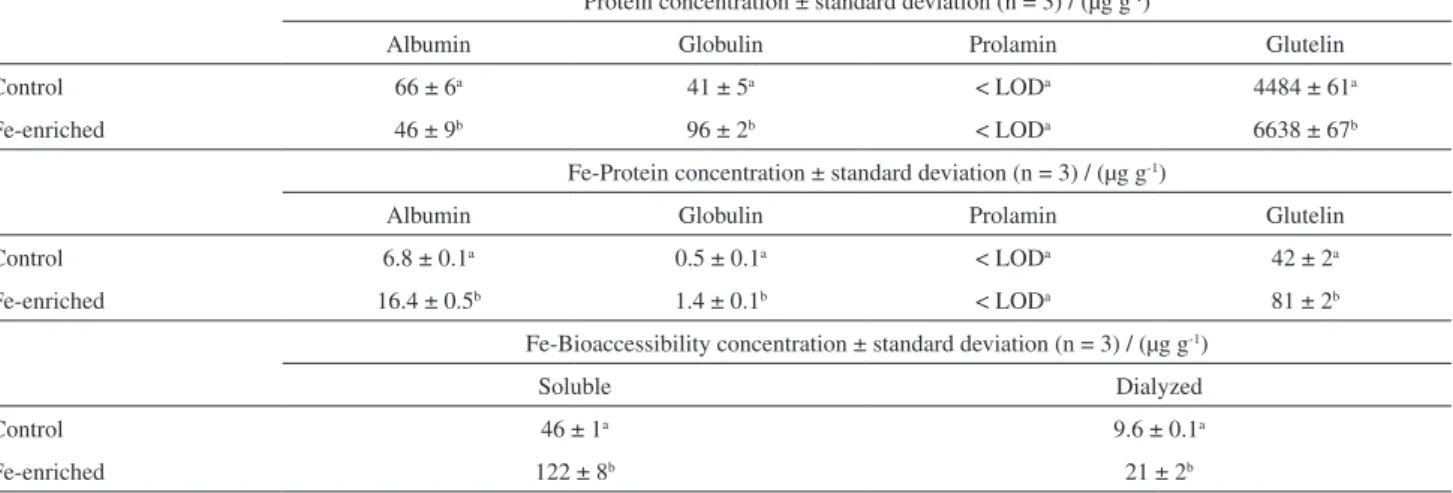
concentrations of albumin, globulin, prolamin, and glutelin, for the control and enriched (3000 µg FeIII-EDTA) groups
are presented in Table 6. Solubility of a protein depends on amino acid composition and results from thermodynamic equilibrium between the protein-protein interaction and the protein-solvent interaction; the solubility is related to the hydrophilicity-hydrophobicity balance.4,44 The
enrichment via FeIII-EDTA altered the distribution of
albumins, globulins, and glutelins in the stems, thus causing a significant increase in globulin (134%) and glutelin (48%) concentrations and 30% downregulation of albumins.
Fe association with different proteins in the edible part of the plants (stems) determined by GF AAS is shown in Table 6. As a result of comparison with total Fe concentration (Table 4), Fe distribution among different proteins was as follows: for the control group, 8 (albumin), 0.5 (globulin), and 49% (glutelins); and for the enrichment group, it was 10 (albumins), 0.9 (globulins), and 52% (glutelins).
After the increase in the total Fe concentration with the 3000 µg FeIII-EDTA enrichment, the interaction of this
essential element with various proteins was also promoted. Additionally, the enrichment did not significantly alter the percentages of Fe associated with albumins, globulins, and glutelins in relation to the control group when compared to the total concentration of Fe in stems: 7.6, 0.6, 0, and
Table 5. Characteristic parameters of the analytical calibration curve, LOD, and LOQ obtained for proteins determination by Bradford method and iron determination by GF AAS
Bradford method
Linear range / (µg mL-1) R2 Sensitivity Analytical blank LOD / (µg g-1) LOQ / (µg g-1)
2-12 0.9929 0.042
water 6.8 22.4
NaCl 9.1 30.1
ethanol 6.2 20.5
NaOH 1.9 6.3
GF AAS
Linear range / (µg L-1) R2 Sensitivity Analytical blank LOD / (ng g-1) LOQ / (ng g-1)
10-80 0.9995 0.004
water 32 106
NaCl 34 112
ethanol 7 23
47.2% (control group) and 10.5, 0.6, 0, and 51.9% (enriched group) of Fe were found to be associated with albumins, globulins, prolamins, and glutelins, respectively. Therefore, the percentage of Fe associated with different protein groups did not change significantly after the enrichment procedure. The main amino acids in albumins, globulins, prolamins, and glutelins, such as methionine, cysteine, glutamic acid, arginine, aspartic acid, and lysine, are rich in sulfur and charged groups.45-48 These amino acids have
high affinity for ions of transition metals, such as Fe.49
It is important to point out that the fractionation experiments in this work are the first step toward nutritional information about Fe-enriched adzuki bean sprouts. The studies on the association of Fe with proteins are important because protein-bound elements are released during digestion, thus facilitating their absorption by the human body. Obviously, besides the chemical speciation studies, the bioaccessible and bioavailable fraction should be quantified, mainly during enrichment procedures, to identify the fraction of the compound or bioactive nutrient present in an enriched food that is available for use in physical or biochemical functions or to be stored in the organism.
Effects of enrichment on Fe bioaccessibility
In vitro assays simulating the gastrointestinal digestion of foods are relevant to the bioaccessibility studies. This procedure is more rapid, less expensive, less labor-intensive, and does not have ethical restrictions, when compared with
in vivo methods.50 Additionally, the results obtained in the in vitro procedures can help with the planning of in vivo
studies, minimizing time and costs.
The Fe bioaccessibility in control group and Fe-enriched bean sprouts (FeIII-EDTA) using in vitro methods was
predicted by analysis of the gastrointestinal product before (soluble fraction) and after dialysis (dialyzed fraction). The bioaccessible concentration was determined by subtracting the concentration found in the dialyzed fraction from that in the soluble fraction. The results are shown in Table 6.
The soluble percentages were 52 (control group) and 78% (Fe-enriched group), and bioaccessible percentages were 79 (control group) and 83% (Fe-enriched group), which were calculated considering, respectively, the Fe concentrations in the digested samples (Table 4) and soluble fractions (Table 6).
On the basis of the statistical data, it is possible to observe that the enrichment processes increased the concentration of soluble Fe and did not alter the percentage of Fe bioaccessible in terms of the soluble fraction in the control and enriched sprouts.
The bioaccessibility of an element depends not only on the matrix but also on the chemical form of the analyte.51
Therefore, the results of bioaccessibility studies show the effectiveness of the enrichment process in the bioaccessible Fe fraction in the edible part of the Fe-enriched plant.
The Fe bioavailability in foods varies according to the chemical species; nonheme Fe is found in foods of plant origin and is present in metaflavoproteins involved in oxidative metabolism, Fe-sulfur proteins, and inorganic Fe species (FeII and FeIII), in which chemical species of
FeII are more available than FeIII because of the greater
solubility in the intestinal lumen of divalent Fe species.52 In
addition, only soluble nonheme Fe can be absorbed in vivo
because Fe from vegetable sources is less available than Fe from animal sources owing to the presence of dietary fiber associated with oxalates, phosphates, phytates, and tannins that form insoluble complexes with nonheme Fe and limit elemental absorption.6
Table 6. Proteins and Fe-proteins concentrations in edible plant part (control and enriched sprouts groups)
Protein concentration ± standard deviation (n = 3) / (µg g-1)
Albumin Globulin Prolamin Glutelin
Control 66 ± 6a 41 ± 5a < LODa 4484 ± 61a
Fe-enriched 46 ± 9b 96 ± 2b < LODa 6638 ± 67b
Fe-Protein concentration ± standard deviation (n = 3) / (µg g-1)
Albumin Globulin Prolamin Glutelin
Control 6.8 ± 0.1a 0.5 ± 0.1a < LODa 42 ± 2a
Fe-enriched 16.4 ± 0.5b 1.4 ± 0.1b < LODa 81 ± 2b
Fe-Bioaccessibility concentration ± standard deviation (n = 3) / (µg g-1)
Soluble Dialyzed
Control 46 ± 1a 9.6 ± 0.1a
Fe-enriched 122 ± 8b 21 ± 2b
Feasibility of enriching sprouts with Fe: salts versus chelate
The most widely used Fe sources to correct Fe deficiencies or to promote plant enrichment are inorganic Fe forms, and ferrous sulfate is added to fertilizers.20,52 Nonetheless, Fe
applied to soil can be fixed in plant roots because of various chemical reactions35,36 and due to the low mobility in plant
tissue. The use of fertilizers containing inorganic forms or a chelate of Fe requires high concentrations to achieve a significant increase in the Fe concentration in the edible plant part. Although there is a large difference between the costs of Fe-chelated sources and Fe salts, the addition of high Fe-EDTA concentration to the culture medium promotes elemental translocation without affecting the germination process, growth, and physical characteristics of the plant. Therefore, the Fe chelate (Fe-EDTA) is the most effective compound for the production of enriched edible sprouts under the conditions described when compared to the inorganic forms (FeCl3 and FeSO4).
Conclusions
The Fe enrichment of adzuki bean sprouts depends on the chemical species used in the cultivation. The addition of FeIII-EDTA is the most effective procedure for the Fe
translocation to edible parts of plants and does not significantly alter most macronutrient levels in the plant, but changes the nutritional balance in relation to the protein distribution.
The inclusion of adzuki bean sprouts enriched with Fe in the daily diet is a promising way to meet the daily intake recommendations of essential elements, especially Fe. In addition to the successful enrichment of bean sprouts, studies on chemical speciation are extremely important because they allow to identify and quantify the chemical forms in which the element is present in the matrix, resulting in information about the absorption, bioavailability, and bioaccessibility. Thus, consumption of sprouts with food enrichment procedures is a good alternative to pharmacological supplementation for correction of nutritional deficiencies related to specific elements in combination with products that contribute to the dissemination of healthy and functional foods.
Finally, the results obtained in this work suggest that this method of sprout enrichment with Fe is a promising tool for production of foods with functional properties that may be effective against anemia.
Acknowledgments
The authors are grateful to Professors Pedro Vitoriano de Oliveira and Cassiana Seimi Nomura, both from the
Chemistry Institute of the São Paulo University, for the support of the laboratory infrastructure. A. P. O. thanks Fundação de Amparo à Pesquisa do Estado de São Paulo/ FAPESP (2015/01128-6) for the fellowship provided. J. N. thanks FAPESP for the financial support (2015/15510-0).
References
1. Wijayanti, N.; Katz, N.; Curr. Med. Chem.2004, 11, 981. 2. Cakmak, I.; Pfeiffer, W. H.; McLafferty, B.; Cereal Chem.2010,
87, 10.
3. Moura, N. C.; Canniatti-Brazaca, S. G.; Food Sci. Technol.
2006, 26, 270.
4. Dolan, S. P.; Capar, S. G.; J. Food Compos. Anal. 2002, 15, 593. 5. Brigide, P.; Canniatti-Brazaca, S. G.; Silva, M. O.; Food Sci.
Technol.2014, 34, 493.
6. Oliveira, A. P.; Naozuka, J.; J. Braz. Chem. Soc.2015, 26, 2144. 7. Bellenda, B.; LEISA -Revista de Agroecología2005, 21, 29. 8. Luo, Y.; Xie, W.; Luo, F.; J. Food Sci.2012, 77, 1023. 9. Meng, G.-T.; Ching, K.-M.; Ma, C.-Y.; Food Chem.2002, 79,
93.
10. Sato, S.; Yamate, J.; Hori, Y.; Hatai, A.; Nozawa, M.; Sagai, M.;
J. Nutr. Biochem.2005, 16, 547.
11. Yousif, A. M.; Deeth, H. C.; Food Chem.2003, 81, 169. 12. McGill Jr., J. A.; Mich. Dry Bean Digest1995, 19, 4. 13. Kumar, V.; Sinha, A. K.; Makkar, H. P. S., Becker, K.; Food
Chem.2010, 120, 945.
14. Yuan, L.; Wu, L.; Yang, C.; Lv, Q.; J. Sci. Food Agric.2013,
93, 254.
15. Lintschinger, J.; Fuchs, N.; Moser, J.; Kuehnelt, D.; Goessler, W.; J. Agric. Food Chem.2000, 48, 5362.
16. Wei, Y.; Shohag, M. J. L.; Ying, F.; Yang, X.; Wu, C.; Wang, Y.;
Food Chem.2013, 138, 1952.
17. Kopsell, D. A.; Sams, C. E.; Barickman, T. C.; Deyton, D. E.;
HortScience2009, 44, 438.
18. Lee, G. J.; Kang, B. K.; Kim, T. J.; Kim, J. H.; Acta Hortic.
2007, 761, 443.
19. Tsuneyoshi, T.; Yoshida, J.; Takashi, S.; J. Nutr.2006, 136, 870S.
20. Hell, R.; Stephan, U. W.; Planta 2003, 216, 541.
21. Briat, J. F. In Oxidative Stress in Plants; Inze, D.; Montagu, M. V., eds.; Taylor and Francis: New York, 2002, p. 171. 22. Oliveira A. P.; Naozuka, J.; J. Braz. Chem. Soc.2015, 26, 2144. 23. Araújo, G. C. L.; Gonzalez, M. H.; Ferreira, A. G.; Nogueira,
A. R. A.; Nóbrega, J. A.; Spectrochim. Acta2002, 57B, 2121. 24. Sangroni, E.; Machado, C. J.; LWT Food Sci. Technol.2007,
40, 116.
25. Machado, A. L. L.; Barcelos, M. F. P.; Teixeira, A. H. R.; Ciênc. Tecnol. Aliment.2009,33, 1071.
26. Naozuka, J.; Vieira, E. C.; Nascimento, A. N.; Oliveira, P. V.;
27. Mermet, J. M.; Poussel, E.; Appl. Spectrosc.1995, 49, 12. 28. Naozuka, J.; Oliveira, P. V.; J. Braz. Chem. Soc.2007, 18, 1547. 29. Do, Q. D.; Angkawijaya, A. E.; Tran-Nguyen, P. L.; Huynh,
L. H.; Soetaredjo, F. E.; Ismadji, S.; Ju, Y.; J. Food Drug Anal.
2014, 22, 296.
30. Bradford, M. M.; Anal. Biochem.1976, 72, 248.
31. United States Pharmacopoeia Convention, United States Pharmacopeia In United States Pharmacopeia USP24-NF19; The United States Pharmacopeial Convention: Rockville, MD, 2000, p. 2235.
32. Nascimento, A. N.; Naozuka, J.; Oliveira, P. V.; Microchem. J.
2010, 96, 58.
33. International Union of Pure and Applied Chemistry (IUPAC);
Spectrochim. Acta1978, 33B, 241.
34. Silva, J. C. J.; Cadore, S.; Nóbrega, J. A.; Food Addit. Contam.
2007, 24, 130.
35. Burin, R.; Burin, V. M.; Taha, P.; Bordignon-Luiz, M. T.; Ciênc. Tecnol. Aliment.2008, 28, 973.
36. Rebellato, A. P.; Pacheco, B. C.; Prado, J. P.; Pallone, J. A. L.;
Food Res. Int.2015, 77, 385.
37. Scheid, A. L.; Micronutrientes: Filosofias de Aplicação e Eficiência Agronômica; ANDA: São Paulo, Brasil, 1999. 38. Römheld, V.; Marschner, H.; Plant Physiol.1986, 80, 175. 39. El Mehdawi, A. F.; Quinn, C. F.; Pilon-Smits, E. A. H.; Curr.
Biol.2011, 21, 1440.
40. Kabata-Pendias, A.; Pendias, H.; Trace Elements in Soils and plants, 3rd ed.; CRC Press: Boca Raton, 2001.
41. D’Imperio, M.; Renna, M.; Cadinali, A.; Buttaro, D.; Serio, F.; Santamaria, P.; Food Chem.2016, 213, 149.
42. Pandey, N.; Gupta, B.; Pathak, G. C.; Sci. Hortic.2013, 164, 474.
43. Tjahjadi, C.; Lin, S.; Breene, W. M.; J. Food Sci.1998, 53, 1438.
44. Harnly, J. M.; Pastor-Corrales, M. A.; Luthria, D. L.; J. Agric. Food Chem.2009, 57, 8705.
45. Naozuka, J.; Oliveira, P. V.; J. Braz. Chem. Soc.2012, 23, 156. 46. Garcia, R. M.; Arocena, R. V.; Laurena, A. C.; Tecson-Mendoza,
E. M.; J. Agric. Food Chem.2005, 53, 1734.
47. Moreno, F. J.; Jenkins, J. A.; Mellon, F. A.; Rigby, N. M.; Robertson, J. A.; Wellner, N.; Mills, E. N. C.; Biochim. Biophys. Acta, Proteins Proteomics2004, 1698, 175.
48. Sun, S. S. M.; Leung, F. W.; Tomic, J. C.; J. Agric. Food Chem.
1987, 35, 232.
49. Garcia, J. S.; Magalhães, C. S.; Arruda, M. A. Z.; Talanta2006,
69, 1.
50. Minekus, M.; Alminger, M.; Alvito, P.; Ballance, S.; Bohn, T.; Bourlieu, C.; Carrière, F.; Boutrou, R.; Corredig, M.; Dupont, D.; Dufour, C.; Egger, L.; Golding, M.; Karakaya, S.; Kirkhus, B.; Le Feunteun, S.; Lesmes, U.; Macierzanka, A.; Mackie, A. R.; McClements, D. J.; Ménard, O.; Recio, I.; Santos, C. N.; Singh, R. P.; Vegarud, G. E.; Wickham, M. S. J.; Weitschies, W.; Brodkorb A.; Food Funct.2014,5, 1113.
51. Leufroy, A.; Noël, L.; Beauchemin, D.; Guérin, T.; Anal. Bioanal. Chem.2012, 402, 2849.
52. Ortega-Blu, R.; Molina-Roco, M.; Agrociencia2007, 41, 491.