Ar
ti
cl
e
0103 - 5053 $6.00+0.00
*e-mail: [email protected]
Validation of the Determination of Fatty Acids in Milk by Gas Chromatography
Julliana Isabelle Simionato,c Juliana Carla Garcia,a Geraldo Tadeu dos Santos,b Cláudio Celestino Oliveira,a Jesui Vergilio Visentainera and Nilson Evelázio de Souza*,a
aDepartamento de Química, Universidade Estadual de Maringá, Av. Colombo, 5790,
87020-900 Maringá-PR, Brazil
bDepartamento de Zootecnia, Universidade Estadual de Maringá, Av. Colombo, 5790,
87020-900 Maringá-PR, Brazil
cDepartamento de Estudos Básicos e Instrumentais, Universidade Estadual do Sudoeste da Bahia,
Praça Primavera, 40, 45700-000 Itapetinga-BA, Brazil
Foram analisados os ésteres metílicos de ácidos graxos (FAMEs) em amostras comerciais de leite empregando cromatograia gasosa acoplada ao detector por ionização em chama. Os ácidos graxos saturados (SFA) foram os mais abundantes. Os principais SFA encontrados foram o ácido palmítico (16:0), o ácido esteárico (18:0) e o ácido mirístico (14:0). Foram obtidas diferenças signiicativas (P < 0,500) entre as quantidades de ácido palmítico (276 ± 17 mg g-1 e 248 ± 20 mg g-1) e ácido mirístico (95 ± 5 mg g-1 e 85 ± 7 mg g-1) nas amostras analisadas. Entretanto, não foi observada uma diferença signiicativa para o ácido esteárico (113 ± 6 mg g-1 e 114 ± 11 mg g-1). O isômero conjugado do ácido linoleico (CLA) 18:2c9t11 foi detectado nas amostras e quantiicado. Para este ácido, as diferenças encontradas nas amostras analisadas não foram signiicativas (10,4 ± 0,7 mg g-1 e 9,9 ± 0,6 mg g-1). A análise de uma amostra do material de referência certiicado de leite (RM-8435 NIST) mostrou uma boa recuperação (> 80%) indicando que o método pode ser aplicado para determinar eicientemente ácidos graxos em amostras de leite e em produtos lácteos.
Fatty acid methyl esters (FAMEs) in commercial milk samples were analyzed by gas chromatography coupled with lame ionization detection. The saturated fatty acids (SFA) were the most abundant. The major SFA were palmitic acid (16:0), estearic acid (18:0), and myristic acid (14:0). Signiicant differences (P < 0.500) were found between the amounts of palmitic acid (276 ± 17 mg g-1 and 248 ± 20 mg g-1) and myristic acid (95 ± 5 mg g-1 and 85 ± 7 mg g-1) in samples. However, no difference was observed for estearic acid (113 ± 6 mg g-1 and 114 ± 11 mg g-1). The conjugated linoleic acid (CLA) isomer 18:2c9t11 was detected in the samples and quantiied. However, the differences found between the samples analyzed were not signiicant (10.4 ± 0.7 mg g-1 and 9.9 ± 0.6 mg g-1). The analysis of a certiied reference powder milk sample (RM-8435 NIST) gave good recoveries (> 80%), indicating that the method can eficiently determine fatty acids in milk and dairy products.
Keywords: validation analytical methods, conjugated linoleic acid, milk, fatty acids
Introduction
The advancement of the chemical study of foods is in great part due to the development of gas chromatography (GC). The advancements in gas-liquid chromatography had an impact on the study of fatty acids, contributing, among other things, to the detailed investigation of positional and geometric isomers with distinct biological
functions that could not be separated or identiied until then.1-3
reagent, incomplete extraction of FAMEs, and the loss of very volatile short-chain FAMEs.4 Thus, the search for
methods that minimize such interferences is warranted. Flame ionization detection is the most convenient method to analyze food fatty acids by gas chromatography. However, the flame ionization detector response is differential, that is, the magnitude of the signal is proportional to the number of active carbons. Thus, methyl esters with different carbon chains will respond differently, which requires the use of correction factors.5, 6
The addition of an internal standard has been largely used in the analysis of fatty acids, as it allows expressing the results in mass. This method is less susceptible to errors because the internal standard and the sample are injected together. The use of conversion factors allows expressing the results as fatty acid mass rather than FAME mass.6, 7
The most used derivatization processes in the analysis of fatty acids involve acid and basic catalysis.4 Basic catalysis
with either NaOCH3 or KOH in methanol at room temperature is considered the most reliable technique in the identiication of fatty acid conjugated isomers, such as linoleic acid, as it does not produce either isomerization or artifacts. Furthermore, it reduces the loss of short-chain fatty acids. However, KOH in methanol does not react with free fatty acids and does not fully methylate phospholipids, which makes the results of quantiication of fatty acids in highly acidic samples unreliable.8 Methylation by acid catalysis with BF
3, HCl,
or H2SO4 favors the extensive isomerization of conjugated dienes and contributes to the formation of methoxylated allylic artifacts and slows down chromatographic analysis.8
The objective of the present work was to validate the basic esteriication methodology and the analysis of FAMEs in milk samples by gas chromatography.
Experimental
Sampling
Two pasteurized milk brands from the Middle Eastern Region of Paraná State were analyzed. Five different lots of each brand were collected and immediately frozen for later triplicate analysis (n = 15).
Fatty acids analysis
The total lipids were determined by the Folch et al.9
method with chloroform, methanol, and water (2:1:1). The lipids were converted into FAMEs as described by Bannon et al.10 with modiications.
To a screw-cap tube containing approximately 150 mg lipids was added 5.0 mL 0.25 mol L-1 sodium methoxide in
methanol-diethyl ether (1:1) and it was vigorously agitated for about 3 min. Next, 3.0 mL of isooctane and 15 mL of saturated sodium chloride were added. The tube was vigorously agitated again and rested until phase separation. The supernatant was collected in labeled Eppendorf
lasks for later chromatographic analysis. The original method includes fast heating under relux after the addition of the transesterifying agent; however, this was not done to prevent the isomerization of the conjugated dienes of linoleic acid. FAMEs were analyzed by gas chromatography in Varian model CP-3380 equipped with a lame ionization detector and a fused silica capillary column (100 m × 0.25 mm i.d. ×
0.39 µm 100% bonded cyanopropyl, Varian, EUA). The gas low rates (White Martins) used were 1.4 mL min-1
carrier gas (H2), 30 mL min-1 make-up gas (N
2), and 30
and 300 mL min-1 lame gases, H
2 and lame synthetic air,
respectively. The sample injection rate (split) was 1/100. The injector and detector temperatures were 235 °C. The
column temperature was programmed to 65 °C for 4 min, followed by a ramp of 16 °C min-1 up to 185 °C, which was
kept for 12 min. A second ramp of 20 ° C min-1 was run up to
235 °C for 14 min. The total analysis time was 40 min. The
peak areas were determined using Software Star (Varian). Injections of 2 µL were performed in triplicate.
Identiication of fatty acids
The identiication of fatty acids was based on the comparison of retention times of standard methyl esters containing linoleic acid geometric isomers c9t11 and t10c12 (189-19 and O-5626, Sigma, USA) and on equivalent chain length (ECL).
The ECL of fatty acid esters were determined according to Ackman11 based on ECL values determined for standard
189-9 (Sigma, USA).
The fatty acids in mg g-1 total lipids were quantiied in
relation to the internal standard, methyl tricosanoate (23:0) from Sigma. Before transesteriication, 1.00 mL of internal standard solution (1 mg mL-1) was added to all samples and
the solvent was evaporated under N2 low.
The sample fatty acids were quantified after the veriication of the agreement between the theoretical and experimental response factors.
The sample fatty acid concentrations were calculated according to Joseph and Ackman1, using the equation 1:
(1)
Sample mass (g); TRF = Theoretical response factor of FAMEs and FCT = Conversion factor to express the results in mg fatty acids/g total lipids (TL).
Equipment validation
To assess the response of the lame ionization detector, the theoretical response factors were calculated for methyl tricosanoate as proposed by Ackman.11 Next,
the experimental response factors for the methyl esters were determined by analyzing a 189-19 (Sigma, USA) standard mixture in n-heptane containing these esters and 0.25 mg mL-1 methyl tricosanoate.
The solution was injected in ive repetitions and the experimental correction factors of the different esters were determined from the methyl ester areas and masses. The equation 2 can be written as:
ECF = Mx . AS / MS . Ax (2)
where: Mx = Methyl ester mass X; Mx = Methyl ester area X; MS= Standard mass and AS= Standard area.
The theoretical correction factors (TCF) were calculated based on the internal standard methyl tricosanoate from values published by Bannon et al..12
Method validation
The linear analytical range was determined by using an analytical curve constructed plotting methyl α linolenoate/
methyl tricosanoate (internal standard) peak area ratio (Y)
vs. injected amount of the methyl α linolenoate (X). The
linear analytical ranges for the other methyl esters were estimated by using response factors.
The precision of the method was estimated for all steps processing the certiied sample three times in the chromatographic system. The limits of detection (LOD) and quantiication (LOQ) were estimated by triplicate analysis of the certiied sample extract (RM-8435) after successive dilution and considering the signal to noise rate relative to the background signal as 3 and 10, respectively.13
The accuracy was verified by the analysis of the certiied reference powder milk (RM-8435) obtained from the National Institute of Standards and Technology from Canada, NIST-USA. The reference material was submitted to the same procedures as the experimental samples.
Statistical analysis
The results were submitted to variance analysis (ANOVA) at 5% probability and the means were compared
by Tukey test with software Statistica version 7.0 (Statsoft, 2005).14
Results and Discussion
The quantiication of fatty acids using internal standards has been extensively used because of its reliability and easy interpretation. However, the differential response of the lame ionization detector must be taken into consideration and correction factors must be employed.11 Thus, the
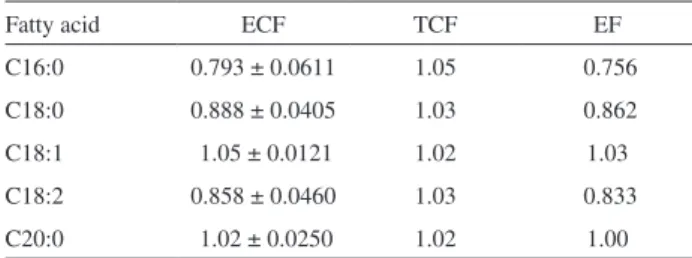
validation of the equipment used is required to verify the agreement between the theoretical and the experimental response factors. The ideal is to obtain results with an error factor (EF) close to one, as in this way the results obtained will be highly accurate. Table 1 gives the experimental (ECF) and theoretical (TCF) correction factors and the error factor (EF). After checking the agreement between the ECF and the TEF, it is recommendable to use the theoretical factors in quantitative determinations of fatty acids, especially unsaturated fatty acids (Bannon et al.).12
The chain length values equivalent to the chain lengths of the major fatty acids found in milk are given in Table 2. Thus, based on ECL and known standards of CLA, 27 fatty acids in fat of the analyzed milk samples (Figure 1) were tentatively identified and quantified and their quantiication is given in Table 3.
In agreement with previous reports,14 SAF were the most
abundant in the milk samples analyzed. Among the SFA, the most abundant were palmitic acid (16:0), estearic acid (18:0), and myristic acid (14:0). Palmitic acid predominated in all analyzed samples. Signiicant differences (P < 0.500) were found between samples for the amounts of palmitic acid (276 ± 17 mg g-1 and 248 ± 20 mg g-1) and myristic
acid (95 ± 6 mg g-1 and 85 ± 7 mg g-1). However, no
difference was observed for estearic acid (113 ± 6 mg g-1
and 114 ± 11 mg g-1) (P < 0.5).
Signiicant differences (P < 0.500) were also observed for the summation of SFA in the different samples
Table 1. Experimental and theoretical correction factors and error factor the gas chromatograph Varian CP-3380
Fatty acid ECF TCF EF
C16:0 0.793 ± 0.0611 1.05 0.756
C18:0 0.888 ± 0.0405 1.03 0.862
C18:1 1.05 ± 0.0121 1.02 1.03
C18:2 0.858 ± 0.0460 1.03 0.833
C20:0 1.02 ± 0.0250 1.02 1.00
(616a ± 19 mg g-1 and 564b ± 24 mg g-1). Milk, as well as
milk derivatives, has long been considered cardiovascular health hazards due to their high amounts of SFA.
Table 2. Equivalent chain length (ECL) calculated based on the corrected methyl ester retention times and the respective angular, linear, and correction coeficients for the linear regression analysis of the ECL values
FAME Reference ECL1 Calculated ECL2
Y = 0.1372 X - 1.8425 R2:0.9983
4:0 4.02 3.98
6:0 6.05 6.08
8:0 8.07 7.98
10:0 10.04 9.79
11:0 11.22 10.90
12:0 12.1 11.96
13:0 13.03 13.02
14:0 14 14.06
i15:0 14.51 14.52
15:0 14.98 15.10
i16:0 15.51 15.55
16:0 16 16.13
16:1n-5 16.37 16.45
17:1n-9 17.23 17.15
18:0 17.65 17.46
18:1n-9 18.21 18.17
18:1n-7 18.26 18.41
18:3n-6 18.92 18.90
18:3n-3 19.25 19.22
1Visentainer and Franco,6 Column DB-WAX 20M (50 m × 0.22 mm ×
0.25 µm; 200 °C/42 min). 2Column CP-7420 (100 m × 0.25 mm i.d. ×
0.39 µm, 100% bound cyanopropyl, Varian, USA; 200 °C/30 min).
Figure 1. Lipid proile of milk samples. (1) 4:0, (2) 6:0, (3) 8:0; (4) 10:0, (5) 11:0, (6) 12:0, (7) 14:0, (8) 14:1n-11, (9) 14:1n-9, (10) 14:1n-7, (11) 15:0, (12) 15:1n-7, (13) 16:0, (14) 16:1n-11, (15) 16:1n-9, (16) 16:1n-7, (17) 17:0, (18) 17:1n-7, (19) 18:0, (20) 18:1t, (21) 18:1n-9, (22) 18:1n-7, (23) 18:2n-6t, (24) 18:2n-6, (25) 18:3n-3, (26) 18:2c9t11, (27) 23:0 (Standard).
Table 3. Fatty acids in mg g-1 total lipids in pasteurized milk
Fatty acid Sample A Sample B
4:0 36 ± 6 37 ± 3
6:0 17a ±1 14b ± 2
8:0 10a ± 0 8b ± 1
10:0 21a ± 1 18b ± 2
11:0 2 ± 0 3 ± 0
12:0 25a ± 1 21b ± 2
14:0 95a ± 6 85b ± 7
14:1n-11 4 ± 0 4 ± 0
14:1n-9 13a ± 1 11b ± 1
14:1n-7 7 ± 0 6 ± 0
15:0 12± 1 11± 1
15:1n-7 3 ± 0 3 ± 0
16:0 276a ± 17 248b ± 20
16:1n-11 15 ± 1 14 ± 1
16:1n-9 12a ± 1 11b ± 1
16:1n-7 4 ± 0 4 ± 0
i17:0 5 ± 0 5 ± 0
17:0 9 ± 1 8 ± 1
17:1n-7 3 ± 0 3± 0
18:0 113 ± 6 114 ± 10
18:1 t 31 ± 1 31 ± 3
18:1n-9 215 ± 14 213 ± 10
18:1n-7 4 ± 1 4 ± 1
18:2n-6t 10 ± 1 10 ± 1
18:2n-6 14 ± 1 14 ± 1
18:3n-3 4 ± 0 4 ± 0
18:2c9t11 10 ± 1 10 ± 1
SFA 621a ± 20 572b ± 24
MUFA 311 ± 14 301 ± 20
PUFA 38 ± 2 38 ± 2
n-6 24 ± 1 24 ± 1
n-3 4 ± 0 4 ± 0
n-6/n-3 6 ± 0 6 ± 0
Results given as means and standard deviations of triplicate analyses of three different lots (n = 15) of each sample. SFA = Saturated fatty acids, MUFA = Monounsaturated fatty acids, PUFA = Polyunsaturated fatty acids, n-6 = Omega-6 fatty acids, n-3 = Omega-3 fatty acids. Means followed by different letters in the same line are signiicantly different by Tukey test at 5% probability.
Palmitic acid is associated with increased cholesterol in blood, while estearic acid is not, as it is quickly converted into oleic acid, a monounsaturated fatty acid, in the organism.16-18 However, these products are sources of
important fatty acids for the human health, such as essential fatty acids omega-6 and omega-3, in addition to CLA.
were observed between the two milk brands analyzed (10.4 ± 0.7 mg g-1 and 9.9 ± 0.6 mg g-1).
The analytical method presented a typical precision of 10%, including the sample preparation step and, the LOD and LOQ were estimated as 0.15 and 0.48 mg g-1
of oil. The analytical curves were linear from 0.05 up to 100.00 mg mL-1, R2 = 0.9991, with the following equation:
Y = –0.668 + 8.95 X, where Y is the chromatographic response and X the methyl ester concentration. Reference material (RM 8435 NIST) was assayed to estimate the accuracy of the method used in the quantiication of fatty acids in milk and its derivatives. The certiied samples were submitted to the same method as the experimental samples. As shown in Table 4, the percent recovery was signiicant, over 90% (except for 16:1n-9 and 18:1n-9). Thus, the method used can be applied in the quantiication of fatty acids in commercial milk samples.
It should be stressed that the analytical method is adequate to CLA quantiication in milk samples and to furnish important data in the ield, which is not common in the literature. Furthermore, it was shown that it is possible to determine CLA without the fast heating under relux in the sample preparation step, which avoided the isomerization of the conjugated dienes of linoleic acid.
Conclusion
The recovery results of the certiied milk sample were good, showing that the derivatization method used to determine fatty acids in milk samples is appropriate. Thus,
fatty acids, such as linoleic acid, can be safely separated and quantiied by GC coupled with lame ionization detector.
Acknowledgment
The authors are grateful to CAPES and CNPq for the inancial support.
References
1. Joseph, J. D.; Ackman, R. G.; J. AOAC Int.1992, 75, 488. 2. Martin, C. A.; Oliveira, C. C.; Visentainer, J. V.; Matsushita,
M.; De Souza, N. E.; Anal. Sci. 2006,22, 631.
3. Martin, C. A.; Oliveira, C. C.; Visentainer, J. V.; Matsushita, M.; De Souza, N. E.; J. Chromatogr., A2008, 1194, 111. 4. Milinsk, M. C.; Matsushita, M.; Visentainer, J. V.; Oliveira, C.
C.; De Souza, N. E.; J. Braz. Chem. Soc.2008, 19, 1475. 5. Collins, C. H.; Braga G. L.; Bonato, P. S.; Fundamentos de
Cromatograia, Editora Unicamp: Campinas, Brasil,2006. 6. Visentainer, J. V.; Franco, M. R. B.; Ácidos Graxos em Óleos
e Gorduras: Identiicação e Quantiicação, Varela: São Paulo, Brasil, 2006.
7. Ackman, R. G.; Sipos, J. C.; J. Am. Oil Chem. Soc. 1964, 41, 377.
8. Fuente, M. A.; Luna, P.; Juarez, M.; TrAC, Trends Anal. Chem.
2006,25, 917.
9. Folch, J.; Lees, M.; Stanley, G. H. S.; J. Biol. Chem. 1957,226, 497.
10. Bannon, C. D.; Craske, J. D.; Hai, N. T.; Harper, N. L.; O’Rourke, K. L.; J. Chromatogr., A1982, 247, 63.
11. Ackman, R. G.; Progr. Chem. Fats Other Lipids,1972,12, 165. 12. Bannon, C. D.; Craske, J. D.; Hilliker, A. E.; J. Am. Oil Chem.
Soc. 1986, 63, 105.
13. Analytical Methods Committee; Analyst 1987, 112, 199. 14. StatSoft. Statistica 7.0 Software. Tucksa, USA, 2005. 15. Seçkin, K. A.; Gursoy, O.; Kinik, O.; Akbulut, N.; Food Sci.
Technol. Int.2005,38, 909.
16. Grundy, S. M.; Am. J. Clin. Nutr.1997,66, 988S.
17. Mustad, V. A.: Etherton, T. D.: Cooper, A. D.; Mastro, A. M.; Pearson, T. A.; Jonnalagadda, S. S.; Kris-Etherton, P. M.; J. Lipid Res.1997,38, 459.
18. Schaefer, E. J.; Am. J. Clin. Nutr. 2002,75, 191.
19. Mourão, D. M.; Monteiro, J. B. R.; Costa, N. M. B.; Stringheta, P. C.; Minin, V. P. R.; Dias, C. M. G. C.; Braz. J. Nutr.2005,
18, 391.
20. Thalpur, F. N.; Bhanger, M. I.; Khuhawar, M. Y.; J. Food Comp. Anal.2006,19, 698.
Received: May 25, 2009 Web Release Date: December 11, 2009
Table 4. Certiied milk sample analysis results (RM-8435 NIST)
Fatty acid Experimental values (%)
Theoretical values* (%)
% Recovery
4:0 4.97 ± 0.44 4.84 102.85
10:0 3.58 ± 0.19 3.29 108.86
12:0 3.89 ± 0.07 3.80 102.23
14:0 12.48 ± 0.06 12.77 97.71
14:1n-9 1.11 ± 0.01 1.03 107.23
15:0 1.30 ± 0.01 1.42 91.34
16:0 31.67 ± 0.50 33.38 94.88
16:1n-9 1.16 ± 0.06 1.41 82.54
17:0 0.85 ± 0.01 0.90 94.79
18:0 11.35 ± 0.35 11.78 96.27
18:1n-9 14.46 ± 0.24 16.62 87.00
20:0 0.24 ± 0.08 0.24 100.24