http://www.uem.br/acta ISSN printed: 1806-2636 ISSN on-line: 1807-8672
Acta Scientiarum
Doi: 10.4025/actascianimsci.v34i4.14728
Meat quality from four genetic groups of bulls slaughtered at 14
months old
Roberto Haruyoshi Ito1, Maribel Velandia Valero1, Rodolpho Martin do Prado1, Dayane Cristina Rivaroli1, Daniel Perotto2 and Ivanor Nunes do Prado3*
1
Departamento de Zootecnia, Universidade Estadual de Maringá, Maringá, Paraná, Brazil. 2
Polo Regional de Pesquisa Agropecuária de Curitiba, Coordenação de Pesquisa, Área de Melhoramento e Reprodução Animal, Instituto Agronômico do Paraná, Pinhais, Paraná, Brazil.
3
Departamento de Zootecnia, Universidade Estadual de Maringá, Av. Colombo, 5790, 87020-900, Maringá, Paraná, Brazil. *Author for correspondence. E-mail: [email protected]
ABSTRACT. Carcass characteristics and chemical composition of Longissimus muscle of 32 young bulls from four genetic groups slaughtered at 14 months old were evaluated. Experimental design was completely randomized and distributed into four genetics groups: 1. Caracu (CAR); 2. Canchin (CAN); 3. Charolais vs. Caracu (CHC) and 4. Aberdeen Angus vs. Canchin (AAC). Carcass dressing and carcass conformation were lower for CAR than CAN, CHC and AAC genetic groups. No difference has been reported with regard to moisture, ash, crude protein, total lipids and total cholesterol among four genetics groups. The genetic groups influence fatty acid profile on Longissimus muscle in bulls. Cattle with zebu genes had the highest rates in unsaturated fatty acids, saturated fatty acids represented approximately 50% of total fatty acid composition on Longissimus muscle. The genetic groups presented differences in PUFA, SFA, n-6 and n-3 percentages and n-6 and n-3 ratios.
Keywords: crossbreed, production systems, total cholesterol, total lipids.
Qualidade da carne de bovinos não castrados de quatro grupos genéticos abatidos aos
14 meses de idade
RESUMO. Este trabalho foi realizado para avaliar as características de carcaça e composição química do músculo Longissimus de 32 bovinos não castrados de quatro grupos genéticos abatidos aos 14 meses de idade. Foi usado um modelo experimental inteiramente casualizado e distribuídos em quatro grupos genéticos: 1. Caracu (CAR); 2. Canchin (CAN); 3. Charolês vs. Caracu (CHC) e 4. Aberdeen Angus vs. Canchin (AAC). O rendimento e a conformação de carcaça foram menores para os animais do grupo genético CAR em comparação ao grupo genético CAN, CHC e AAC. Não houve diferença para umidade, cinzas, proteína bruta e colesterol total entre os quatros grupos genéticos. O grupo genético teve influência sobre o perfil de ácidos graxos do músculo Longissimus dos bovinos. Os bovinos com genes zebu tiveram maiores níveis de ácidos graxos saturados. Os ácidos graxos saturados representaram aproximadamente 50% da composição dos ácidos graxos do músculo Longissimus. O grupo genético teve efeito nas percentagens de ácidos graxos saturados e poliinsaturados, n-3 e n-6 e sobre a razão entre n-6 e n-3.
Palavras-chave: cruzamento, sistema de produção, colesterol total, lipídeos totais.
Introduction
Carcass production characterized by adequate weight and subcutaneous fat thickness that guarantees meat quality during the chilling process is essential in beef cattle-production system (SUGUISAWA et al., 2006). According Perotto et al. (2000), weight increase and better quality carcass are the benefits that crossbreeds between Bos taurus taurus and Bos taurus indicus provide to beef cattle. Since cattle breed is one of the most important factors for fat deposition and composition (MAGGIONI et al., 2009, 2010; PRADO et al., 2008d, 2009b; ROTTA et al., 2009a and b) it should be understood
major genes, one of which is the double-muscled gene in cattle. It is rather difficult to assess the real genetic contribution to differences in meat quality. Comparison of breed is often confused with other effects, such as fat level, body weight, age at slaughter and production system (ARICETTI et al., 2008; KAZAMA et al., 2008; PRADO et al., 2008a, b and c; ROTTA et al., 2009a and b; WEBB, 2006).
The fatty acid profile of meat is highly relevant for two main reasons: it determines nutritional value, and it affects various aspects of meat quality, including shelf life and flavor (WOOD et al., 2003). Nutritional value is partially determined by the ratio between polyunsaturated fatty acids (PUFA) and saturated fatty acids (SFA) in the meat, and by the balance between fatty acids of the n-6 and n-3 series. In general, ratio PUFA:SFA above 0.45 and ratio n -6:n-3 below 4.0 are required in the diet against several “life style diseases”, such as coronary heart diseases and cancers (HMSO, 1994).
Current analysis evaluates the carcass characteristics, chemical and fatty acid composition of Caracu, Canchin (5/8 Charolais vs. 3/8 Zebu), Charolais vs. Caracu and Aberdeen Angus vs. Canchin bulls finished in feedlot and slaughtered at 14 months old.
Material and methods
Animal management and sampling
The Animal Production Committee of the State University of Maringá approved this study (CIOMS/OMS, 1985) which was carried out on the Model Farm Experimental Station of the Paraná Agronomic Institute (IAPAR) in Ponta Grossa, Paraná, Brazil. Thirty-two bulls from four different genetic groups were used. The experimental design was randomized and distributed according to the following groups: 1. CAR – Caracu, 2. CAN – Canchin (5/8 Charolais vs. 3/8 Zebu), 3. CHC – ½ Charolais vs. ½ Caracu and 4. AAC – ½ Aberdeen Angus vs. ½ Canchin, with eight replications each. The bulls were weaned at 90 days and remained on hermartria (Hermarthria altissima) pastures grown with supplementation based on 1.5 kg animal-1 day-1
of the mixture 25% soybean meal + 73% corn grain + 2% mineral salt. After this period, the bulls remained on hermartria pastures during 6 months (spring and summer) without supplementation. Bulls were then finished in feedlot during 150 days in individual 8 m2 covered stalls, provided with
concrete floor, feeder for roughage, concentrate, mineral salt and water trough regulated by an automatic ball system. Initial weights were 294, 278, 295 and 285 kg respectively for CAR, CAN, CHC
and AAC genetic groups. The bulls were weighed at the beginning of the experiment, at 8h00 in the morning. Periodic weights were undertaken at every 28 days, with fasting of solid for 16 hours, obtained by total withdrawal of food on the previous day at 16:00h. The bulls received a diet with 12% crude protein and 72% total digestible nutrients. Forage consisted of corn silage and concentrate (25% soybean meal, 73% corn grain and 2% mineral salt). The ratio roughage:concentrate was 52:48, and the formulation was expected to provide a weight gain of 1.4 kg day-1, according to NRC recommendations
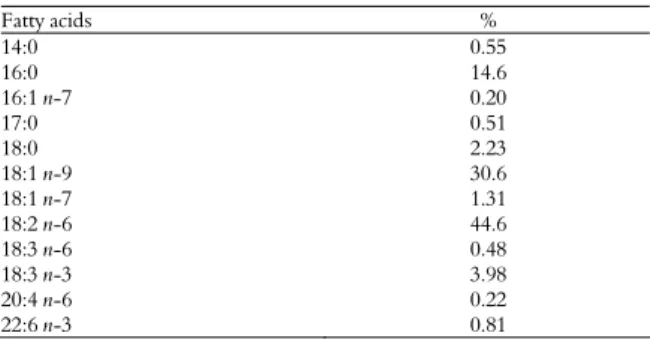
(NRC, 1996). Table 1 shows the composition of fatty acids of the experimental diet. Table 2 shows the chemical composition of the diet.
Table 1. Composition of fatty acid of the experimental diet.
Fatty acids %
14:0 0.55
16:0 14.6
16:1 n-7 0.20
17:0 0.51 18:0 2.23
18:1 n-9 30.6
18:1 n-7 1.31
18:2 n-6 44.6
18:3 n-6 0.48
18:3 n-3 3.98
20:4 n-6 0.22
22:6 n-3 0.81
The animals were slaughtered at a commercial slaughterhouse 90 km from Ponta Grossa Research Farm, according to industrial practices in Brazil. After slaughter, the carcasses were identified and chilled for 24h at 4oC. After chilling, the right part of
the carcass was used to determine the quantitative characteristics. Twenty-four hours later, Longissimus
muscle samples were taken by a complete cross section between the 12th and 13th ribs. The fat
thickness was discarded and the muscle portion was frozen at -20°C for further analyses.
Table 2. Chemical composition of experimental diets (%DM).
Feed (% of DM) Composition
Concentrate Corn Silage
Dry Matter 88.0 92.3
Crude Protein 18.7 6.16
Ether extract 7.04 3.05
Ashes 3.10 4.60
Neutral detergent fiber 19.5 58.6
Acid detergent fiber 6.69 27.6
Carcass characteristics
Hot carcass weight (HCW): Weight was determined before chilling.
Carcass conformation (CON): CON was evaluated by Müller’s point scale (MÜLLER, 1980), in which the highest value indicated the best conformation; muscle development was calculated after the exclusion of thickness fat. Carcass conformation was reported as superior, very good, good, regular, poor, and inferior; ratings were also qualified as plus, average, and minus. The carcass length was evaluated by measurements taken from the skull board to the pubic bone on the anterior side of the first rib.
Fat thickness (FAT): FAT was calculated by a caliper averaging three points between the 12th and
13th ribs on the Longissimus muscle (LM).
Longissimus muscle area (LMA): The right part of the carcass was measured after a cross section cut was made between the 12th and 13th ribs using a
compensating planimeter which measures areas of irregularly-shaped objects.
Color (COL): Muscle color was analyzed after 24-hour carcass chilling. Color was evaluated according to a point scale 30 min after a cross-sectional cut was made on the Longissimus muscle between the 12th and 13th ribs (MÜLLER, 1980).
Marbling (MAR): MAR was measured in the LM between 12th and 13th ribs, following scores
described by MÜLLER (1980).
Percentage of muscle (MUS), fat (FAT) and bone (BON): Muscle, fat and bone were physically separated from the Longissimus section, which corresponded to the 10th, 11th and 12th ribs, and
individually weighed according to Hankins and Howe (1946). Data were regressed to equations by Müller (1980) – the model converted the data to values corresponding to the 9th, 10th, and 11th ribs, as follows:
% M = 6.292 + 0.910 X1 % B = 2.117 + 0.860 X3 % F = 1.526 + 0.913 X2
in which:
X1, X2 and X3 represented muscle, fat and bone percentages.
Rates corresponding to the 9th, 10th and 11th ribs
were regressed to equations, following Hankins and Howe (1946) to find the percentages of muscle (MUS), fat (FAT) and bone (BON).
MUS = 15.56 + 0.81 M; FAT = 3.06 + 0.82 F; BON = 4.30 + 0.61 B.
in which:
M, F and B are the muscle, fat and bone estimates from equations by Müller (1980).
After 24 hours, LM samples were taken by complete cross-section between the 12th and 13th ribs
and were immediately taken to the laboratory. Cover fat was discarded and the muscle portion was frozen at -20oC for later analysis.
Chemical composition
Laboratory analyses of meat were carried out two months after sampling. The samples were defrosted at room temperature (20ºC), ground, homogenized and analyzed in triplicate. Meat moisture and ash contents were determined according to AOAC (1998). Crude protein content was obtained by Kjeldahl method (AOAC, 1998) and total lipids were extracted by Bligh and Dyer (1959) method, with a chloroform methanol-1 mixture. Cholesterol analysis was carried
out by method modified by Rowe et al. (1999). A 60% (w v-1) solution of potassium hydroxide was
added to the samples in quantities equivalent to 2 mL h-1 of sample under 1-h reflux. The residue was
dissolved again in 2 mL hexane containing 0.2 mg mL-1 5-α cholestane internal standard (IS) (Sigma,
USA). Cholesterol content was analyzed in 14-A gas chromatograph (Shimadzu, Japan), equipped with flame ionization detector and fused silica capillary column (25 m long, 0.25-mm internal diameter, and 0.20 μm Ohio Valley-30). Injector, column and detector temperatures were respectively 260, 280, and 280ºC. Ultra-pure gas fluxes (White Martins) of 1.5 mL min.-1 H2 as carrier gas, 30 mL min.-1 N2 as
make-up gas, 300 mL min.-1 synthetic gas, and 30 mL
min.-1 N2 for flame were used. The sample injection
split mode was: 1:150. Peak integration was carried out with CG-300 computing integrator (CG Instruments, Brazil) and cholesterol was identified by comparison with standards from Sigma (USA). Sample cholesterol quantification was carried out after verification of method linearity. Standard cholesterol solutions (Sigma, USA) were prepared with concentrations 0.0, 0.4, 0.8, 1.6 and 2.0 mg mL-1,
containing 0.20 mg mL-1 5α-cholestane (Sigma,
USA), and analyzed. The ratio between cholesterol areas and 5-α cholestane was plotted against the cholesterol concentration for injected volumes of 0.0, 2.0, 3.0, 4.0 and 5.0 μL. The curve obtained was used for cholesterol analysis in mg 100 g-1.
Fatty acid methyl esters (FAME) were prepared by triacylglycerol methylation, according to ISO (1978) method. Fatty acids methyl esters (FAMEs) were analyzed in gas chromatograph (Varian, USA) equipped with flame ionization detector and fused silica capillary column CP-7420 (100 m, 0.25 mm and 0.39 μmol day-1, Varian, USA) Select Fame.
18 min., 180oC (30oC min.-1) for 22 min., and 240oC
(15oC min.-1) for 30 min., with 45-psi pressure. The
injector and detector were kept respectively at 220 and 245oC. The gases fluxes (White Martins) were:
1.4 mL min.-1 for the carrier gas (H
2); 30 mL min.-1
for the make-up gas (N2) and 30 mL min.-1 and 300
mL min.-1 for H
2 and the synthetic flame gas,
respectively. Sample injection split mode was 1/80. Fatty acids were identified by comparing the relative retention times of FAME peaks of the samples with fatty acids methyl ester standards from Sigma (USA) by spiking samples with standard. The peak areas were determined by Star software (Varian) and data were expressed as percentages of the normalized area of fatty acids.
Statistical analyses
Statistical analyses were interpreted by analysis of variance and differences evaluated by Tukey’s test 5%, analyzed by SAS (2000) program as model:
Yij = μ + GGi + eij
in which:
Yij “j” is the animal observation subjected to trial “i”;
μ - general constant;
GGi – trial effect i; i = 1, ..., 4; in which 1 = CAR; 2 = CAN; 3 = CHC and 4 = AAC;
eij – random error associated with each observation.
Results and discussion
Carcass characteristics
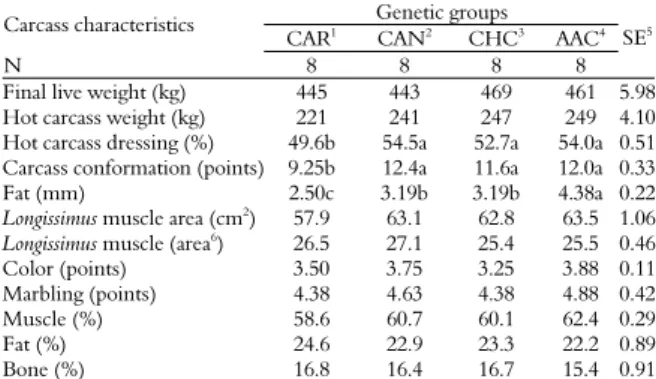
There was no difference (p > 0.05) among genetic groups for final live weight and hot carcass weight of bulls slaughtered at 14 months old (Table 3). Although there was no difference among treatments, the slaughter weight of different genetic groups revealed that CAR and CAN genetic bull groups failed to achieve the final weight of 450 kg. In spite of the fact that CHC and AAC genetic groups achieved the final weight of 469 and 461 kg, the two groups did not present adequate finishing level. In fact, such groups have large body frames requiring higher finishing level and body weight.
Carcass dressing and carcass conformation were lower (p < 0.05) for CAR genetic group (49.6% and 9.25 points) when compared to CAN (54.5% and 12.4 points), CHC (52.7% and 11.6 points) and AAC (54.0% and 12.0 points) genetic groups. These results show that CAR genetic group may not be slaughtered with 445 kg body weight due to low fat characteristics. However, Rotta et al. (2009a)
evaluated the carcass characteristics of Nellore, Caracu and Holstein bulls finished in feedlot and observed higher rates of carcass dressing (52.8%) and conformation (12.9 points) for Caracu genetic group. Perotto et al. (2000) evaluated the quantitative characteristics of carcasses of Charolais, Caracu and reciprocal cross finished in feedlot and registered higher rates in carcass dressing and conformation to Caracu genetic group. The superior carcass dressing and carcass conformation for CAN, CHC and AAC genetic groups may be explained by their high proportion of British breed genes, as these animals are known for their favorable carcass quality. The less favorable carcass dressing and conformation of the CAR genetic group might be due to higher percentage of tropical breed genes.
Table 3. Carcass characteristics of different genetic groups of bulls slaughtered at 14 months old.
Genetic groups Carcass characteristics
CAR1
CAN2
CHC3
AAC4
N 8 8 8 8
SE5
Final live weight (kg) 445 443 469 461 5.98
Hot carcass weight (kg) 221 241 247 249 4.10
Hot carcass dressing (%) 49.6b 54.5a 52.7a 54.0a 0.51
Carcass conformation (points) 9.25b 12.4a 11.6a 12.0a 0.33
Fat (mm) 2.50c 3.19b 3.19b 4.38a 0.22
Longissimus muscle area (cm2) 57.9 63.1 62.8 63.5 1.06
Longissimus muscle (area6) 26.5 27.1 25.4 25.5 0.46
Color (points) 3.50 3.75 3.25 3.88 0.11
Marbling (points) 4.38 4.63 4.38 4.88 0.42
Muscle (%) 58.6 60.7 60.1 62.4 0.29
Fat (%) 24.6 22.9 23.3 22.2 0.89
Bone (%) 16.8 16.4 16.7 15.4 0.91
1Caracu, 2Canchin, 3Charolais vs. Caracu, 4Aberdeen Angus vs. Canchin, 5Stardard
errors, 6100 kg of carcass. Means on the same line with different letters are different by
Tukey’s test (p < 0.05).
Fat thickness was highest (p < 0.05) in AAC (4.38 mm) genetic group and lowest in CAR (2.50 mm) genetic group. CAN (3.19 mm) and CHC (3.19 mm) genetic groups provided intermediate rates. This fact may be explained by differences in fat accumulation in Aberdeen Angus and Charolais breeds. The fat thickness noted in CAN, CHC and AAC meets the guidelines of the Brazilian market, which requires that fat thickness of carcasses must range between 3 and 6 mm (MÜLLER, 1980). Similar results for fat thickness in CAR genetic group were observed by Rotta et al. (2009a) with 2.88 mm. This shows that CAR genetic group still did not reach 3.0 mm of fat thickness, which is the appropriate slaughter fat in Brazil.
The average for Longissimus muscle area and
Longissimus muscle area 100 kg-1 carcass were similar
were classified as red-colored. They are therefore within the beef intake standards for the Brazilian market. Further, marbling was classified as average among the different genetic groups. Although medium marbling is well accepted within the Brazilian market, beef should feature more enhanced marbling to reach foreign markets, especially those in North America.
Muscle, fat and bone percentages were not influenced (p > 0.05) by genetic groups and showed averages of 60.2, 23.5 and 15.5%, respectively. Although fat thickness was higher than 4.3 mm in AAC genetic group and lower than 2.5 mm in CAR genetic group, it did not influence carcass fat deposition.
Chemical composition
Differences (p > 0.05) existed in moisture, ashes, crude protein, total lipids and total cholesterol among different genetics groups (Table 4) on
Longissimus muscle.
Table 4. Chemical composition of Longissimus muscle of different genetic groups of bulls slaughtered at 14 months old.
Genetic groups Parameters
CAR1 CAN2CHC3AAC4
N 8 8 8 8
SE5
Moisture (%) 72.7 73.3 72.7 72.6 0.17
Ash (%) 1.04 1.03 1.01 1.06 0.11
Crude protein (%) 22.8 22.4 22.8 22.7 0.16
Total lipids (%) 1.38 1.32 1.38 1.39 0.02
Total cholesterol (mg 100 g-1muscle) 36.3 36.7 36.5 36.4 0.18
1Caracu, 2Canchin, 3Charolais vs. Caracu, 4Aberdeen Angus vs. Canchin, 5Stardard
errors.
The mean rates of moisture, ashes and crude protein were 72.8, 1.03 and 22.7%, respectively. These results were similar to those found by Ducatti et al. (2009) who evaluated chemical and fatty acids composition of different genetic groups (Purunã 1st
generation; Purunã 2nd generation; Caracu; Canchin vs. Angus and Charolês vs. Caracu) and the mean values observed were 73.3, 0.97% and 22.5%, respectively. According to these results, moisture, ashes and crude protein rates did not show any variations owing to the genetic groups. However, total lipids and total cholesterol rates reported by Ducatti et al. (2009) were higher (2.16% and 42.0 mg 100 g-1 of muscle) than those in current analysis
(1.37% and 36.6 mg 100 g-1 of muscle). Kazama et al.
(2008); Rotta et al. (2009a and b) also reported higher total cholesterol rates when compared to those in current experiment.
Fatty acid composition
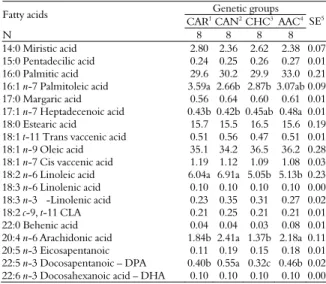
Table 5 shows the composition of fatty acids in the
Longissimus muscle. Diversity in fatty acids in cattle is partly due to bio-hydrogenation reactions that occur in the rumen (TAMMINGA; DOREAU, 1991).
Palmitoleic acid (C16:1 n-7) levels were higher (p < 0.05) in CAR bulls and lower in CAN and CHC ones. C17:1 n-7 levels were higher (p < 0.05) in AAC bulls and lower in CAR and CAN ones. Linoleic acid (C18:2 n-6) levels were similar (p > 0.05) between CAR and CAN bulls and CHC and AAC bulls, but higher (p < 0.05) in CAR and CAN when compared to CHC and AAC bulls. Arachidonic acid (C20:4 n-6) levels were similar (p > 0.05) in CAN and AAC and CAR and CHC bulls, but superior (p < 0.05) in CAN and AAC bulls when compared to those in CAR and CHC bulls. Docosapentaneoic acid – DPA (C22:5 n-3) levels were higher (p < 0.05) in CAN bulls, intermediate in CAR and AAC bulls, and lower in CHC bulls.
Table 5. Fatty acid composition in different genetic groups of bulls slaughtered at 14 months old.
Genetic groups Fatty acids
CAR1 CAN2 CHC3AAC4
N 8 8 8 8
SE5
14:0 Miristic acid 2.80 2.36 2.62 2.38 0.07
15:0 Pentadecilic acid 0.24 0.25 0.26 0.27 0.01
16:0 Palmitic acid 29.6 30.2 29.9 33.0 0.21
16:1 n-7 Palmitoleic acid 3.59a 2.66b 2.87b 3.07ab 0.09
17:0 Margaric acid 0.56 0.64 0.60 0.61 0.01
17:1 n-7 Heptadecenoic acid 0.43b 0.42b 0.45ab 0.48a 0.01
18:0 Estearic acid 15.7 15.5 16.5 15.6 0.19
18:1 t-11 Trans vaccenic acid 0.51 0.56 0.47 0.51 0.01
18:1 n-9 Oleic acid 35.1 34.2 36.5 36.2 0.28
18:1 n-7 Cis vaccenic acid 1.19 1.12 1.09 1.08 0.03
18:2 n-6 Linoleic acid 6.04a 6.91a 5.05b 5.13b 0.23
18:3 n-6 Linolenic acid 0.10 0.10 0.10 0.10 0.00
18:3 n-3 -Linolenic acid 0.23 0.35 0.31 0.27 0.02
18:2 c-9, t-11 CLA 0.21 0.25 0.21 0.21 0.01
22:0 Behenic acid 0.04 0.04 0.03 0.08 0.01
20:4 n-6 Arachidonic acid 1.84b 2.41a 1.37b 2.18a 0.11
20:5 n-3 Eicosapentanoic 0.11 0.19 0.15 0.18 0.01
22:5 n-3 Docosapentanoic – DPA 0.40b 0.55a 0.32c 0.46b 0.02
22:6 n-3 Docosahexanoic acid – DHA 0.10 0.10 0.10 0.10 0.00
1Caracu, 2Canchin, 3Charolais vs. Caracu, 4Aberdeen Angus vs. Canchin, 5Stardard errors.
Means on the same line with different letters are different by Tukey’s test (p < 0.05).
Prado et al. (2008a and b) suggested that genetic groups were a major factor associated with variations in the fatty acid profile. The fatty acids 12:0, 14:0 and 16:0 were considered hypercholesterolemic; they increased the quantity of lipoproteins of low density lipoprotein (LDL), which cause heart disease (HMSO, 1994). Food with low amounts of fatty acids is therefore required. In the Longissimus muscle of cattle the percentage of 14:0 and 16:0 was considered high (30% of total fatty acids) (PRADO et al., 2008a and b; ROTTA et al., 2009b). Though the fatty acid 18:2 n-6 is considered essential, it is related to the imbalance of n-6/n-3 ratio. This occurs by the high presence of the fatty acid in the
and CAN genetic groups. The fatty acid 18:3 n-3 is considered strictly essential and the presence of the fatty acid is important due to its capacity to form other important fatty acids (WOOD et al., 2003).
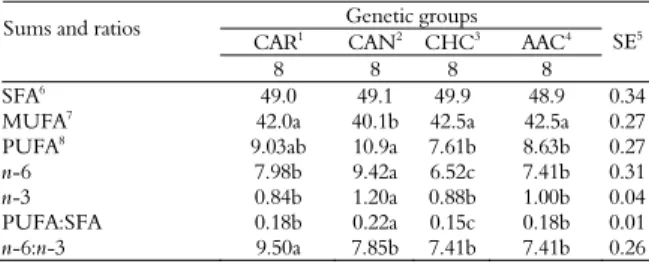
There was no difference among (p > 0.05) genetic groups with regard to saturated fatty acids (SFA) (Table 6). SFA represented approximately 49% of total fatty acid composition analyzed on
Longissimus muscle of bulls from four genetic groups slaughtered at 14 months old. The MUFA levels were lower (p < 0.05) for CAN genetic groups when compared to those of CAR, CHC and AAC genetic groups. However, MUFA levels were similar (p > 0.05) among CAR, CHC and AAC genetic groups.
PUFA levels were higher (p < 0.05) for CAR and CAN genetic groups. However, CAR and CAN genetic groups and CHC and AAC genetic groups presented no difference (p > 0.05) among themselves. Genetic groups with zebu genes in their composition (CAN) showed high percentages of PUFA (ROTTA et al., 2009a). Prado et al. (2008a and b) suggested that zebu genes caused more deposition of connective tissues, with high rates of polyunsaturated fatty acids.
Table 6. Fatty acids sum and ratio between the fatty acids of
Longissimus muscle of different genetic groups slaughtered at 14
months old.
Genetic groups Sums and ratios
CAR1 CAN2 CHC3 AAC4
8 8 8 8
SE5
SFA6 49.0 49.1 49.9 48.9 0.34
MUFA7
42.0a 40.1b 42.5a 42.5a 0.27
PUFA8 9.03ab 10.9a 7.61b 8.63b 0.27
n-6 7.98b 9.42a 6.52c 7.41b 0.31
n-3 0.84b 1.20a 0.88b 1.00b 0.04
PUFA:SFA 0.18b 0.22a 0.15c 0.18b 0.01
n-6:n-3 9.50a 7.85b 7.41b 7.41b 0.26
1Caracu, 2Canchin, 3Charolais vs. Caracu, 4Aberdeen Angus vs. Canchin. 5Stardard
errors, 6Saturated fatty acids, 7Monounsaturated fatty acids, 8Polyunsaturated fatty acids.
Means on the same line with different letters are different by Tukey’s test (p < 0.05).
Whereas CAN genetic group presented the highest n-6 percentages, CHC had the lowest percentages and CAR and AAC had intermediate percentages (Table 6). The n-6 percentage ranged between 6.5 and 9.4%. The genetic groups with zebu genes in their composition showed high percentages of fatty acids in Longissumus muscle (PRADO et al., 2008a and b), due to the fact that these genetic groups have more PUFA in their fatty acid profile (ROTTA et al., 2009b).
The n-3 percentages were higher (p < 0.05) in CAN genetic groups. However, there was no difference (p > 0.05) among CAR, CHC and AAC genetic groups.
PUFA:SFA ratio was higher (p < 0.05) for CAN genetic group and lower (p < 0.05) for CHC
genetic group (Table 6). PUFA:SFA ratio was similar (p > 0.05) between CAR and AAC genetic groups. PUFA:SFA ranges between 0.15 and 0.22. PUFA:SFA ratio plays an important role in reducing the risk of coronary heart disease (HU, 2001). The British Health Department (HMSO, 1994) recommended a ratio of 0.45. The genetic groups close to this value were those with zebu genes (CAN) in their composition. However, the observed value in this research is far from recommended.
The n-6:n-3 ratio was higher (p < 0.05) for CAR genetic group. However, there was no difference (p > 0.05) among CAN, CHC and AAC genetic groups. According to the British Health Department (HMSO, 1994), the recommended n-6:n-3 ratio is 4:1. The observed values in this work were higher when compared to the ideal.
Conclusion
Crossbreeding between European breeds produce higher carcass dressing and carcass conformation due to genetic improvements accumulated over decades. Further, genetic groups have a certain influence on fatty acid profile of the
Longissimus muscle in bulls finished in feedlot. The difference is related to the origin of the various genetic groups. Cattle with zebu genes have the highest levels of unsaturated fatty acids due to their fiber composition and higher percentage of muscle collagen. However, genetic manipulation only produced a small variation in meat composition.
Acknowledgements
This study was funded by the Araucaria Foundation and Brazilian Council for Research and Technological Development (CNPq).
References
AOAC-Association of Official Analytical Chemists. Official Methods of Analysis of AOAC International. 14th ed. Arlington: AOAC International, 1998.
ARICETTI, J. A.; ROTTA, P. P.; PRADO, R. M.; PEROTTO, D.; MOLETTA, J. L.; MATSUSHITA, M.; PRADO, I. N. Carcass characteristics, chemical composition and fatty acid profile of Longissimus muscle of bulls and steers finished in a pasture system. Asian Australasian Journal of Animal Science, v. 21, n. 10, p. 1441-1448, 2008.
biomedical research involving animals. Geneva: WHO, 1985.
DUCATTI, T.; PRADO, I. N.; ROTTA, P. P.; PRADO, R. M.; PEROTTO, D.; MAGGIONI, D.; VISENTAINER, J. V. Chemical composition and fatty acid profile in crossbred (Bos taurus vs. Bos indicus) young bulls finished in feedlot. Asian Australasian Journal of Animal Science, v. 22, n. 3, p. 433-439, 2009.
HANKINS, O. G.; HOWE, P. E. Estimation of the composition of beef carcasses and cuts. Technical Bulletin U.S.D.A., n. 926, p. 1-20, 1946.
HMSO-England Department of Health. Nutritional aspects of cardiovascular disease. London: HMSO, 1994. (Report on Health and Social Subjects, 46).
HU, F. B. The balance between ω-6 and ω-3 fatty acids and the risk of coronary heart disease. Nutrition, n. 17, p. 741-742, 2001.
ISO-International Organization for Standardization. Animal and vegetable fats and oils. Preparation of methyl esters of fatty acids. Geneva: ISO, 1978. (ISO5509, 01-06).
KAZAMA, R.; ZEOULA, L. M.; PRADO, I. N.; SILVA, D. C.; DUCATTI, T.; MATSUSHITA, M. Quantitative and qualitative carcass characteristics of heifers fed different energy sources on a cottonseed hulls and soybean hulls based diet. Brazilian Journal of Animal Science, v. 37, n. 2, p. 350-357, 2008.
MAGGIONI, D.; MARQUES, J. A.; ROTTA, P. P.; PEROTTO, D.; DUCATTI, T.; VISENTAINER, J. V.; PRADO, I. N. Animal performance and meat quality of crossbred young bulls. Livestock Science, v. 127, p. 176-182, 2010.
MAGGIONI, D.; MARQUES, J. A.; PEROTTO, D.; ROTTA, P. P.; DUCATTI, T.; MATSUSHITA, M.; SILVA, R. R.; PRADO, I. N. Bermuda grass hay or sorghum silage with or without yeast addition on performance and carcass characteristics of crossbred young bulls finished in feedlot. Asian Australasian Journal of Animal Science, v. 22, n. 2, p. 206-215, 2009.
MÜLLER, L. Normas para avaliação de carcaças e concurso de carcaça de novilhos. 1. ed. Santa Maria: UFSM, 1980. NRC-National Research Council. Nutrient Requirements of Beef Cattle. 6th ed. Washington, D.C.: National Academy Press, 1996.
PEROTTO, D.; ABRAHÃO, J. J. S.; MOLETTA J. L. Quantitative carcass traits of Zebu and crossbred Bos taurus
x Zebu. Brazilian Journal of Animal Science, v. 29, n. 6, p. 2019-2029, 2000.
PRADO, I. N.; PRADO, R. M.; ROTTA, P. P.; VISENTAINER, J. V.; MOLETTA, J. L.; PEROTTO, D. Carcass characteristics and chemical composition of the
Longissimus muscle of crossbred bulls (Bos Taurus indicus vs
Bos Taurus taurus) finished in feedlot. Journal of Animal and Feed Science, v. 17, p. 295-306, 2008a.
PRADO, I. N.; ROTTA, P. P.; PRADO, R. M.; VISENTAINER, J. V.; MOLETTA, J. L.; PEROTTO, D. Carcass characteristics and chemical composition of the
Longissimus muscle of Puruna and ½ Puruna vs. ½
Canchin bulls. Asian Australasian Journal of Animal Science, v. 21, n. 9, p. 1296-1302, 2008b.
PRADO, I. N.; ARICETTI, J. A.; ROTTA, P. P.; PRADO, R. M.; PEROTTO, D.; VISENTAINER, J. V.; MATSUSHITA, M. Carcass characteristics, chemical composition and fatty acid profile of the Longissimus
muscle of bulls (Bos taurus indicus vs. Bos taurus taurus) finished in pasture systems. Asian Australasian Journal of Animal Science, v. 21, n. 10, p.1449-1457, 2008c. PRADO, I. N.; ITO, R. H.; PRADO, J. M.; PRADO, I. M.; ROTTA, P. P.; MATSUSHITA, M.; VISENTAINER, J. V.; SILVA, R. R. The influence of dietary soybean and linseed on the chemical composition and fatty acid profile of the Longissimus muscle of feedlot-finished bulls. Journal of Animal and Feed Science, v. 17, p. 307-317, 2008d.
PRADO, I. N.; OLIVEIRA, A. N.; ROTTA, P. P.; PEROTTO, D.; PRADO, R. M.; SILVA, R. R.; SOUZA, N. E.; MOLETTA, J. L. Chemical and fatty acid composition of Longissimus muscle of crossbred bulls finished in feedlot. Asian Australasian Journal of Animal Science, v. 22, n. 7, p. 1054-1059, 2009a.
PRADO, J. M.; PRADO, I. N.; VISENTAINER, J. V.; ROTTA, P. P.; PEROTTO, D.; MOLETTA, J. L.; PRADO, I. M.; DUCATTI, T. The effect of breed on chemical composition and fatty acid composition on
Longissimus dorsi muscle of Brazilian beef cattle. Journal of Animal Feed Science, v. 18, p. 231-240, 2009b. PRADO, R. M.; PRADO, I. N.; MARQUES, J. A.; ROTTA, P. P.; VISENTAINER, J. V.; SILVA, R. R.; SOUZA, N. E. Meat quality of the Longissimus muscle of bulls and steers (½ Nellore vs ½ Simenthal) finished in feedlot. Journal of Animal and Feed Science, v. 18, p. 221-230, 2009c.
ROTTA, P. P.; PRADO, I. N.; PRADO, R. M.; MOLETTA, J. L.; SILVA, R. R.; PEROTTO, D. Carcass characteristics and chemical composition of the
Longissimus muscle of Nellore, Caracu and Holstein-friesian bulls finished in a feedlot. Asian Australasian Journal of Animal Science, v. 22, n. 4, p. 598-604, 2009a.
ROTTA, P. P.; PRADO, R. M.; PRADO, I. N.; VALELRO, M. V.; VISENTAINER, J. V.; SILVA, R. R. The effects of genetic groups, nutrition, finishing systems and gender of Brazilian cattle on carcass characteristics and beef composition and appearance: a review. Asian Australasian Journal of Animal Science, v. 22, n. 12, p. 1718-1734, 2009b.
ROWE, A.; MACEDO, F. A. F.; VISENTAINER, J. V.; SOUZA, N. E.; MATSUSHITA, M. Muscle composition and fatty acid profile in lambs fattened in dry-lot or pasture. Meat Science, v. 51, n. 4, 283-288, 1999.
SAS-Statistical Analysis System. User’s guide: statistics, version 8.1. 4th ed. Cary: SAS Institute, 2000. v. 2.
TAMMINGA, S.; DOREAU, M. Lipids and rumen digestion. In: JOUANY, J. P. (Ed.). Rumen microbial metabolism and ruminant digestion. Paris: INRA, 1991. p. 151-164.
WEBB, E. C. Manipulating beef quality through feeding. South African Journal of Food Science and Nutrition, v. 7, n. 1, p. 1-24, 2006.
WOOD, J. D.; RICHARDSON, R. I.; NUTE, G. R.; FISHER, A. V.; CAMPO, M. M.; KASAPIDOU, E.;
SHEARD, P. R.; ENSER, M. Effects of fatty acids on meat quality: a review. Meat Science, v. 66, n. 1, p. 21-32, 2003.
Received on September 8, 2011. Accepted on October 3, 2011.