Artigo
*e-mail: [email protected]
A RELIABLE METHOD OF QUANTIFICATION OF TRACE COPPER IN BEVERAGES WITH AND WITHOUT ALCOHOL BY SPECTROPHOTOMETRY AFTER CLOUD POINT EXTRACTION
Ramazan Gürkan* and Nail Altunay
University of Cumhuriyet, Faculty of Science, Department of Chemistry, TR-58140, Sivas, Turkey
Recebido em 8/1/13; aceito em 4/4/13; publicado na web em 13/6/13
A new cloud point extraction (CPE) method was developed for the separation and preconcentration of copper (II) prior to spectrophotometric analysis. For this purpose, 1-(2,4-dimethylphenyl) azonapthalen-2-ol (Sudan II) was used as a chelating agent and the solution pH was adjusted to 10.0 with borate buffer. Polyethylene glycol tert-octylphenyl ether (Triton X-114) was used as an extracting agent in the presence of sodium dodecylsulphate (SDS). After phase separation, based on the cloud point of the mixture, the surfactant-rich phase was diluted with acetone, and the enriched analyte was spectrophotometrically determined at 537 nm. The variables affecting CPE efficiency were optimized. The calibration curve was linear within the range 0.285-20 µg L−1 with a detection limit of 0.085 µg L−1. The method was successfully applied to the quantification of copper in different beverage samples.
Keywords: copper; beverage samples; cloud point extraction.
INTRODUCTION
Copper (II) is one of the most important heavy metals, and a microelement in mammalian nutrition. In general, a daily copper intake of 1.5-2.0 mg is essential. However, copper becomes toxic to humans if a large amount is ingested and accumulated in the tissue. For example, because of its mobilization and redox activity, cata-lytic copper is believed to play an important role in the formation of reactive oxygen species (ROS), such as superoxide anion (O2
−) and
OH radicals. These radicals bind very quickly to DNA and create damage by breaking the DNA strands or modifying the bases and/ or deoxyribose, leading to carcinogenesis.1 Overexposure to copper
causes ptyalism, nausea, vomiting, epigastric burning, and diarrhea. High doses of copper result in a series of systematic toxic effects such as hemolysis, hepatic neurosis, gastrointestinal bleeding, oliguria azotemia, hemoglobinuria, hematuria, proteinuria, hypertension, tachycardia, convulsions, and coma.2 Therefore, the trace amount of
copper present in water must be controlled on a daily basis. In view of this, the separation and determination of copper from associated elements is essential. Moreover, the determination of copper levels both in serum and urine samples is of great importance in the early diagnosis of certain diseases.3
The concentration of copper ions can be analyzed using many techniques. Among them, flame atomic absorption spectrometry (FAAS) is a convenient technique and is available in most laborato-ries. FAAS has a number of advantages over other methods, includ-ing a higher tolerance to interferences and greater instrumentation simplicity. However, direct determination of copper in liquid foods or biological samples by FAAS is difficult due to its low sensitivity.4
In many instances, the technique demands pre-concentration prior to analysis.5,6
From a practical point of view, to be applied to the in situ analysis of aqueous samples such as liquid foods and beverages, a method must be rapid, simple, and should not require complicated pretreatments. In the case of copper, a limit of detection of at least 0.5 mg L−1 is required.7 The methods of inductively coupled plasma
atomic emission spectrometry (ICP-AES)8,9 or inductively coupled
plasma mass spectrometry (ICP-MS)10 provide sufficient detection
limits (approximately 6 µg L−1 for ICP-AES, 1.0 µg L−1 for ICP-MS).
However, these methods require expensive instrumentation, and are therefore not suitable for the analysis of a large number of samples. Other methods including electrothermal/graphite furnace atomic ab-sorption spectroscopy (ETV-AAS or GFAAS),11 X-ray fluorescence,12
differential pulse anodic (or cathodic) stripping voltammetry,13
elec-trothermal atomic absorption spectrometry (ETAAS),14 flame atomic
absorption spectrometry (FAAS)15-17 and evanescent wave absorption
spectroscopy18 have also been developed to measure copper content,
but neither the instruments nor the techniques tend to be familiar for routine analysis.
Among these sensitive methods, spectrophotometry in UV-visible region is a tool that is most widely used in developing countries due to its low cost, easy operation, high accuracy and precision, and good selectivity particularly when a selective chromogenic chelating agent for analyte is used. However, the direct determination of Cu by spectrophotometry can be problematic since its sensitivity is not sufficient for samples with low abundance levels of Cu. For this reason, an extraction and enrichment step is often required before spectrophotometric determination of the analyte.
Sample preparation is one of the most important and crucial steps in a complete analytical process. Until now, several sample preparation methods have been developed for the determination of trace Cu from various sample matrices, including liquid-liquid extrac-tion (LLE),19 solid-phase extraction (SPE),20 cloud point extraction
(CPE),21,22 membrane filtration,23 and ion exchange.24
Recently, the CPE using non-ionic surfactants has attracted considerable attention as an alternative to the conventional extrac-tion techniques for separaextrac-tion and preconcentraextrac-tion.25-27 Briefly,
to concentrate a wide variety of analytes with high recoveries and high concentration factors.28
When the CPE technique has been used for the extraction of metal chelates, spectrophotometry has often been used as the analytical technique.29-32 Though spectrophotometry has poor sensitivity, it is a
very simple, rapid, and low-cost analytical tool, which can be found in almost every analytical research laboratory. CPE is also a very simple, rapid, and environmentally friendly separation and precon-centration procedure with a high enrichment factor. A combination of CPE with spectrophotometry leads to a very simple, rapid and low-cost analytical method with adequate sensitivity and selectivity.
In this context, the main aim of the current study was to evaluate the feasibility of combining CPE preconcentration with spectrophotometry at 537 nm for the quantification of trace copper(II) in beverage samples. In this procedure, Sudan II was used as the chelating agent and Triton X-114 as the extracting agent in the presence of SDS at pH 10. The chemical variables affecting CPE were investigated in detail. The me-thod developed was successfully applied to the determination of trace copper in a number of alcoholic and nonalcoholic beverage samples. EXPERIMENTAL
Instrumentation
Absorbance measurements at the selected wavelengths, 537 and 490 nm, were performed on a double-beam UV-Visible Spectrophotometer (Shimadzu UV-1800 PC, Kyoto, Japan) equipped with the 1.0-cm quartz cells. The pH measurements were per-formed using a pH meter (Sartorious Docu-pH-meter). A centrifuge (Universal 320 model, Hettich) was used to accelerate the phase-separation process. A thermostatic water bath (MF120, Nuve) was used to maintain the temperature in the CPE experiments. A program-mable ultrasonic water bath at 35 kHz, Model No.SC121TH (Sonicor, Deep Park, NY, USA) as well as a hot plate and membrane filter (25 mm in diameter, porosity 0.45 µm, Dura Pore TM, Millipore) used to preheat and filter through samples prior to analysis, was used to remove the dissolved gases from beer samples.
Reagents and solutions
A stock standard copper (II) solution (1000 mg L−1) was
prepared by dissolving appropriate amounts of copper nitrate (Cu(NO3)2×3H2O) (Merck, Darmstadt, Germany) in bidistilled
wa-ter. Working standard solutions were obtained by stepwise dilution of the stock standard solution just prior to use. A 2.0×10⁻³ mol L−1
solution of Sudan II (Sigma, St. Louis, MO, USA) was prepared by dissolving a suitable amount of solid reagent in 5.0 mL ethanol (Merck, Darmstadt, Germany) and diluting to 100 mL with water. The solution was kept in a refrigerator (4 oC) when not in use. Solutions
(1.0×10⁻³ mol L−1) of cetylpyridinium chloride (CPC),
cetyltrimethyl-ammonium bromide (CTAB), and SDS (Sigma, St. Louis, MO, USA) were prepared by dissolving a suitable amount of each surfactant in 100 mL of water. Solutions (5.0%, volume for volume [v/v]) of Triton X-114, polyoxyethylene p-t-octylphenol (Triton X-100), and polyethyleneglycolmono-p-nonylphenylether (Ponpe 7.5) (Sigma, St. Louis, MO, USA) were prepared in water and were used without further purification. 2-Octanol (Sigma, St. Louis, MO, USA), was used to prevent the foaming often encountered in the analysis of beer samples. A 0.05-mol L−1 borate buffer solution (pH 10) was prepared
by mixing 59.0 mL of 0.05 mol L−1 sodium tetraborate solutions with
41.0 mL of 0.1 mol L−1 NaOH solution in 100-mL volumetric flask.
All other chemicals and reagents used in this study, such as H2O2 and
HNO3, were of analytical-reagent grade or higher purity.
Samples and sample preparation
All beverage samples selected for analysis were supplied from local markets in Sivas, Turkey. Initially, all of the glassware and other mineralization containers used were acid-washed to avoid contamina-tion. A 0.1% (v/v) 2-octanol solution was added to the beer sample to prevent foaming and the beer samples were degassed for 15 min using an ultrasonic bath. Wine samples were de-alcoholized at 80 °C using a reduced pressure evaporator until its total volume was approximately a quarter of its initial volume (100 mL). The nonalcoholic beverages were filtered using a membrane filter (0.45-µm pore size) to remove suspended solids before analysis.
The applicability of the method was demonstrated by the analysis of beverage samples and two certified reference materials (CRMs). The samples were dissolved according to the methods described in previous studies.33
A suitable volume (20-30 mL) of a sample was accurately pi-petted into a 50-mL acid-cleaned polytetrafluoroethylene (PTFE) beaker and a minimal volume of 0.05-mol L−1 nitric acid was added
to the sample, followed by 2.0 mL of concentrated HNO3. The
beaker was covered with a PTFE cover and heated on a hot plate at 120 °C for 3 h. After cooling to room temperature, the interior surface of the cover was washed with 1.0 mL of concentrated HNO3
into the beaker and 2.0 mL of 35% (w/w) H2O2 (Merck, Darmstadt,
Germany) was added dropwise. The beaker was heated at 100 °C for 30 min, and then temperature was gradually raised to 130 °C and maintained at this temperature until complete decomposition of sample was achieved. If this was not completed, a further 1.5 mL of concentrated HNO3 and 1.0 mL H2O2 were added and the above
procedure was repeated to dissolve the residue.
After complete decomposition of the sample, 0.05-mol L−1 HNO 3
with a sufficient volume and 1.0-mL H2O2 were added and heated
at 100 °C gently until the solution was clear. The resulting solu-tion (nearly 2.5 mL) was then transferred into 10-, 20-, and 50-mL calibrated flasks by washing the interior surface of the beaker with 0.05-mol L−1 nitric acid three times and diluting with water (diluting
at ratios of 1:5, 1:10, and 1:25 according to sample type). In order to control a systematic error originating from analyte-matrix interac-tions, standard Cu solutions at levels ranging from of 5 to 15 µg L−1
were also spiked into the digested and diluted beverage samples. Then, the accuracy of results was verified by evaluating whether or not the percentage recoveries are quantitative. The above-mentioned two wet digestion procedures for 3-5 mL of the diluted samples were repeated five times in order to dissolve the samples and were subjected to CPE prior to spectrophotometric detection.
A blank analysis was also carried out using the above decomposi-tion procedures to correct for any analyte contaminants in the reagents used for sample preparation.
A portion (0.5 g) of CRMs, SRM 1570a spinach leaves and SRM 1573a tomato leaves was charged into a 100-mL PTFE bea-ker. The samples were dissolved in a similar way. For dissolution, a minimal volume of 0.05 mol L−1 nitric acid was added to moisten
the sample thoroughly, followed by 3.0 mL of concentrated HNO3.
The beaker was heated on a hot plate at approximately 130 oC for
3 h. After cooling to room temperature, 2.0 mL of concentrated H2O2 was added dropwise. The beaker was heated until complete
decomposition of sample. The resulting solution was transferred into a 50-mL volumetric flask by washing the interior of the beaker with small portions of 0.05-mol L−1 HNO
3, and the solution was
diluted to the mark with 0.05 mol L−1 HNO
3. For the purposes of
comparison, the same digestion procedure was also conducted for all beverage samples including CRMs using HClO4 instead of H2O2
Procedure for CPE
Suitable aliquots of sample or standard Cu(II) solution, 0.8 mL of 2.0×10⁻³ mol L−1 Sudan II solution, 0.1 mL of 1.0×10⁻³ mol L−1 SDS,
and 0.4 mL of 5.0 % (v/v) Triton X-114 solution were added into a 50-mL calibrated centrifuge tube, and the mixture was buffered to pH 10 with 0.9 mL of 0.05 mol L−1 borate buffer, and then diluted to 50
mL with water. The resultant solution was kept in a thermostatic water bath at 55 °C for 10 min; separation of the aqueous and surfactant-rich phase was accomplished by centrifugation for 10 min at 5142.7 g. After cooling in an ice bath, the surfactant-rich phase became viscous and the supernatant aqueous phase was then separated completely using a syringe centered in the tube. To decrease the viscosity of the surfactant-rich phase, the surfactant-rich phase was diluted to 1.0 mL with acetone, and then the absorbance of the resultant solution was measured by spectrophotometer at 537 nm against reagent blank for determination of copper. Finally, the copper contents of the beverage samples were determined using the calibration curve and standard addition calibration curve procedure when necessary.
RESULTS AND DISCUSSION
Sudan II, as can be seen from Figure 1, is a hydroxy-azo dye containing azo –N=N- and phenolic –OH groups as functional groups. It displays tautomeric behavior, which is known as azo-hydrazone tautomerism, in various media by the intramolecular proton transfer between nitrogen and oxygen atoms.34 The presence of azo-hydrazone
tautomerism in Sudan II has a considerable influence on its unique photo-physical properties, which is in turn strongly influenced by several factors including temperature, structure of substituents, and solvent polarity.34 Sudan II is a weak acid. However, the azo group
in the 1-position, which acts as a proton acceptor, leads to formation of an intramolecular hydrogen bond with the phenolic –OH group. This additional stabilization of the neutral Sudan II molecule is responsible for a rather high pKa value of 11.65.
35 It is explained in
another study that Sudan dyes also possess two reducible groups: a nitrogen-nitrogen double bond and a phenol group. The latter is transformed into a phenate ion at a sufficiently high pH and becomes reducible and, thus, could be oxidized by Ag+ ions. In the relevant
study, a visual light scattering detection method based on the forma-tion of silver nanoparticles (NPs) at 452 nm was proposed for the monitoring of Sudan dyes in food products after deoxidization of Ag+ ions to brown silver NPs.36 A similar reduction process, which
corresponds to a spontaneous auto-reduction of the Cu2+ into Cu+,
was also observed in the cases of complexation of Cu2+ ions with
the 6,6-dimethyl-2,2-bipyridine,37 β-ketoimine calyx[4]arene,38
and Sudan I.39 In a later study, it is implied that the Cu(I)-Sudan I
complex formed after prereduction of copper (II) in alkaline media at 50 oC is a positively charged metal-ligand complex with a 1:1
stoichiometric ratio by means of cyclic voltammetric, UV-visible and IR spectrophotometric studies. Because of these features of Sudan dyes, Sudan II is considered as a chromogenic chelating and redox sensitive agent in spectrophotometric detection of copper after
preconcentration with CPE. Our preliminary CPE tests have also revealed that it forms a stable ternary complex of sufficient hydropho-bicity to be quantitatively extracted into a small volume of a Triton X-114 surfactant-rich phase in the presence of SDS as a sensitivity enhancement surfactant, thus reaching the desired preconcentration level. Thus, we decided to optimize the experimental conditions for the selective spectrophotometric determination of copper (II) at 537 nm after preconcentration with CPE using the Sudan II-SDS-Triton X-114 micellar system.
Optimization study
In order to apply the CPE procedure developed to the quantifi-cation of trace copper from different beverage matrices, with and without alcohol, the analytical variables affecting CPE efficiency have been optimized.
Effect of pH
Sudan II is a weak acidic reagent (pKa: 11.65) and its dissociation
equilibrium depends on the pKa value as well as the pH of the
solu-tion. Hence, its complex formation and extraction behavior is also pH dependent. The effect of pH on the signal intensity of copper (II) in the surfactant-rich phase was evaluated at pH values varying from 5.0 to 11.0. The variation of pH was initially achieved using Britton-Robinson buffer solutions (0.04 mol L−1) of different pH values. As
can be seen from Figure 2, the quantitative maximum extraction of copper (II) was achieved at a pH of 10.0. At lower and higher pH values, the hydrophobic complex of Cu(II)-Sudan II does not form completely, so the extraction efficiency of copper(II) is low. Hence, pH 10.0 was selected as the optimal working value for further studies.
In order to determine the best buffer solution at pH 10.0, several buffer systems, including HCO3
−/CO
3
2, NH
3/NH4Cl, and sodium
te-traborate/NaOH at isomolar concentrations of 0.05 mol L−1 as well as
B-R buffer were studied. The best analytical sensitivity was obtained in the presence of borate buffer. Next, the effect of buffer volume on analytical sensitivity was studied in the range 0.3-3.0 mL, and the maximum absorbance was obtained at a buffer volume of 0.9 mL. The results are shown in Figure 3. In buffer volumes lower and higher Figure 1. The chemical structure of Sudan II
Figure 2. Effect of pH on the signal intensity in surfactant-rich phase. Condi-tions: Cu(II), 10 µg L-1; 1.0 mL of 2.0×10⁻³ mol L-1 Sudan II solution; 0.125
mL of 1.0×10⁻³ mol L-1 SDS, 0.5 mL of 5.0 % (v/v) Triton X-114; equilibrium
temperature, 55 oC and incubation time, 10 min. The error bars indicate
than 0.9 mL, the absorbance sharply decreased. The sharp reduction in absorbance in higher buffer volumes may reversibly be due to the gradual dissociation of a hydrophobic ternary complex formed in the presence of SDS with increasing ionic strength, whereas at lower buffer volumes a stable complex with sufficient hydrophobicity to be extracted into a small volume of a surfactant-rich phase cannot be obtained at pH 10.0. Therefore, it was decided to use a borate buffer volume of 0.9 mL for further studies.
Effect of Sudan II concentration
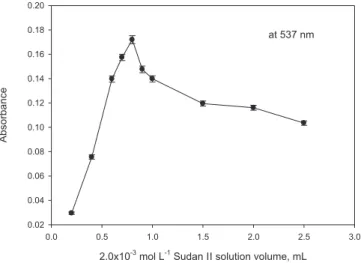
The CPE efficiency depends on the hydrophobicity of the ligand and the complex formation, the apparent equilibrium constants in the micelle medium, the kinetics of the complex formation, and the mass transfer between the phases. The variation of the analytical signal as a function of ligand volume of 2.0×10⁻³ mol L−1 in the range 0.2-2.5 mL
was studied, and the results are represented in Figure 4. It can be seen that the analytical signal of copper (II) reaches to a maximum and then gradually decreases with increasing reagent volume when the ligand volume is 0.9 mL. The reduction in extraction efficiency with greater amounts of chelating agent may be due to the extraction of the ligand itself, which can easily saturate the small volume of extraction solvent. Another reason may be the aggregation of dye molecules depending on their increasing concentration by means of dipole-dipole interactions and formation of intermolecular hydrogen bonding. Hence, a ligand volume of 0.9 mL was chosen as the optimal value for further studies. Effect of nonionic and ionic surfactant concentration
Surfactants have been used efficiently to extract metal-ligand complexes without using organic solvents.40 Hence, an attempt was
made to extract the metal-chelate complex from the aqueous solution using two types of surfactants. These surfactants are known to form aggregates, which are called micelles, and these entrap the complexes very efficiently to cause phase separation. Several surfactants have been tried to separate the metal-ligand complex from the aqueous phase. After adding the surfactant, the solutions were heated to dif-ferent temperatures to cause cloud-point formation. Once clouding takes place, the phase separation can efficiently be carried out using
a simple centrifugation procedure. Triton X-100, Triton X-114, and Ponpe 7.5 were used preferentially for the efficient phase separation. From the three surfactants used, only Triton X-114 could cause the best quantitative extraction with maximum absorbance after heating to 55 °C. Since the complex is ionic in nature, only in the presence of ionic surfactants as counter ions may the use of nonionic surfactants, Triton X-114, Ponpe 7.5, and Triton X-100 significantly facilitate the quantitative extraction of the metal chelate complex.
Among the nonionic surfactants used, Triton X-114 gave a higher absorbance value to the sample when compared with other surfactants; hence, Triton X-114 was preferred as an extracting solvent in all fur-ther studies. The effect of Triton X-114 concentration on the extraction of the complex was investigated by varying its concentration by the addition of 0.05-1.5 mL of 5.0% (v/v) solution. As can be seen from Figure 5, extraction of the complex increased with concentration up to 0.4 mL for Triton X-114 (0.3 and 0.4 mL for Triton X-100 and Ponpe 7.5, respectively); thereafter sample absorbance values Figure 4. Effect of Sudan II concentration on the signal intensity in surfactant-rich phase. Conditions: 0.9 mL of 0.05 mol L-1 borate buffer, pH 10.0; Cu(II),
10 µg L-1; 0.125 mL of 1.0×10⁻³ mol L-1 SDS, 0.5 mL of 5.0 % (v/v) Triton
X-114; equilibrium temperature, 55 oC and incubation time, 10 min. The error
bars indicate standard deviations of three replicate measurements
Figure 5. Effect of nonionic surfactant volume on the extraction of ion-asso-ciate complex with CPE. Conditions: 0.9 mL of 0.05 mol L-1 borate buffer, pH
10.0; Cu(II), 10 µg L-1; 0.8 mL of 2.0×10⁻³ mol L-1 Sudan II; 0.1 mL of 1.0×10⁻³
mol L-1 SDS; equilibrium temperature, 55 oC and incubation time, 10 min.
The error bars indicate standard deviations of three replicate measurements Figure 3. Effect of buffer volume on the signal intensity in surfactant-rich
phase. Conditions: 0.05 mol L-1 borate buffer, pH 10.0; Cu(II), 10 µg L-1;
1.0 mL of 2.0×10⁻³ mol L-1 Sudan II solution; 0.125 mL of 1.0×10⁻³ mol L-1
SDS, 0.5 mL of 5.0 % (v/v) Triton X-114; equilibrium temperature, 55 oC and
gradually decreased (Figure 5). At concentrations higher than 0.4 mL of 5.0% (v/v), the analytical signal decreased, probably due to the increase of the surfactant volume, which deteriorates the analytical signal. At concentrations below this value, the extraction efficiency of the complex was low because there are few surfactant molecules to entrap quantitatively the positively charged copper complex in the presence of SDS behaving as an auxiliary ligand. Hence, 0.4 mL of 5.0% (v/v) Triton X-114 has been fixed as the optimum value where the sample absorbance was high with low analyte blank.
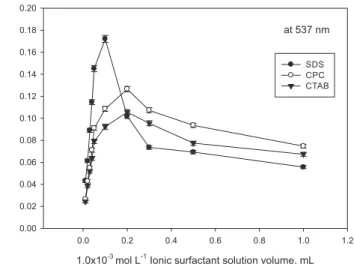
Ionic surfactants such as CPC, CTAB, and SDS were used to extract quantitatively the charged copper complex from the aqueous phase and to improve the analytical sensitivity in the presence of Triton X-114. In presence of ionic surfactants, absorbance initially decreased with increasing slope in the range 0.01-0.1 (or 0.2) mL of 1.0×10⁻³ mol L−1
,
giving a maximum signal, while in larger volumes than 0.1 or 0.2 mL absorbance decreased with a constant slope (Figure 6). However, the best absorbance signal was obtained for SDS with 0.1 mL of 1.0×10⁻³
mol L−1. The reason for this increase in absorbance may be the
elec-trostatic interactions between the positively charged Cu-ligand complex and negatively charged SDS molecules to give a ternary complex with hydrophobic character. Hence, 0.1 mL of 1.0×10⁻³ mol L−1 SDS as a
sensitivity enhancement surfactant was selected for further studies.
Effect of ionic strength
In order to investigate the effect of ionic strength on CPE per-formance, various experiments were performed by adding different amounts of NaCl (0.005-0.05 mol L−1). Other experimental conditions
were kept constant during the analysis. The results showed that ionic strength has no significant effect on the enrichment factor up to a concentration of 0.01 mol L−1. Thus, ionic strength was kept constant
at a salt concentration of 0.01 mol L−1 in order to obtain precise and
stable analytical signals.
Effect of equilibrium temperature and time
It is desirable to have the shortest incubation time and the lowest possible equilibration temperature, which compromise completion of the reaction and efficient separation of the phases. The effect of equi-librium temperature was investigated in temperature range 20-70 °C.
It was found that the solutions became turbid as soon as the solutions were put into the water bath with a temperature higher than 50 °C, and the temperature had no notable effect upon the extraction efficiency and the analytical signal remained constant within the temperature range 50-55 °C. In higher temperatures than 55 °C, the extraction efficiency gradually and significantly decreased. Thus, 55 °C was selected as the equilibrium temperature. Maintaining the equilibrium temperature of 55 °C, the influence of incubation time on CPE was studied within the range 5-30 min. It was observed that, 10 min was sufficient to achieve a quantitative extraction of the analyte. Thus, an incubation time of 10 min was employed for the CPE procedure.
The effect of centrifugation time upon extraction efficiency at 5142.7 g was studied for time interval 5-30 min. A centrifugation time of 10 min was selected for the entire procedure, since the analyte extraction during this time is almost quantitative. The results obtained were chosen as optimal because they yielded the greatest precision. Effect of diluent agent type
Different solvents such as acetone, THF, acetonitrile, methanol, ethanol, and acidic solutions of ethanol and methanol were tried to select the one that could completely dissolve the surfactant-rich phase and the extracted materials (complex of copper and excess of ligand) and give the best analytical sensitivity and correlation coefficient for calibration curves constructed between absorbance and copper con-centrations of 0.03, 0.05, and 0.1 mL of 10 mg L−1 with a wavelength
shift of 8 nm. As the best results were obtained with acetone, this was chosen as the diluent for further experiments (Figure 7).
Analytical performance
Under the optimized conditions, a calibration graph was con-structed for copper by preconcentrating eight standard solutions Figure 6. Effect of ionic surfactant volume on the extraction of ion-associate
complex with CPE. Conditions: 0.9 mL of 0.05 mol L-1 borate buffer, pH 10.0;
Cu(II), 10 µg L-1; 0.8 mL of 2.0×10⁻³ mol L-1 Sudan II; 0.5 mL of 5.0 % (v/v)
Triton X-114; equilibrium temperature, 55 oC and incubation time, 10 min.
The error bars indicate standard deviations of three replicate measurements
Figure 7. Effect of diluent agent on the signal intensity in surfactant-rich phase. Conditions: 0.9 mL of 0.05 mol L-1 borate buffer, pH 10.0; Cu(II), 10
µg L-1; 0.8 mL of 2.0×10⁻³ mol L-1 Sudan II; 0.1 mL of 1.0×10⁻³ mol L-1 SDS;
0.5 mL of 5.0 % (v/v) Triton X-114; equilibrium temperature, 55 oC and
according to the given procedure. The linear range was 0.285-20 µg L−1 with a correlation coefficient of 0.9968. The calibration function
was A=0.0046[Cu(II), µg L−1]+0.1257, where A is the absorbance.
The limits of detection and quantification defined as 3Sb/m and
10Sb/m (where Sb is the standard deviation of twelve replicate
mea-surements of the blank and m is the slope of the calibration curve) were found to be 0.085 and 0.285 µg L−1, respectively. The precision
for six replicate measurements at 0.5, 2.0, and 14 µg L−1 of copper
with preconcentration was in the range 2.25-3.21% relative standard deviation. Other parameters related to the preconcentration systems were also calculated and are shown in Table 1.
The preconcentration factor was found to average 30 by cal-culating the ratio of the initial solution volume to the volume of surfactant-rich phase in the linear range 0.285-20 µg L−1.The
en-hancement factor measures the increase in the instrumental signal provided by the preconcentration method. One of the most reliable ways to calculate this parameter is to calculate the ratio between the slopes of the calibration curves for the procedure with and without preconcentration. Thus, obtained in this way, the improvement factor was 23 in the CPE procedure developed.
Selectivity study
The effect of potential interference of some metal ions on the preconcentration and determination of copper (II) was examined. In these experiments, solutions containing copper (II) (10 µg L−1) with
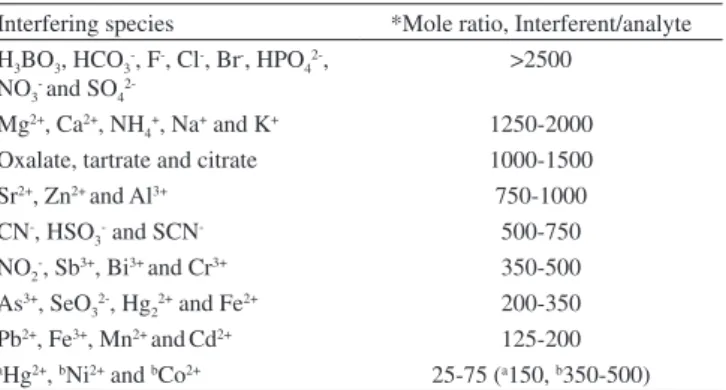
the addition of interfering ions were treated according to the recom-mended CPE procedure under the optimized reagent conditions, and the results are given in Table 2. Table 2 depicts the tolerance limits of the diverse ions, i.e. interferent-to-analyte ratios in which the relative error was less than ±5.0% in terms of signal variation. Only a serious interference has been observed from Hg2+, Ni2+, and Co2+ ions
form-ing a stable complex with the ligand. The interferform-ing effect of Hg2+
ions up to150-fold excess over copper was completely negated in the presence of 0.2 mL of 0.05 mol L−1 Na
2S2O3. The interference of
Ni(II) and Co(II) ions can be overcome up to 350-500 fold by adding 0.2 mL of 0.05 mol L−1 Na
2H2P2O7 or 0.2 mL of 0.01 mol L −1 citric
acid as masking agents. As can be seen from Table 2, it is clear that the developed method is relatively selective in terms of major species present in real samples.
Analytical applications of the developed method
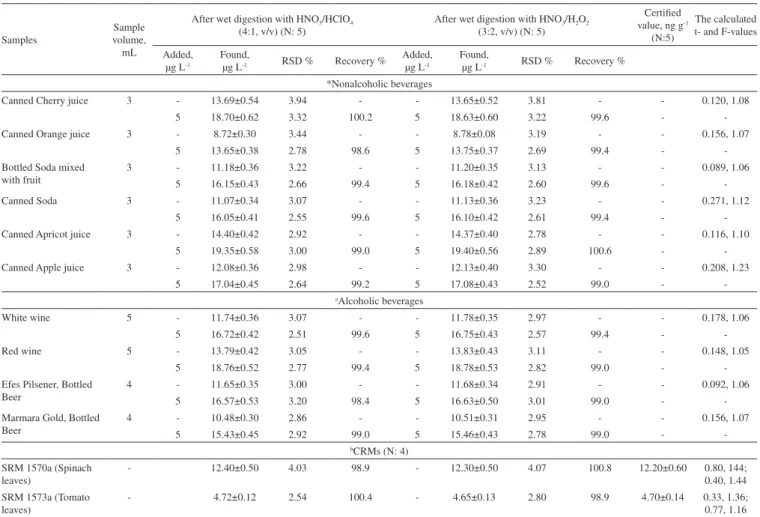
For the analysis of beverage samples and CRMs, a standard calibration curve was employed. In order to establish the accuracy and precision of the proposed procedure, the method was initially applied to the determination of trace levels of copper (II) in the CRMs, SRM 1570a spinach leaves and SRM 1573a tomato leaves. The analytical results showed good consistency between the measured values (12.40±0.50 and 4.70±0.12 ng g−1 after wet digestion with a
mixture of HNO3–HClO4 (4:1, v/v); 12.30±0.50 and 4.65±0.13 ng g −1
after wet digestion with a mixture of HNO3–H2O2 (3:2, v/v)) and the
certified values (12.20±0.60 and 4.70±0.14 ng g−1), respectively. The
tabulated Student’s t-values at a significance level of 0.05 were 3.18 for certified samples, and the experimental t-values were in the range 0.33-1.44, respectively. For both certified samples, the experimental values obtained are also smaller than the tabulated values, so it may be concluded that the values obtained are statistically equal to the certified values. The method was also applied to the determination of trace copper (II) in nonalcoholic and alcoholic beverage samples. The analytical results and the recoveries for the samples spiked at It can be seen that the recovery for the spiked samples is in range 98.4-100.4% with a relative standard deviation of 2.51-3.94% (N: 5) for wet diges-tion with a mixture of HNO3–HClO4 (4:1, v/v), whereas it is in range
99.0-100.6% with relative standard deviation of 2.52-3.81% (N:5) for wet digestion with a mixture of HNO3–H2O2 (3:2, v/v). As can
be seen from Table 3, the Student’s t-test for comparison of mean values demonstrated that there is no significant difference between the mean values obtained by the two digestion procedures at a sig-nificance level of 0.05.41 Because the experimental t-values ranging
from 0.092 to 0.271 are lower than the tabulated t-value of 2.31, it can be concluded that the mean values obtained by the two digestion procedures include a significant difference for 8 degrees of freedom at the 95% confidence level. It is clear that the proposed method for beverage samples has good reproducibility as a measure of precision by variance analysis based on a pooled standard deviation with an experimental F4,4-value ranging from 1.05 to 1.23.
A validation study was performed to demonstrate the suitability
Table 1. Analytical characteristics of the proposed spectrophotometric method with and without CPE
Parameters with Sudan II
with CPE at 537 nm without CPE at 490 nm
Linear range 0.2-20 µg L−1 10-200 µg L−1
Slope 4.6×10⁻³ 2.0×10⁻⁴
Intercept 0.1257 0.037
Correlation coefficient (R2)
0.9968 0.9988
Recovery % (n: 3) 98.5-102.5 98.7-103.5
Precision, RSD (%) (n: 5) 3.21, 2.79 and 2.25 (0.5, 2.0 and 14 µg L−1)
4.35, 3.75 and 2.65 (25,75 and 150 µg L−1) *Limit of detection, LOD
(µg L−1)
0.085 3.15
Limit of quantification, LOQ (µg L−1)
0.285 10.5
aPreconcentration factor 30
-bEnhancement factor 23
-*The limit of detection was also verified by the one sided student’s t-test based on ∆Xmin: tSblank/dA/dC equation with relative error of 3.71% at confidence level of 99% for twelve replicate measurements (at which the critical t-value, standard deviation of blank (Sblank) and slope of calibration curve (dA/dC) are 3.11, 1.31×10⁻⁴ and 4.6×10⁻³ respectively). aPreconcentration factor is defined as the ratio of the initial solution volume to the volume of surfactant rich phase. bEnhancement factor is calculated as the ratio of slope of preconcentrated samples to that obtained without preconcentration.
Table 2. Tolerance limits of interfering ions in spectrophotometric deter-mination of 10 µg L-1 Cu(II) ion after preconcentration with CPE under the optimized conditions
Interfering species *Mole ratio, Interferent/analyte H3BO3, HCO3
-, F-, Cl-, Br-, HPO 4
2-, NO3
- and SO 4
2->2500
Mg2+, Ca2+, NH 4
+, Na+ and K+ 1250-2000
Oxalate, tartrate and citrate 1000-1500
Sr2+, Zn2+ and Al3+ 750-1000
CN-, HSO 3
- and SCN- 500-750
NO2-, Sb3+, Bi3+ and Cr3+ 350-500 As3+, SeO32-, Hg22+ and Fe2+ 200-350 Pb2+, Fe3+, Mn2+ andCd2+ 125-200 aHg2+, bNi2+ and bCo2+ 25-75 (a150, b350-500)
of the analytical method for the intended purpose and therefore the reliability of the results. Linearity, limits of detection and quanti-fication, accuracy, inter-day and intra-day method precision, and instrumental precision for standards and samples were tested by employing two CRMs: SRM 1573a tomato leaves and SRM 1570a spinach leaves. The certified contents were 4.70±0.14 and 12.20±0.60 ng g−1for tomato and spinach leaves, respectively. It can be said that
the obtained values, 4.70±0.12 and 4.65±0.13 ng g−1 for HNO 3/HClO4
and 12.40±0.50 and 12.30±0.50 µg g−1 for HNO
3/H2O2, respectively,
using two wet digestion procedures are quantitatively consistent with the certified values. In addition, standard additions were performed at three concentration levels ranging from 5 to 15 µg L−1 for copper
in order to determine if there is a possible systematic error arising from beverage samples with a high alcohol content such as especially wine. Validation parameters are summarized in Table 4. It is clear that the analytical data obtained with twelve replicate measurements show a good performance of the method for the intended purpose in terms of accuracy and precision.
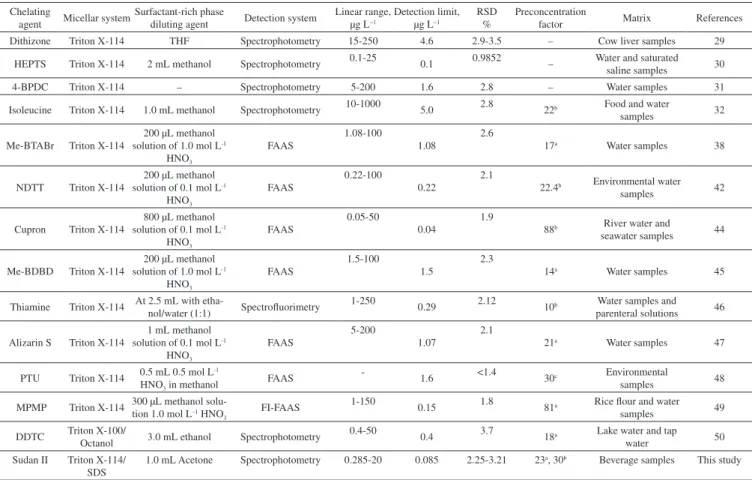
For comparative purposes, the performance characteristics of the proposed method and other selected preconcentration methods pre-viously reported in the literature are given in Table 5. As can be seen from Table 5, the detection limit and preconcentration or enrichment factor for the method are lower than those given by many methods reported in literature.29-32,42-49 except for those of the method developed Table 3. Determination of copper contents of some alcoholic and nonalcoholic beverages as well as CRMs, and recovery studies of spiked samples
Samples
Sample volume, mL
After wet digestion with HNO3/HClO4 (4:1, v/v) (N: 5)
After wet digestion with HNO3/H2O2 (3:2, v/v) (N: 5)
Certified value, ng g-1
(N:5)
The calculated t- and F-values
Added, µg L-1
Found,
µg L-1 RSD % Recovery %
Added, µg L-1
Found,
µg L-1 RSD % Recovery %
*Nonalcoholic beverages
Canned Cherry juice 3 - 13.69±0.54 3.94 - - 13.65±0.52 3.81 - - 0.120, 1.08
5 18.70±0.62 3.32 100.2 5 18.63±0.60 3.22 99.6 -
-Canned Orange juice 3 - 8.72±0.30 3.44 - - 8.78±0.08 3.19 - - 0.156, 1.07
5 13.65±0.38 2.78 98.6 5 13.75±0.37 2.69 99.4 -
-Bottled Soda mixed with fruit
3 - 11.18±0.36 3.22 - - 11.20±0.35 3.13 - - 0.089, 1.06
5 16.15±0.43 2.66 99.4 5 16.18±0.42 2.60 99.6 -
-Canned Soda 3 - 11.07±0.34 3.07 - - 11.13±0.36 3.23 - - 0.271, 1.12
5 16.05±0.41 2.55 99.6 5 16.10±0.42 2.61 99.4 -
-Canned Apricot juice 3 - 14.40±0.42 2.92 - - 14.37±0.40 2.78 - - 0.116, 1.10
5 19.35±0.58 3.00 99.0 5 19.40±0.56 2.89 100.6 -
-Canned Apple juice 3 - 12.08±0.36 2.98 - - 12.13±0.40 3.30 - - 0.208, 1.23
5 17.04±0.45 2.64 99.2 5 17.08±0.43 2.52 99.0 -
-aAlcoholic beverages
White wine 5 - 11.74±0.36 3.07 - - 11.78±0.35 2.97 - - 0.178, 1.06
5 16.72±0.42 2.51 99.6 5 16.75±0.43 2.57 99.4 -
-Red wine 5 - 13.79±0.42 3.05 - - 13.83±0.43 3.11 - - 0.148, 1.05
5 18.76±0.52 2.77 99.4 5 18.78±0.53 2.82 99.0 -
-Efes Pilsener, Bottled Beer
4 - 11.65±0.35 3.00 - - 11.68±0.34 2.91 - - 0.092, 1.06
5 16.57±0.53 3.20 98.4 5 16.63±0.50 3.01 99.0 -
-Marmara Gold, Bottled Beer
4 - 10.48±0.30 2.86 - - 10.51±0.31 2.95 - - 0.156, 1.07
5 15.43±0.45 2.92 99.0 5 15.46±0.43 2.78 99.0 -
-bCRMs (N: 4)
SRM 1570a (Spinach leaves)
- 12.40±0.50 4.03 98.9 - 12.30±0.50 4.07 100.8 12.20±0.60 0.80, 144;
0.40, 1.44
SRM 1573a (Tomato leaves)
- 4.72±0.12 2.54 100.4 - 4.65±0.13 2.80 98.9 4.70±0.14 0.33, 1.36;
0.77, 1.16 a In order to compare two mean values the statistical t- and F-critical values at 95% confidence level and 8 degrees of freedom are 2.31 and 6.39, respectively. b In order to compare the measured value with the certified values of CRMs the critical t- and F- values at 95% confidence level and degrees of freedom of 3 are 3.18 and 8.53, respectively.
Table 4. The main validation parameters for spectrophotometric copper measurement in beverages at 537 nm after preconcentration with CPE
Validation parameters
Standards linearity
Samples linearity
Standards accuracy
Samples ac-curacy
Method precision
Instrumental precision
Limit of detection
Limit of quantifi-cation Intra-assay
day 1
Intra-assay day 2
Intra-assay
day 3 Intermediate
a±L.C b±L.C r2
a±L.C b±L.C r2
Recovery % RSD %
Recovery % RSD %
Mean, µg L-1 RSD %
Mean, µg L-1 RSD %
Mean, µg L-1 RSD %
Mean, µg L-1 RSD %
Mean, µg L-1 RSD %
Concen-tration,
µg L-1
Concen-tration, µg L-1
After wet digestion with HNO3/H2O2
(3:2, v/v)
0.126±0.0013 0.833±0.0070 98.6±1.6 96.5±2.0 13.8±0.5 13.6±0.5 13.7±0.7 13.7±0.6 13.6±0.4 0.085 0.28
0.046±0.0018 0.053±0.0021 1.95 3.85 3.6 3.7 5.1 4.4 2.94 -
-0.9968 0.9972 - - -
-After wet digestion with HNO3/HClO4
(4:1, v/v)
0.124±0.0015 0.836±0.0078 97.6±2.3 96.4±2.5 13.7±0.5 13.6±0.6 13.5±0.8 13.6±0.7 13.5±0.5 0.1 0.33
0.045±0.0021 0.054±0.0025 2.10 3.95 3.65 4.41 5.92 5.18 3.70 -
-0.9968 0.9972 - - -
by Goudarzi.50 It is important to emphasize that 1.0-mL acetone
vo-lume containing a surfactant-rich phase was sufficient to obtain an enhancement factor of 23, and the whole preconcentration procedure was performed simply in a 50-mL centrifuge tube within 20 min. CONCLUSIONS
The results of this study indicate the usefulness of the proposed CPE/spectrophotometric method for the quantitative extraction of Cu present in different beverage samples. The proposed method allows Cu determination at 0.085 µg L−1 levels in a linear range 0.285-20 µg
L−1, thus representing a promising approach in the monitoring of Cu
in different beverage samples with low cost, simplicity, efficiency, versatility, and non-polluting respect. The proposed CPE method gives highly low limits of detection (LOD), high preconcentration/ enhancement factors, and good relative standard deviation (RSD) for extraction of the copper with mixed surfactant, Triton X-114 plus SDS from its initial matrix after pretreatment with two wet digestion procedures. Due to its versatility, the technique can also be applied to the monitoring of copper in various samples of environmental, toxicological, and medical analysis as well as beverage samples. The method can be considered as an alternative tool to sensitive but expensive, time-consuming, and expert-user-requiring analytical techniques such as spectrofluorimetry, FAAS, ICP-MS, ICP-AES, and GF-AAS.
ACKNOWLEDGEMENTS
The authors are grateful to the Cumhuriyet University Scientific Research Projects (CUBAP) Commission for partly supporting the present study. Authors wish also to acknowledge Professor M. Akçay for his expert discussions in the preparation of this manuscript. REFERENCES
1. Theophanides, T.; Anastassopoulou, J.; J. Crit. Rev. Oncol. Hematol.
2002, 42, 57.
2. Onianwa, P.C.; Adeyemo, A.O.; Idowu, O.E.; Ogabiela, E. E.; Food Chem. 2001, 72, 89.
3. Lopes, C. M. P. V.; Almeida, A.A.; Santos, J. L. M.; Lima, J. L. F. C.; Anal. Chim. Acta 2006, 555, 370.
4. Doner, G.; Ege, A.; Anal. Chim. Acta 2005, 547, 14.
5. Mendiguchıa, C.; Moreno, C.; Garcıa-Vargas, M.; Anal. Chim. Acta
2002, 460, 35.
6. Taher, M.A.; Mobarakeh, S.Z.M.; Mohadesi, A.R.; Turk. J. Chem. 2005, 29, 17.
7. Pinto, J.J.; Moreno, C.; García-Vargas, M.; Talanta 2004, 64, 562. 8. Allen, L.B.; Sitonen, P.H.; Thompson, Jr. H.C.; J. Agric. Food. Chem.
1997, 45, 162.
9. Rao, K.S.; Balaji, T.; Raoc, T.P.; Babud, Y.; Naidu, G.R.K.; Spectrochim. Acta B 2002, 57, 1333.
Table 5. Comparison of the presented CPE method with other reported preconcentration methods for determination of Cu at levels of µg L-1
Chelating
agent Micellar system
Surfactant-rich phase
diluting agent Detection system
Linear range, µg L−1
Detection limit, µg L−1
RSD %
Preconcentration
factor Matrix References
Dithizone Triton X-114 THF Spectrophotometry 15-250 4.6 2.9-3.5 – Cow liver samples 29
HEPTS Triton X-114 2 mL methanol Spectrophotometry 0.1-25 0.1 0.9852 – Water and saturated
saline samples 30
4-BPDC Triton X-114 – Spectrophotometry 5-200 1.6 2.8 – Water samples 31
Isoleucine Triton X-114 1.0 mL methanol Spectrophotometry 10-1000 5.0 2.8 22b Food and water
samples 32
Me-BTABr Triton X-114
200 µL methanol solution of 1.0 mol L-1
HNO3
FAAS
1.08-100
1.08
2.6
17a Water samples 38
NDTT Triton X-114
200 µL methanol solution of 0.1 mol L-1
HNO3
FAAS
0.22-100
0.22
2.1
22.4b Environmental water
samples 42
Cupron Triton X-114
800 µL methanol solution of 0.1 mol L-1
HNO3
FAAS
0.05-50
0.04
1.9
88b River water and
seawater samples 44
Me-BDBD Triton X-114
200 µL methanol solution of 1.0 mol L-1
HNO3
FAAS
1.5-100
1.5
2.3
14a Water samples 45
Thiamine Triton X-114 At 2.5 mL with
etha-nol/water (1:1) Spectrofluorimetry
1-250
0.29 2.12 10b Water samples and
parenteral solutions 46
Alizarin S Triton X-114
1 mL methanol solution of 0.1 mol L-1
HNO3
FAAS
5-200
1.07
2.1
21a Water samples 47
PTU Triton X-114 0.5 mL 0.5 mol L-1
HNO3 in methanol FAAS
-1.6 <1.4 30c Environmental
samples 48
MPMP Triton X-114 300 µL methanol
solu-tion 1.0 mol L–1 HNO 3
FI-FAAS 1-150 0.15 1.8 81a Rice flour and water
samples 49
DDTC Triton X-100/
Octanol 3.0 mL ethanol Spectrophotometry
0.4-50
0.4 3.7 18a Lake water and tap
water 50
Sudan II Triton X-114/
SDS
1.0 mL Acetone Spectrophotometry 0.285-20 0.085 2.25-3.21 23a, 30b Beverage samples This study
10. Becker, J.S.; Zoriy, M.; Pickhardt, C.; Damoc, E.; Juhacz, G.; Palkovits, M.; Przybylski, M.; Anal. Chem. 2005, 77, 5851.
11. Lin, T.W.; Huang, S.D.; Anal. Chem. 2001, 73, 4319.
12. Alvarez, J.; Marco, L.M.; Arroyo, J.; Greaves, E.D.; Rivas, R.; Spectro-chim. Acta B 2003, 58, 2183.
13. Celik, U.; Oehlenschláger, J.; Food Chem. 2004, 87, 343.
14. Garcīa, J.C.R.; Garcīa, J.B.; Latorre, C.H.; Martїn, S.G.; Crecente, R.M.P.; J. Agric. Food Chem. 2005, 53, 6616.
15. Fathi, S.A.M.; Yaftian, M.R.; J. Colloid Interf. Sci. 2009, 334, 167. 16. Es’haghi, Z.; Azmoodeh, R.; Arab. J. Chem. 2010, 3, 21. 17. Fathi, S.A.M.; Yaftian, M.R.; J. Hazard. Mater. 2009, 164, 133. 18. Huang, G.G.; Yang, J.; Anal. Chem. 2003, 75, 2262.
19. Diniz, M.C.T.; Filho, O.F.; Rohwedder, J.J.R.; Anal. Chim. Acta 2004, 525, 281.
20. Rezaei, B.; Sadeghi, E.; Meghdadi, S.; J. Hazard. Mater. 2009, 168, 787. 21. Manzoori, J.L.; Bavili-Tabrizi, A.; Microchem. J. 2002, 72, 1. 22. Shokrollahi, A.; Ghaedi, M.; Hossaini, O.; Khanjaria, N.; Soylak, M.; J.
Hazard. Mater. 2008, 160, 435.
23. Divrikli, U.; Kartal, A.A.; Soylak, M.; Elci, L.; J. Hazard. Mater. 2007, 145, 459.
24. Kunio, O.; Masea, M.; Fumihiko, Y.; Isoshi, N.; Ryoei, I.; Analyst 1990, 115, 23.
25. Tatara, E.; Materna, K.; Schaadt, A.; Bart, H.J.; Szymanowski, J.; Envi-ron. Sci. Technol. 2005, 39, 3110.
26. Bellato, A.C.S.; Gervasio, A.P.G.; Gine, M.F.; J. Anal. Atom. Spectrom.
2005, 20, 535.
27. Silva, E.L.; Roldan, P.S.; J. Hazard. Mater. 2009, 161, 142. 28. Stalikas, C.D.; Trac-Trend. Anal. Chem. 2002, 21, 343.
29. Manzoori, L.J.; Karim-Nezhat, G.; Iran J. Chem. Eng. 2005, 24, 47. 30. Hassanien, M.M.; Abdel-Rhman, M.H.; El-Asmy, A.A.; Chem.
Anal-Warsaw 2007, 52, 327.
32. Liang, P.; Yang, J.; J. Food Compos. Anal. 2010, 23, 95.
33. Prohaska, C.; Pomazal, K.; Steffan, I.; Fresen. J. Anal. Chem. 2000, 367, 479.
34. Gilani, A.G.; Moradi, E.; Binay, S.; Moghadam, M.; Spectrochim. Acta A
2012, 87, 112.
35. Kallury, K.; Gleeson, J.P.; Garriques, M.; LC GC N. Am. 2007, 25, 49. 36. Wu, L.P.; Li, Y.F.; Huang, C.Z.; Zhang, Q.; Anal. Chem. 2006, 78, 5570. 37. Kitagawa, S.; Munakata, M.; Higashine, A.; Inorg. Chim. Acta 1984, 84,
79.
38. Hatem, H.; Isabelle, D.B.; Monique, P.; Roger, L.; J. Org. Chem. 2004, 69, 6521.
39. J. Huo, J.; Guo, Y.; Meng, S.; Wang, M.; Wang, Y.; Complex formation of Sudan I with Cu(II) and its identification from chilli species, Bio-informatics and Biomedical Engineering (iCBBE), 4th International Conference held in Chengdu, China, 18-20 June 2010, pages: 1-4. 40. Sosa Ferrera, Z.; Padrón Sanz, C.; Mahugo Santana, C.; Santana
Rodrí-guez, J.J.; Trac-Trend. Anal. Chem. 2004, 23, 469.
41. Miller, J.N.; Miller, J.C.; Statistics and Chemometrics for Analytical Chemistry (5th edition) Pearson Education Ltd., Chapter 3, pages: 41-45, Essex, 2005.
42. Lemos, V.A.; Santos, J.S.; Baliza, P.X.; J. Braz. Chem. Soc. 2006, 17, 30.
43. Biparva, P.; Hadjmohammadi, M.R.; Acta Chim. Slov. 2007, 54, 805. 44. Wen, X.; Ye, L.; Deng, Q.; Peng, L.; Spectrochim. Acta A 2011, 83, 259. 45. Lemos, V.A.; Santos, M.S.; Dos Santos, M.J.S.; Vieira, D.R.; Novaes,
C.G.; Microcim. Acta 2007, 157, 215.
46. Tabrizi, A.B.; J. Hazard. Mater. 2007, 139, 260. 47. Satıroglu, N.; Arpa, C.; Microchim. Acta 2008, 162, 107.
48. Shokrollahi, A.; Ghaedi, M.; Gharaghani, S.; Fathi, M.R.; Soylak, M.; Quim. Nova 2008, 31, 70.
49. Baghban, N.; Shabani, A.M.H.; Dadfarnia, S.; Jafari, A.A.; Croat. Chem. Acta 2012, 85, 85.