Microstructures, crystallographic fabric development and deformation
mechanisms in natural hematite aggregates deformed under varied metamorphic
conditions
Mônica Mendes
*, Leonardo Lagoeiro
Universidade Federal de Ouro Preto, Departamento de Geologia, Campus Morro do Cruzeiro s/n, 35400-000 Ouro Preto, Minas Gerais, Brazil
a r t i c l e
i n f o
Article history: Received 8 January 2011 Received in revised form 26 March 2012 Accepted 16 April 2012 Available online 27 April 2012
Keywords:
Crystallographic preferred orientation Iron formations
Hematite
Electron backscattered diffraction Deformation mechanisms
a b s t r a c t
Naturally deformed hematite aggregates from 15 different iron ore mines located in Quadrilátero Fer-rífero region, Brazil, were analyzed in order to verify the influence of increasing temperature and deformation intensity on their microstructural and textural aspects as well as the deformation mecha-nisms associated with the metamorphic conditions. The electron backscattered diffraction (EBSD) technique was applied in order to get qualitative and quantitative data concerning with microstructural parameters, crystallographic preferred orientation (CPO) and misorientation between hematite grains. The microstructures of these aggregates vary from randomly oriented hematite grains with approxi-mately equant grains, to strongly oriented and elongated grains following the increase in deformational and metamorphic polarity toward east in the region. In the low deformation domain (western region) the deformation mechanisms are typically microfracturing and dissolution precipitation creep for magnetite rich aggregates. In the high-strain domain (eastern region), the deformation is accommodated by a combination of basal intracrystalline slip (c) (<a>) and grain boundary sliding, with rotation around hematite [c] axis. No evidences for recrystallization processes in these aggregates can be supported by our results, probably due to the superposition of subsequent processes.
Ó2012 Elsevier Ltd. All rights reserved.
1. Introduction
The iron formations from Quadrilátero Ferrífero (QF) region, located in the southeast of Brazil, draw the attention of researches not only because its high economic mineral potential, but also for the complexity of deformation of these rocks. Microstructural and textural studies, in terms of crystallographic preferred orientation (CPO), acquired a great importance due to the use of techniques of textural analysis (e.g. Siemes et al., 2000; Rosière et al., 2001; Morales et al., 2008). The use of hematite CPO data not only permits, for example, the analysis of seismic properties of iron ore bodies (Morales et al., 2008b), which can be important tools for iron ore exploration, but also allows the interpretation of deformation mechanisms that operates in the accommodation of deformation in these rocks (Siemes et al., 2003,2008;Rosière et al., 2001).
During its deformational history, the QF region was subjected to different deformational and metamorphic conditions, with a progressive increase in intensity of the deformation conditions
and temperatures toward the east (Herz, 1978; Pires, 1995). It resulted in a progressive variation, from west to east, of iron oxide content in the iron ore bodies (Lagoeiro, 1998;Rosière et al., 2001; Rosière and Rios, 2004;Barbosa and Lagoeiro, 2010) and especially textural changes (Rosière et al., 2001).
In this work, we present the results of microstructural and textural analysis of 15 iron ore samples (hematite aggregates) from different mines located in QF region (Fig. 1). These samples were analyzed through the electron backscattered diffraction (EBSD) technique (Prior et al., 1999), and the results were used to evaluate how the microstructures and the CPO of hematite minerals vary in different tectonic domains and the implications in terms of the deformation mechanisms responsible for the observed micro-structures and the determined CPOs.
Similar work was previously carried out byRosière et al. (2001). These authors performed microstructural and textural analysis of iron ore sampled in different deformational and metamorphic domains in QF. Textural analysis of hematite was conducted via the neutron diffraction technique. The authors verified that the CPO patterns vary with the increasing of the deformation and concluded that the deformation occurred by basal slip, diffusive processes and grain growth. Even though the neutron diffraction technique *Corresponding author. Tel.:þ55 31 9247 9798.
E-mail address:[email protected](M. Mendes).
Contents lists available atSciVerse ScienceDirect
Journal of Structural Geology
j o u r n a l h o m e p a g e : w w w . e l s e v i e r . c o m / l o c a t e / j s g
(Siemes et al., 2000;Rosière et al., 2001) gives a good insight to the CPO of the analyzed sample, a correlation with microstructures cannot be done. Since the EBSD technique permits the control of the acquisition grid in a selected area of the sample, it is possible to make a direct correlation of the crystallographic orientation and its corresponding microstructure.Morales et al. (2008)characterized the CPO and microstructures of a folded iron formation through EBSD technique, getting satisfactory results concerning the micro-structural characterization and deformational mechanisms inter-pretation. However this work was conducted in a folded layer of polycrystalline hematite and does not represent the complexity of the area in terms of its deformation and metamorphic style over the entire region.
2. Geological context of Quadrilátero Ferrífero area
The Quadrilátero Ferrífero region is located in the southern of São Francisco Craton (Almeida, 1977) and comprises an Archaean granite-gneiss basement, covered by Archaean greenstone belts of the Rio das Velhas Supergroup and Paleoproterozoic platform metasediments of the Minas Supergroup (Dorr, 1969) (Fig. 1). The studied samples came from the Cauê Formation of the Minas Supergroup, a stratigraphic unit which hosts banded iron forma-tions and giant iron ore bodies in the region (Rosière et al., 2008). The QF is characterized by a complex structural arrangement, with Archaean basement domes surrounded by large synclines containing the Minas Supergroup (Dorr, 1969;Chemale et al., 1994; Alkmim and Marshak, 1998). The proposed tectonic evolution for the region suggests three main deformational phases (Alkmim and Marshak, 1998). Thefirst episode generated fold and thrust belts with an NEeSW trend, verging to NW, during the Paleoproterozoic
Transamazonian cycle (2.1e1.8 Ga). The second phase is related to the Transamazonian orogenic collapse, caused by a regional extensional tectonic, resulting in an uplift of the Archaean granite-gneiss domes and formation of the regional synclines (the dome-and-keel structure, of Marshak and Alkmim, 1989). The third event is related to the Neoproterozoic Brasiliano orogeny (0.7e0.45 Ga), and was responsible for the formation of fold and thrust belts verging toward the west (Alkmim and Marshak, 1998). According to Rosière et al. (2008), these orogenic events were responsible for the great transformation in iron formation rocks, where high grade iron bodies replaced the itabirites, due to the hypogene processes andfluid percolation.
The metamorphism in QF is described as a low grade regional type, varying from greenschist facies, in the western portion to low to intermediate amphibolite facies (Herz, 1978;Pires, 1995) in the eastern. The regional metamorphism temperatures vary from 300 to 600 and estimated pressures ranges from 3 to 5 kbar (Pires, 1995). Thermal metamorphism of low to intermediate tempera-tures is also described, and it is related to the uplift of the basement domes during the extensional tectonic related to the orogenic collapse (Marshak and Alkmim, 1989).
3. Sampling and iron ore petrography
Iron ore rocks were sampled in different structural contexts in QF region (Fig. 1). A total of 15 samples from different iron ore mines were selected, in order to analyze the microstructural and textural variation due to deformation and metamorphic polarities. These samples are representative from each mine where they were collected, avoiding local features, such as macroscopic folds or local shear zones. At first, they were analyzed through an optical
Fig. 1.Quadrilátero Ferrífero simplified geological map (modified fromDorr, 1969), showing the main structures and stratigraphic units. The iron formations, in black, have a widespread distribution in the region. The circles in map indicates the localization of the mines where the samples were collected: ITITeItatiaiuçu; CFeCórrego do Feijão; ACe Águas Claras; CMeCapitão do Mato; MPeMina do Pico; MFeMina de Fábrica; CPeCasa de Pedra; BRUeBrumafer; GSeGongo Soco; BAUeBaú; ALeAlegria; FZeFazendão; TOeTimbopeba; CEeConceição; HTCeItabira; CAeCauê. The zones of different deformation intensities are shown, according toRosière et al. (2001).
microscope, in order to observe their general microstructural aspects. Taking into account the deformational (Rosière et al., 2001) and metamorphic intensity polarities (Herz, 1978;Pires, 1995), and also the microstructural and iron oxides composition variation, these samples were classified in three deformational domains, according to the more significant variations: low deformation domain (western region of QF), high deformation domain (eastern region of QF) and intermediate deformation domain, where the rocks assume transi-tional characteristics between these two domains of more con-trasting deformational intensities. This classification was done
according to the most expressive microstructural and mineralogical characteristics observed in these rocks. It is important to note that the changes in iron ore rocks are progressive, according to the increase in deformational intensity and metamorphic grade.
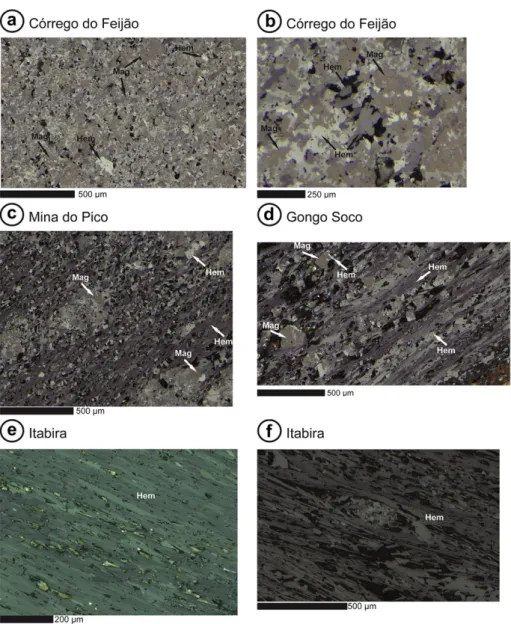
Iron ore rocks from the low deformation domain (ITITe Ita-tiaiuçu and CF e Córrego do Feijão) are composed mainly of magnetite. They occur as fragments of varied sizes and shapes with
irregular contours (Fig. 2a). The crystals show evidence of trans-formation to hematite (Fig. 2b). The transformation occurs along the fractured surfaces as well as in the octahedral magnetite crys-tallographic planes, and new crystals of hematite formed in opened spaces of fractured grains (Fig. 2b). Hematite crystals are granular in shape and form lobular aggregates, with irregular and reentrant boundaries. Tabular and lamellar crystals also occur in a lesser amount. These samples show neither shape preferred orientation (SPO) nor CPO, as can be observed by the non uniformity on hematite extinctions under crossed polarized light.
Samples from the intermediate domain (ACeÁguas Claras, CM eCapitão do Mato, MPeMina do Pico, MFeMina de Fábrica, CPe Casa de Pedra, BRUeBrumafer, GSeGongo Soco, BAUeBaú, FZe Fazendão and TOeTimbopeba) represent a transition in terms of iron oxide mineralogy and microstructural characteristics. The amount of magnetite decreases in a significant way, comparing to iron ore rocks from the west domain (Fig. 2c). Hematite grains of
lobate and more equant shapes coexist with lamellar hematite crystals (Fig. 2c and d). These lamellar crystals tend to occur aligned parallel to the bulk foliation of the iron rocks which imprint in these rocks an incipient SPO. There is a progressive increase of proportion of crystals of hematite of lamellar shape toward the eastern part of the QF, which can result in gradual predominance of rocks with a pronounced SPO (Fig. 2c and d).
In the eastern high deformation domain (CAeCauê, CEe Con-ceição e HTCeItabira), the iron ore rocks have a schistose aspect (Fig. 2e and f). In this domain, the rocks are formed exclusively by hematite, with sparse or no magnetite crystals. Hematite occurs as tiny platelet-like grains, with specular aspect (specularite). These rocks are commonly called hematitites. There is a predominance of lamellar hematite, with straight boundaries that aligns completely with the major extension direction, giving the aggregates a strong SPO (Fig. 2e). Local aggregates of lobular and granular crystals are also observed, although in a significantly less proportion (Fig. 2f).
4. EBSD analysis
EBSD analyses were performed in a SEM JEOL JSM5510 equipped with Nordlys HKL-Oxford EBSD detector, installed in the Laboratory of Microscopy and Microanalysis (MICROLAB), in the Department of Geology of the Universidade Federal de Ouro Preto, Brazil. The SEM operated at 20 keV and mean beam current of 64
m
A. The samples to be analyzed were oriented in the SEM chamber with a tilt angle of 70to the horizontal. Other parameters used were working distance of 32 mm and mean angular deviation (MAD), which corresponds to the deviation between the standard Kikuchi bands of the mineral and those obtained for the sample, of 1 or 1.5. The minimum and maximum numbers of detected bands used were 5 and 7 respec-tively, and the number of reflectors equal to 50. The EBSD data were acquired and processed through software package Channel 5 (Oxford-HKL). The post-processing of orientation maps was carried out using the Tango program, eliminating the non-indexed and misindexed points by spike correction and extrapolating the indexed data to produce realistic maps. The microstructural parameters of the grains, such as area, diameter and aspect ratio were obtained through the same program. Inverse polefigures (IPFs) and rotationaxis of the crystals were obtained through the Mambo program and the polefigures for prismatic planes {11e20} and {10e10}, rhomb plane {10e14} and basal {0001} crystallographic plane were plotted using the program PFch5 (Mainprice, 1990). The PFch5 also generate the pole figure J (pfJ) index, which uses the formulation of Michibayashi and Mainprice (2004). A random distribution is char-acterized by a pfJ of unity whereas a single crystal will have a much larger pfJ index. Misorientation between grains is expressed as
histograms of distribution of misorientation angles (correlated and uncorrelated grains) and distribution of misorientation axes (Mambo program). The plotted points correspond to the activated rotation direction, coincident with crystallographic directions, for each rotation angle interval.
5. Results
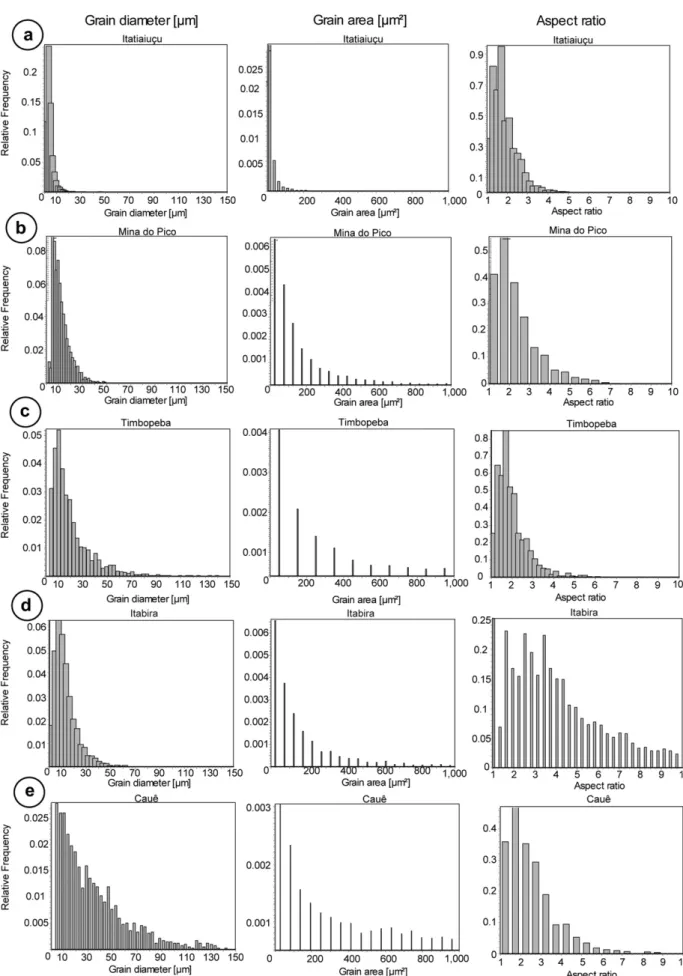
5.1. Grain shape and size distribution
The grain size is expressed here as the equivalent circular diameter (ECD), while the grain aspect ratio is calculated by the ratio between major and minor axis of a bestfit ellipse, with the
data presented in frequency histograms. Although we have made extensive measurements of samples throughout the QF, onlyfive samples were taken as a representative data set for the region.
In general, the grain size increases from W to E (Fig. 3). Comparing the grain diameter histograms forfive examples from different domains in QF, it can be observed that for samples from the west (Fig. 3a), the frequency of grains smaller than 10
m
m is higher (nearly 0.25), comparing to the other samples (smaller than 0.085). There is an increase in frequency of grains larger than 10m
m, as can be seen in samples from Mina do Pico, Timbopeba and Cauê mines (Fig. 3b, c and e), where histograms illustrate the increase of frequency of grains larger than 30m
m. Conversely, there is a relative decrease in grain size for another sample from the higher deformed domain (Fig. 3d), which shows lower values of relative frequencies for grains larger than 30m
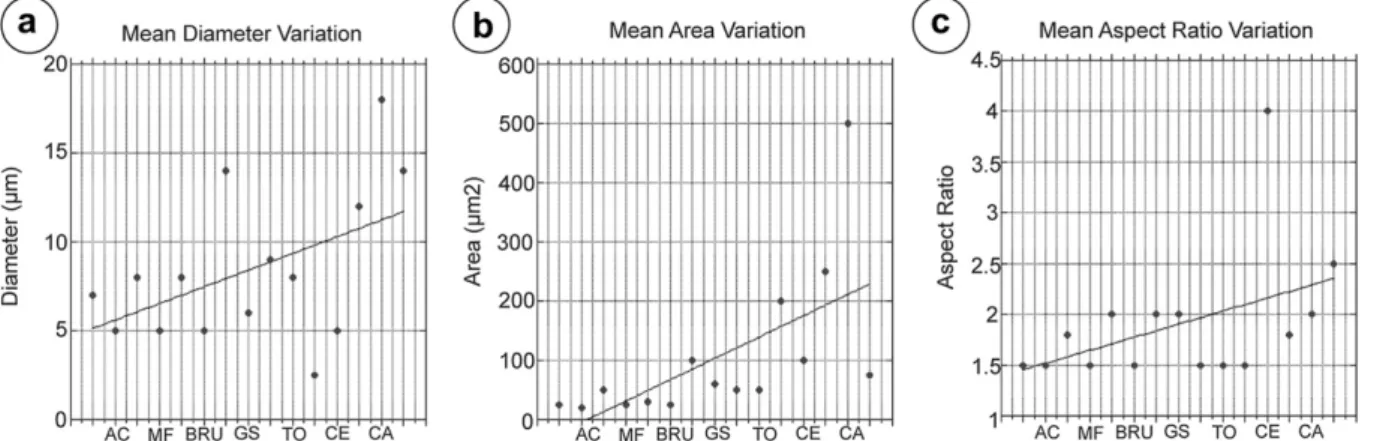
m, comparing to the sample from Tim-bopeba (Fig. 3c) and the sample from Cauê (Fig. 3e), this one also from the higher deformed domain. As the grain area is equivalent to the grain diameter, the same tendency observed for the grain size distribution is also observed for the grain area distribution (Fig. 3). Similarly to the grain size distribution, the grain aspect ratios also tend to increase toward the eastern domain. The sample from western region (Fig. 3a) shows a high frequency (z0.95) for aspect ratio values between 1 and 2, while samples from other domains show frequencies lower than 0.85 for the same aspect ratio interval. There is an increase in frequencies for aspect ratios larger than 2 for the other samples, while the sample from the eastern domain shows the highest aspect ratio of all, with the higher frequencies of grain aspect ratios larger than 4, with the exception of one sample from Cauê Mine (Fig. 3e).Fig. 4shows the plots for mean values of each microstructural parameter for all the analyzed samples (from western to eastern domains). It can be noted that there is trend in the microstructural data, from lower values in the west to the higher in the east, even though they lack a regular and linear trend between the extremes.5.2. Crystallographic preferred orientations
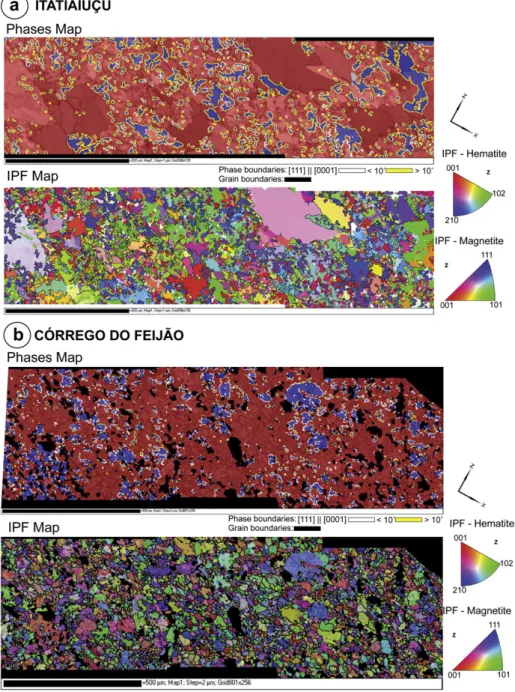
CPO patterns show important variation according to the increasing deformation and metamorphic grade in the QF area. The orientation data are presented here as Inverse Pole Figures (IPF) maps (Figs. 5e7) and Pole Figures (PFs) (Fig. 8). In the inverse pole
figure maps colors represent the crystallographic directions which
are oriented in a particular direction of the sample reference system, in this case, theZdirection, which corresponds to the pole of the rock’s foliation plane. Through these maps, it is possible to make a direct correlation between microstructures and CPOs. In order to make the distinction between the CPOs of the different iron oxides phases, a phase map corresponding to each IPF map is also presented. In these phase maps, the phase boundaries shared between magnetite and new hematite crystals are represented.
Comparing samples from the different domains, a remarkable increase in the intensity of the CPO patterns can be observed. IPF maps from western domain (Fig. 5) show a great dispersion on crystallographic orientation. Maps from the intermediate domain (Fig. 6) show an increase in CPO. The‘red’hematite grains in IPF maps, with platelet shape, have their basal planes aligned with the foliation plane. However, grains with more granular shapes tend to show a somewhat divergent CPO. The hematite aggregates from eastern domain have a strong CPO. They show a single maximum around theZdirection (Fig. 7), due to the strong alignment of the basal planes with the foliation plane.
The poles to the main crystallographic planes were plotted in relation to theX-Z reference system in the stereographic projec-tion, lower hemisphere, with the foliation in EeW vertical posi-tion and the lineaposi-tion horizontal also in EeW posiposi-tion. Comparing
Fig. 5.Phase and Inverse Pole Figure (IPF) orientation maps obtained through EBSD analysis for samples from western low deformation domain. In phase maps, hematite crystals are in red and magnetite ones in blue. In these maps, the phase boundaries between magnetite and hematite and the grain boundaries are shown. Legends of IPF maps refer to different colors in maps, which correspond to different crystallographic orientation of the samples related to its reference frame. a) Itatiaiuçu and b) Córrego do Feijão mine. No CPO can be observed. (For interpretation of the references to color in thisfigure legend, the reader is referred to the web version of this article.)
the pfJ values of polefigures onFig. 8, for each crystallographic direction, it is possible to note that the increase of pfJ values is related to the increasing strength in pole figures, with higher values in polefigures from eastern domain (Fig. 8e and f). Pole figures from the low deformation domain and low greenschist metamorphic grade (Fig. 8a) show more dispersed distribution patterns. The pfJ values for all the PFs are approximately equal to 1, what indicates a weak or absent CPO. Toward the eastern higher deformation domains (Fig. 8bed), the concentration of poles to the prismatic, rhomb and basal planes becomes stronger compared to the samples from the west. Poles to the prismatic plane tend to have a greater concentration around the lineation direction (X-axis), forming single patterns, with some dispersion along the foliation plane. pfJ values for prismatic planes vary from 1.14 to 1.36, with greater values for samples further to the east. Poles to basal plane tend to concentrate around the foliation normal (Z-axis) or distribute in a girdle in theYZplane. The cor-responding pfJ values vary from 1.66 to 2.80. Poles to the rhomb planes concentrate in an intermediate position between the foli-ation planeXeYand the foliation normal, forming two symmetric maximums around theZ-axis. The pfJ values for rhomb PFs vary from 1.10 to 1.25. In the higher deformation and temperature domains of the east side of the QF area, the CPOs become stronger
with more defined patterns (Fig. 8e and f). Poles to the basal plane
tend to form a single maximum around theZdirection, similar to a single crystal pattern. The pfJ values are considerably high (13.09 and 22.49). The poles to the prismatic plane tend to scatter on the foliation plane, although subtle maxima occur in the X-direction. The poles to the rhomb planes tend to distribute in a girdle in an intermediate position between the foliation plane and its normal.
Contrasting to hematite aggregates, magnetite pole figures (Fig. 9) show a scattered distribution of poles to the main crystal-lographic planes, as shown by the low values of pfJ. Nevertheless, poles to {111} tend to show a slight tendency to concentrate half way betweenYandZdirection.
5.3. Misorientation data
The misorientation between two crystals is expressed by the rotation angle necessary to put into coincidence two crystal lattices, around an axis corresponding to the same crystallographic direc-tion for both lattices.
from lower deformation domains show relatively higher misori-entation angles (Fig. 10a), compared to aggregates of the highly deformed domains (Fig. 10d). It can be noticed that for the sample representing the domain of lower deformation intensity, the distribution of misorientation angles is close to the theoretical curve which represents the distribution of randomly oriented grains (Wheeler et al., 2001). From the top to the bottom ofFig. 10 (samples from western to eastern domains), the distribution of misorientation angles tends to have a greater misfit with respect to theoretical curve.
Rotation axis plots (Fig. 10) show progressive variation of the rotation angle and the activated rotation axis according to the structural positioning of the analyzed samples. In the less deformed samples from the western domain (Fig. 10a), the diagrams show a great dispersion of rotation axes in all angle intervals, meaning that the misorientation axis can attain any crystallographic direc-tion. With respect to the sample reference system there is no preference for the rotation axes for any particular orientation in any specific angle intervals. In the transitional domain, in the central
portion of the QF area (Fig. 10b and c), the rotation axes becomes more concentrated and preferentially achieve a position parallel to the [0001] hematite axes in the crystal reference frame and parallel toZin the specimen reference system, and this is particularly more evident for misorientation angles around 60. For some samples (Fig. 10c), rotation around a-axes becomes more expressive, occurring for high misorientation angles (>60). In the far East (Fig. 10d), rotation occurs predominantly around the [0001] hematite axes and theZdirection of the crystal and the sample, respectively. A strong concentration along those directions occurs
for misorientation angles in a range 15e60. Above 60, the misorientation axes show greater dispersion.
6. Discussion
The microstructural and CPO data obtained for the analyzed samples allow us to make some conclusions about the variation of microstructures and deformation mechanisms with respect to the deformation intensity and metamorphic grade in the QF area. These data obtained in this study show contrasting distribution patterns between the different domains in the QF area.
According to microstructural variation, despite a non linear increase of microstructural parameters values, some tendency can be observed (Fig. 4) in the plot of mean values. In general, there is an increase in grain size (and grain area) and also in grain aspect ratio with the increase of temperature and deformational intensity toward eastern region. Low values of grain aspect ratio in the western domain (approximately equal to 1) are related to the predominance of granular and lobular hematite grains. There is an increase in grain size related to the higher temperatures toward the eastern domain (Herz, 1978;Pires, 1995). The smaller grain size observed for the sample from Itabira, eastern domain of higher deformation intensity might be related to recrystallization which may have occurred at some point of the deformation and meta-morphic history of these rocks. Misorientation data plus the microstructural data obtained for the eastern domain rocks do not allow any conclusion about the recrystallization process, since there is no straightforward relationship between angles and axes of misorientation with the possible mechanism of recrystallization, Fig. 7.Phase and Inverse Pole Figure (IPF) orientation maps obtained through EBSD analysis for samples from eastern high deformation domain. In phase maps, hematite crystals are in red. Legends of IPF maps refer to different colors in maps, which correspond to different crystallographic orientation of the samples related to its reference frame. a) Conceição Mine and b) Sample from Itabira region. Aggregates are composed predominantly by hematite, with a strong CPO. (For interpretation of the references to colour in thisfigure legend, the reader is referred to the web version of this article.)
e e e
such as subgrain rotation. Notwithstanding, experimental works by Siemes et al. (2010)have shown that in fact there is a decrease in grain size for increasing strain in iron oxide rocks. Therefore the increase in the deformation toward the east should be accompa-nied by an increase in temperature to explain the larger grain sizes of hematite grains in the east side compared to those in the west domains. Similarly to the grain size, the grain aspect ratio also increases and this might be related to de development of hematite platelets in response to the increase of the deformational intensity, with the growing of hematite crystals parallel to the shearing plane. In addition to the grain size distribution as well as to the aspect ratio, the shape of grain boundaries also varies greatly from one domain to the other. In the lower temperature domains, where magnetite minerals predominate, grain boundaries of irregular shape prevail, probably because in this domain the dominant deformation mechanism evolves a combination of microfracturing and pressure solution.
Taking into account the CPO and misorientation data obtained, it was possible to make some inferences concerning to the mecha-nisms involved in the deformation of hematite rocks in the QF area. The west domain has hematite aggregates with a weak CPO char-acteristic of the low deformation and temperature domains. The misorientation angles show a similar distribution to the theoretical curve, what also suggests a random distribution of the hematite grains (Fig. 10a). Aggregates from this area preserve a high propor-tion of magnetite to hematite. Evidence indicates that the defor-mation of iron fordefor-mations started with the transfordefor-mation of magnetite to hematite (Lagoeiro,1998;Barbosa and Lagoeiro, 2010). The observed dispersion of the CPO for the hematite aggregates might be in part related to the inheritance of the original crystallo-graphic orientation of magnetite crystal (Fig. 8a andFig. 9). The transformation of magnetite to hematite occurs along the crystal-lographic planes {111} of the former and the newly-formed hematite grains share their basal planes with the octahedral planes of the
magnetite crystals (Fig. 11). Microfracturing occurs in these contact regions allowingfluids to percolate along these interphases, causing
the dissolution of magnetite and precipitation of new hematite platelets near magnetite crystals (Fig. 2b andFig. 11a). The new hematite grains which grew with their basal (0001) plane parallel to the foliation, and consequently, with crystallographic directions [0001] parallel to theZ-axis and one of the [a] direction or poles to {m} planes parallel toX-direction of the sample, began to deform by glide on their basal plane (Fig. 12b). This is an indicative of the operation of crystal plastic deformation mechanism in the low (or weak) deformed samples. In addition, the phase transformation and the oriented growth of elongated hematite crystals might have enhanced the deformation in these rocks contributing significantly to the strain softening in iron formations, as was previously considered byRosière et al. (2001). However, the deformation by slip along the basal planes is limited to hematite grains which grew orientated in an easy slip orientation. Concerning the recrystalliza-tion process, optical evidence, such as undulose extincrecrystalliza-tion or the development of subgrains, is not observed in the aggregates of the low deformation domains. The misorientation data strengthen the conclusion that a mechanism of recrystallization involving progressive subgrain rotation is unrealistic. Evidence of a tilt mechanism (Fig. 12c), which would occur with the rotation of neighbor lattices around the hematite <a> axis and which is believed to be associated with hematite recrystallization is not observed, as can be seen by the dispersion of the rotation axes plotted for the hematite grains in both the crystal and the sample reference systems. High misorientation angles indicate a great misfit
between the lattices of correlated and uncorrelated grains. There-fore, if recrystallization occurred in some stage of deformation of iron formations, it was overcome by subsequent processes.
In the central area of the QF, a decrease in the magnetite proportion and a consequent increase in the hematite content are observed. Residual magnetite crystals are almost completely Fig. 9.Magnetite polefigures obtained for samples from low deformation domain. a) Itatiaiuçu and b) Córrego do Feijão mine. A great dispersion of distribution of poles to main crystallographic {100} octahedral {111} and {110} can be observed. In b, a subtle maximum is observed for octahedral plane near theZdirection of reference frame. Polefigures obtained fromMainprice (1990), lower hemisphere projection.
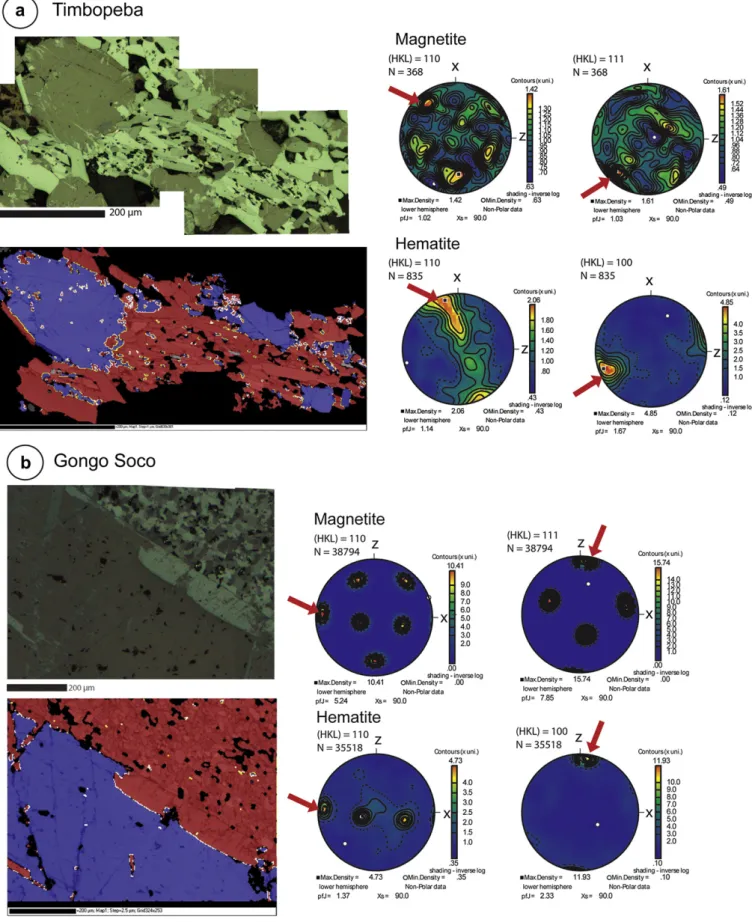
Fig. 11.The transformation of magnetite to hematite. In a) Timbopeba mine and b) Gongo Soco mine. Photomosaics (crossed polarized light), phase maps (hematite in red and magnetite in blue) and polefigures for main coincident planes in magnetite and hematite are shown. Red arrows show coincident maximums for coincident planes in both phases. Comparing (111) polefigure for magnetite crystals and (100) for hematite, the relationship between the two phases during the transformation process can be seen. It is well illustrated by phase map on b. (For interpretation of the references to colour in thisfigure legend, the reader is referred to the web version of this article.)
transformed to hematite. The CPO patterns become more defined
(Fig. 6andFig. 8bed) and misorientation angle distribution histo-grams show an increasing misfit of the distribution of misorienta-tion angles and the theoretical curve. This represents a shift from the more random distribution of hematite aggregate in the west to preferred oriented crystals in the east side. As we can infer from the CPO patterns obtained for the hematite aggregates in this domain (Fig. 8bed), the accommodation of the deformation by slip on basal planes of hematite platelets (Fig. 12b) becomes more efficient. A more pervasive foliation developed in these higher deformed domains (Fig. 6). New crystals of hematite have a more pronounced shape orientation and the platelet grains have their basal planes orientated parallel to the foliation, an easy glide orientation for hematite crystals. The glide occurs in the<a>-direction, along the (0001) hematite planes parallel to the poles to thefirst or second order prismatic planes. This might account for the girdle shape of the polefigures of prismatic planes around thex-axis of reference frame. Hematite crystals do not show any optical sign of crystal-plastic deformation. Misorientation data do not support any evidence for a subgrain rotation recrystallization, a similar char-acteristic to the low deformation western domains. However, a dynamic recrystalization mechanism involving progressive sub-grain rotation cannot be totally ruled out. This process might have occurred, and grain boundary sliding mechanism as well as rotation around [c] axis (Fig. 12d), might have caused a scattering in the misorientation angles. There is some concentration of the rotation axes around the pole to the prism planes (Fig. 10c), but, only for high misorientation angles, in which case it is difficult to establish any relationship with a particular recrystallization processes. Concentrations of the rotation axes around the c- and thez-axes of the crystal and sample reference system, respectively (Fig. 10b and c), and some dispersion of the poles to the prism planes and the a-axes in polefigures might be due to a rotation of hematite grains
around theirc-axes possibly caused by some grain boundary sliding during the shear deformation along the foliation plane (Fig. 12d), as discussed by Morales et al. (2008). This mechanism of grain boundary sliding might have been accomplished byfluid-assisted
grain boundary migration to prevent grains from losing coher-ence along their boundaries.
In the eastern high deformation domain, dominated by thick shear zones (Rosière et al., 2001), schistose rock samples consist of aggregates of strongly oriented hematite grains. Magnetite relicts are rare or absent. The CPO data show a strong texture in the aggregates of this domain (Fig. 7andFig. 8e and f). pfJ values show a great increase in strength of CPO in this domain. Misorientation angles show a great misfit with respect to the theoretical curve
(Fig. 10d), which result from the increase of crystallographic orien-tation strength. The deformation in this domain is mainly accom-modated by slip on the hematite basal planes, which can be attested by the remarkably strong single crystal texture of the hematite aggregates in a single maximum parallel to the foliation pole (Fig. 7 andFig. 8e and f). However, there is not a correspondent maximum either of {m} or<a>along the foliation plane (Fig. 8e and f). In fact, these directions have a dispersed orientation along the foliation plane, even though a discrete maximum appears for the<a>-axes. The spreading of the<a>axes as well as the pole to the {m} planes in the foliation plane suggest that in addition to the slip, some rotation along thec-axes might have occurred, which is confirmed by the rotation axes plotted in theFig. 10d. It can be seen that the rotation occurred predominantly aroundc-axis of hematite and z-axis of sample reference system, suggesting that the deformation was not exclusively accommodated by intracrystalline slip but also by a significant component of rotation around the hematite c-axis (Fig. 12d).
As there is no conclusive evidence for recrystallization in all these rocks we propose an alternative model for the development
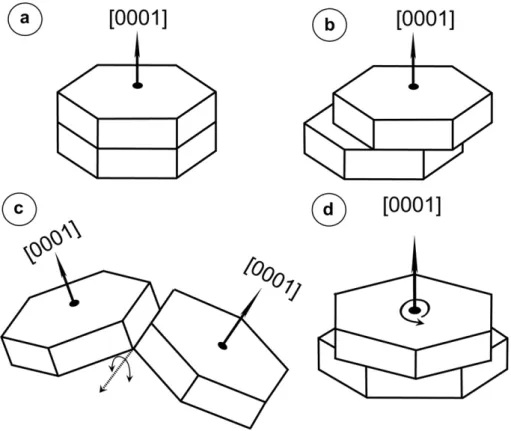
Fig. 12.Schematic representation of deformation mechanisms operated in hematite. a) Representation of a hematite crystal. b) Slip along hematite {0001} plane on<a>direction.
of preferred orientated hematite crystals in the studied rocks. The new hematite grains might have been formed by a direct trans-formation from the magnetite grains. Therefore, the new-formed hematite crystals inherited their orientations from the host magnetite (Fig. 11). However, only new-crystallized hematite grains which grew from magnetite crystals having their {111} planes parallel to the shear plane were oriented favorably for slip on basal planes. As those favorable oriented grains become more prevalent over the other orientations, a great amount of grains with their basal planes parallel to each other start to accommodate the deformation not solely by slip but also by sliding along boundaries parallel to the (0001) planes. Hematite grains rotated and acquired a stable position at misorientation angles 50e60, in a more expressive way in the higher deformed domains. This angle interval might be related to the trigonal symmetry of hematite crystals. This in other minerals such as quartz of trigonal symmetry is normally described as a twinning relationship of the Dauphiné type (Tullis and Tullis, 1972) and this, similarly for quartz crystals, might represent for hematite neighboring crystals special boundaries of lower energy configuration.
Experimental triaxial compression in polycrystalline hematite (Siemes et al., 2003) resulted in {a}<m>slip below 800C and (c) <a>slip at 800 and 900. Our results do not confirm the existence of a slip along prismatic planes. In our samples, slip along basal planes is the predominant mechanism. Compression tests in hematite single crystals (Siemes et al., 2008) indicated the exis-tence of twinning, {a}<m>slip and (c) <a>slip. However, no evidence of both twinning and prismatic slip was found.
The results obtained here are in agreement with recent torsion experiments on hematite aggregates (Kunze et al., 2008;Siemes et al., 2010, 2011). Pole figures exhibit similar patterns to those illustrated by these authors. According to these authors, there is an increase in CPO with the increase of temperature and strain during experiments. Nevertheless, Siemes et al. (2010, 2011) advocate, through the experiments results, that the texture intensity is dependent of initial microstructure of the aggregates. This is a factor that we cannot control on naturally deformed samples. Values for stress exponentnobtained bySiemes et al. (2010)suggest a combi-nation of intracrystalline dislocation creep and GBS, which is in accordance with our interpretations, although direct evidence for dynamic recrystallization is hard tofind in these rocks.
Our results also agree with the data obtained byRosière et al. (2001), especially concerning the variations of textural data obtained according to tectonometamorphic context in the QF area. The deformation occurred by intracrystalline slip along the basal planes of newly-formed hematite platelets resulting from the anisotropic growth of specular hematite. Nevertheless, in the light of the results obtained by this study, evidence for recrystallization processes, considered by those authors, could not be conclusive.
7. Conclusions
Based on the observation of the microstructures as well as the data on hematite crystal fabrics we drew the following conclusions:
The variation in the temperature and deformation intensity in
the Quadrilátero Ferrífero area caused a diversity of micro-structural and textural features;
Variation in hematite grain sizes and grain shapes are the result
of the deformational processes that had affected these rocks;
The phase transformation and the growth of oriented
elon-gated hematite crystals might have enhanced the deformation in these aggregates, contributing to the strain softening in iron ore bodies;
The deformation mechanisms varied with the increasing of
temperature and deformation intensity. Initial aggregates from the western region of lower deformation intensity, composed of hematite and a great amount of magnetite, deformed mainly by microfracturing. These aggregates were submitted to a great change, due to the transformation of magnetite to hematite by the mechanism of dissolution/precipitation creep. With the increase in deformational and temperature gradients, in the central and eastern regions of QF, actuation of crystal plastic mechanism of intracrystalline slip and the grain boundary sliding took place;
Our set of data does not support the existence of
recrystalli-zation processes in these aggregates. Nevertheless we do not eliminate the possibility that this process might have occurred at some point of the evolutional history of these rocks, but was superimposed by later processes.
Acknowledgments
The authors are grateful to Gilberto Álvares for essential help on sample preparations and to Heinrich Siemes and Luiz Morales, for their thoughtful reviews. Mônica Mendes is grateful to Cristiane Gonçalves, Humberto Reis, Fernando Alkmim and Luiz Morales for valuable discussions. This project was funded by CNPq project n 478776/2009-8.
References
Alkmim, F., Marshak, S., 1998. Transamazonian orogeny in the southern São Fran-cisco craton region, Minas Gerais, Brazil: evidence for Paleoproterozoic collision and collapse in the Quadrilátero Ferrífero. Precambrian Research 90, 29e58. Almeida, F.F.M., 1977. O Cráton do São Francisco. Revista Brasileira de Geociências 7,
349e364.
Barbosa, P.F., Lagoeiro, L., 2010. Crystallographic texture of the magnetite-hematite transformation: evidence for topotactic relationships in natural samples from Quadrilátero Ferrífero, Brazil. American Mineralogist 95, 118e125.
Chemale Jr., F., Rosière, C.A., Endo, I., 1994. The tectonic evolution of the Quad-rilátero Ferrífero, Minas Gerais, Brazil. Precambrian Research 65, 25e54. Dorr 2nd, J.N., 1969. Physiographic, stratigraphic and structural development of the
Quadrilátero Ferrífero, Minas Gerais. US Geological Survey Professional Paper 641-A, 1e110.
Herz, N., 1978. Metamorphic rocks of the Quadrilátero Ferrífero, Minas Gerais, Brazil. US Geological Survey Professional Paper 641-C, 1e81.
Kunze, K., Siemes, H., Rybacki, E., Jansen, E., Brokmeier, H.G., 2008. Microstructure and texture from experimentally deformed hematite ore. In: Richter, S., Schwedt, A. (Eds.), EMC 2008. Materials Science, 14th European Microscopy Congress, vol. 2. Springer-Verlag, Berlin Heidelberg, pp. 827e828.
Lagoeiro, L., 1998. Transformation of magnetite to hematite and its influence on the dissolution of iron oxide minerals. Journal of Metamorphic Geology 16, 415e423.
Mainprice, D., 1990. An efficient Fortran program to calculate seismic anisotropy from the lattice preferred orientation of minerals. Computers & Geosciences 16, 385e393.
Marshak, S., Alkmim, F.F., 1989. Proterozoic contraction/extension tectonics of the southern São Francisco region, Minas Gerais, Brazil. Tectonics 8, 555e571.
Michibayashi, K., Mainprice, D., 2004. The role of pre-existing mechanical anisot-ropy on shear zone development within oceanic mantle lithosphere: an example from the Oman ophiolite. Journal of Petrology 45 (2), 405e414. Morales, L.F.G., Lagoeiro, L.E., Endo, I., 2008. Crystallographic fabric development
along a folded polycrystalline hematite. Journal of Structural Geology 30, 1218e1228.
Morales, L.F.G., Lagoeiro, L.E., Endo, I., 2008b. First results on the LPO-derived seismic properties of iron ores from the Quadrilátero Ferrífero region, south-eastern Brazil. Tectonophysics 460, 21e33.
Pires, F.R.M., 1995. Textural and mineralogical variations during the meta-morphism of the Proterozoic Itabira Iron formation in the Quadrilátero Fer-rífero, Minas Gerais, Brazil. Anais da Academia Brasileira de Ciências 67 (1), 77e105.
Prior, D.J., Boyle, A.P., Brenker, F., Cheadle, M.C., Day, A., Lopez, G., Potts, G.J., Reddy, S., Spiess, R., Timms, N., Trimbby, P., Wheeler, J., Zetterstrom, L., 1999. The application of electron backscatter diffraction and orientation contrast imaging in the SEM to textural problems in rocks. American Mineralogist 84, 1741e1759.
Rosière, C.A., Quade, H., Brokmeier, H.G., Jansen, E.M., 2001. Microstructures, textures and deformation mechanisms in hematite. Journal of Structural Geology 23, 1429e1440.
Rosière, C.A., Rios, F.J., 2004. The origin of hematite in high-grade ores based on infrared microscopy andfluid inclusion studies: the example of Conceição Mine, Quadrilátero Ferrífero, Brazil. Economic Geologists 99, 611e624. Rosière, C.A., Spier, C.A., Rios, F.J., Suckau, V.E., 2008. The itabirites of the
Quad-rilátero Ferrífero and related high-grade iron ore deposits: an overview. Society of Economic Geologists Reviews 15, 223e254.
Siemes, H., Schaeben, H., Rosière, C.A., Quade, H., 2000. Crystallographic and magnetic preferred orientation of hematite in banded iron ores. Journal of Structural Geology 22 (11/12), 1747e1761.
Siemes, H., Klingenberg, B., Rybacki, E., Naumann, M., Schäfer, W., Jansen, E., Rosière, C.A., 2003. Texture, microstructure, and strength of hematite ores experimentally deformed in the temperature range 600e1100 C and at strain rates between 10 4 and 10 6 s 1. Journal of Structural Geology 25,
1371e1391.
Siemes, H., Klingenberg, B., Rybacki, E., Naumann, M., Schäfer, W., Jansen, E., Kunze, K., 2008. Glide systems of hematite single crystals in deformation experiments. Ore Geology Reviews 33, 255e279.
Siemes, H., Rybacki, E., Kunze, K., Klingenberg, B., Naumann, M., Jansen, E., Brokmeier, H.-G., 2010. Development of microstructure and texture of hematite ores deformed to large strain in torsion: can texture identify the prevailing strength and creep mechanisms during deformation? Advanced Engineering Materials 12, 1003e1007.
Siemes, H., Rybacki, E., Klingenberg, B., Rosière, C.A., 2011. Development of a recrystallized grain size piezometer for hematite based on high-temperature torsion experiments. European Journal of Mineral 23, 293e302.
Tullis, J., Tullis, T., 1972. Preferred orientation of quartz produced by mechanical Dauphiné twinning: thermodynamics and axial experiments. American Geophysical Union Monograph 16, 67e82.