Effect of the Low Temperature Annealing on Primary and
Secondary Structures and Magnetic Properties of Fe-3% Si
Maria das Graças Melo Moreira Cesara*, Sebastião da Costa Paolinellib,
Fabrício Luiz Alcântarab, André Barros Cotaa
aFederal University of Ouro Preto – UFOP, Redemat, Praça Tiradentes, 20, CEP 35400-000, Ouro Preto, MG, Brazil
bResearch Department, ArcelorMittal Inox Brasil, Praça 1º de Maio, 9, CEP 35180-018, Timóteo, MG, Brazil
Received: December 31, 2010; Revised: September 2, 2011
The processing of 3% Si steel is characterized by the use of MnS particles as a normal grain growth inhibitor. Experiments were carried out to investigate the grain growth in this material during heat treatments at low temperature. Industrial decarburized samples were annealed in the range 825-845 °C and a detailed study of grain size and texture was made by EBSD measurements. The primary grain size and texture were related to the secondary structure obtained after high temperature final annealing. The heat treatments for grain growth led to an increase in the mean grain size by 1.2 to 3 times, depending on the stability of MnS particles distribution. The increase of the primary grain size increased the core loss and decreased the magnetic induction of the fully processed material.
Keywords: silicon steel, grain growth, texture
1. Introduction
Fe-3%Si sheet, with a sharp texture {110}<001>, is widely used in the manufacture of transformers cores. This texture, also called the Goss texture, is responsible for the remarkable magnetic properties of this material in the rolling direction. The conventional (CGO-conventional Grain Oriented) and high permeability (HGO) 3%Si steel present a deviation from the ideal Goss texture of 7 and 3°, respectively1. The magnetic induction measured at 800 A/m (B8) correlates well with the orientation degree of Goss texture2. The typical B
8 results of CGO and HGO steels are 1840 and 1930 mT, respectively3.
The Goss texture of grain oriented silicon steel is obtained in the final high temperature annealing by abnormal grain growth or secondary recrystallization from a recrystallized matrix , named primary matrix, where the normal grain growth is inhibited by a dispersion of second phase particles4.
The mechanism of abnormal grain growth in silicon steel, or secondary recrystallization, remains not clearly understood. At the present, there are two models based on special grain boundaries properties5. The first one suggests that low energy coincidence site lattice boundaries (CSL) are responsible for the growth of Goss6,7. According to this model, the Goss grain orientation has the highest probability of forming CSL boundaries with neighboring grains in the primary matrix. On final annealing the pinning force performed by the particles in these boundaries will be less strong than on the random ones. They will migrate earlier, allowing Goss oriented grains to grow at lower temperature than other orientations or, in other
words, with less dissolution of the inhibitor particles. Taking into account this model, some works suggests that CSL Σ9 and CSL Σ5 boundaries play an important role in
growth selection of Goss grains in HI-B and CGO steels, respectively6-8. The second model is based on the assumption that the high mobility is a feature of the so called “high energy” (HE) boundaries defined as boundaries between grains misoriented by the angle of 20 to 45°[3,9]. In the same way, the advantage of the Goss grains would come from the fact that they have the highest probability of forming HE boundaries with neighboring grains in the primary matrix. The two models recognize the importance of the particles: the selective pinning is employed in the CSL model and the preferential particle coarsening is used in the HE boundaries model. Many works have pointed out the weak points of both models as shown on the critical review of Morawiec5. Thus, none of the models is acceptable as a full explanation of the phenomenon.
Although there is no clear understanding of the mechanism of abnormal grain growth, it is generally agreed that the main factors that determine the abnormal grain growth in grain oriented silicon steel are:
a) provision of a suitable grain growth inhibitor that must be present during the high temperature final anneal; b) obtaining an adequate primary texture containing the
nuclei for secondary recrystallization by an adequate cold rolling and annealing programme10-11.
in a continuous hot rolling operation or during a controlled cooling in a reversible hot rolling mill. The cold rolling to the final thickness is done in two stages with an intermediate annealing between them. The primary recrystallization and decarburization annealing is carried out at 840 °C in a wet hydrogen-nitrogen atmosphere and after that the final annealing is carried out at 1200 °C in dry H2. The secondary recrystallization starts around 860 °C during the heating stage of the final annealing. In this step, there is a selective growth of grains with sharp Goss texture, consuming the other matrix grains. As temperature increases in the final annealing, the MnS particles are dissolved and adsorbed in the coating formed on the steel surface10-13.
The desired {110}<001> orientation first appears during the hot rolling as a friction-induced shear texture at and near surface. In the normal course of events it would be largely lost during cold rolling but appears again in the primary matrix after the primary recrystallization and decarburization annealing12.
The structure produced by primary recrystallization and decarburization is fine (grain size around 10 µm) and shows
a diffuse texture in which the Goss component is weak. The typical primary texture presents eta and gamma fibres stronger than alpha fibre8,14-16. Some works have discussed the main variations which take place in the primary matrix during the heating step in the final annealing, before secondary recrystallization temperature is achieved. It has been shown that a small grain growth in this step leads to a final product with an excellent alignment of Goss grains and with a remarkable magnetic properties17.
The aim of this study is to investigate the effect of low temperature annealing on the primary and secondary structures and on the magnetic properties of a 3%Si steel.
2. Experimental
Samples were taken from coils (0.27 mm thick) after primary recrystallization and decarburization process, which was carried out at 840 °C during 60 seconds in a wet hydrogen-nitrogen atmosphere. Samples were taken from 3 coils from different heats with the chemical composition in the range of 3.1-3.2%Si, 0.05-0.06%Mn and 0.025-0.035%S. The samples were named A, B and C. The ratio Mn/S was about 1.7 in sample A and around 2 in samples B and C. The carbon content was lower than 0.002%.
The samples A, B and C (100 × 30 × 0.27 mm) were laboratory annealed in the range 825-845 °C during 5, 15, 25, 40 and 70 hours in an atmosphere of 50%Ar-50%H2, in order to investigate normal grain growth. To avoid sticking of one sample to the other, magnesia powder was used as annealing separator on the samples surfaces before annealing at 825 and 835 °C and magnesia slurry before annealing at 845 °C. After the heat treatments for grain growth the samples were scrubbed to remove the magnesia, and then coated with 10% magnesia slurry and final annealed for 15 hours at 1200 °C in an atmosphere of H2.
The electron backscattering diffraction EBSD (TSL equipment) technique in an SEM (Philips) was employed to determine the grain size of samples A, B and C and the microtextures of samples A and B. The main samples
were characterized before and after the heat treatments for grain growth. The EBSD linescans were used to obtain the mean linear intercept distance (MLI) across a grain on a plane section. The mean linear intercepts were measured in the longitudinal and transversal directions18. The grains were reconstructed considering high angle grain boundaries (≥15°). The size of the minimum intercept was fixed at 3 µm. About 700 intercepts were recorded in samples
as decarburized. Error at 95% of confidence for mean grain size was calculated using the pooled standard deviation and Student’s t Distribution19. Diffraction patterns of samples A and B were obtained from a grid of points covering a selected region (through-thickness × 5 mm length in the rolling direction) with a 3.5 µm step size. The total number of grains
in the initial microstructures (decarburized samples) was about 8700. The orientation distribution was obtained and was displayed as ODFs (Orientation distribution function) in Euler space. The volume fraction of the main texture components (defined as orientations within 15° of the ideal) was calculated.
The magnetic properties were measured by single sheet tester (30 mm width, 100 mm length) in the rolling direction. Core loss at low induction was measured before and after the heat treatments to evaluate grain growth by an indirect way20. The samples that presented the most significant core loss variation at low induction were selected for the study of grain size and texture by EBSD. The core loss of the fully processed samples (after final annealing) was measured at 1.7 T/60 Hz and the magnetic induction at 800 A/m (B8). After magnetic tests, samples were etched with hydrochloric acid in order to remove the surface coating and make it possible to evaluate the secondary structure.
3. Results
3.1.
Core loss variation at 1.0 T/50 Hz with the
heat treatments for grain growth
Figure 1a shows the core loss variation with temperature for a soaking time of 25 hours. Sample A presented the lowest core loss variations after the heat treatments at 825 and 835 °C. The increase in temperature to 845 °C changed the behavior of the sample A that presented higher core loss decrease than samples B and C: 1.7 W.kg–1 vs. 1.4 and 1.1 W.kg–1, respectively. Figure 1b shows the effect of time at 825 °C. The core loss decreased linearly with time above 15 hours in sample A and above 5 hours in samples B and C. In all the conditions, sample A presented the lowest core loss variation. The core loss presented higher variation with temperature increase than with time increase.
3.2.
Primary grain size
Figure 2 summarizes the grain sizes of samples A, B and C after decarburization and after grain growth at 825, 835 and 845 °C for 25 hours. After decarburization, samples A and C presented a mean grain size of about 11 µm while
account the error at 95% confidence for mean grain size. The grain growth of samples B and C was higher than the grain growth of sample A. Sample B had its average grain size increased by a factor of 1.6 after annealing at 825 and 835 °C and by a factor of around 3 after annealing at 845 °C. Sample C had its mean grain size increased by a factor of 2 after annealing at 825 °C and smaller grain growth at 835 and 845 °C.
Figure 3 shows that samples A, B and C presented a monomodal grain size distribution after decarburization (DC) and kept this kind of distribution after annealing at 825 and 835 °C21. Figure 3a shows that sample A presented a subtle change in the distribution in the form of a slight narrowing
in both temperatures. This change seems to have resulted from the loss of some of the smaller grains and some gain in the number of grains larger than 15 µm. In both cases, the
annealing has not led to an increase in the maximum grain size. Sample B (Figure 3b) showed an opposite behavior at 825 and 835 °C. The grain growth promoted an increase in the width of the distribution and increased the maximum grain size by a factor around 3. After 845 °C, sample B presented a bimodal grain size distribution, which can not be related to a homogeneous normal grain growth, while sample C kept a monomodal distribution. There has been a disappearance of the smallest grain in the material and a considerable growth of a small percentage of the largest grains in the grain growth process of sample B at 845 °C. In the same condition, sample A presented a typical cross section microstructure of a discontinuous grain growth process, named abnormal grain growth: single large secondary grains which occupied the full thickness of the steel sheet (270 µm) and elongated strongly to the rolling
direction (about 1500 µm) with a small island of primary
matrix between them21,22. The average grain size diameter of the remained primary matrix was about 14 µm, taking into
account the metallographic optical measurements. The grain size of samples B and C annealed at 825 °C for 70 hours and at 845 °C for 40 hours was measured. In the first condition, samples A and B presented an increase in the mean grain size by a factor of 1.7 and 1.8, respectively. Sample C did not present a significant increase in the mean grain size with the increase of time from 25 to 70 hours at 825 °C, but it increased by a factor of 2.4 after annealing at 845 °C for 40 hours. The average grain size of sample B was similar after annealing at 845 °C for 25 and 40 hours.
Figures 4a and 4b show that samples A and B presented different grain growth kinetics at 825 °C and 1 and 1/3 as a time exponent for grain growth, respectively23.
3.3.
Core loss variation at low induction as a
function of grain size ratio
Figure 5 shows the magnetic core loss variation at 1 T/50 Hz as a function of the ratio between the average grain size after the heat treatments (G) and the average grain size of decarburized samples (G0). The core loss decrease around 0.3 W.kg–1 was assigned to shearing stress relief in the samples used in the magnetic tests and related to the unitary ratio24. The core loss variation increased as the ratio G/G0 increased20. Samples A, B and C presented a grain growth lower than 2 times the initial grain size and a core loss decrease lower than 1 W.kg–1 after the annealing at 825 and 835 °C for 25 hours. The temperature increase to 845 °C or the time increase to 40-70 hours promoted a core loss decrease between 1 and 1.5 W.kg–1 that can be related to a grain growth from 2 to 3 times the initial grain size. Core loss decrease above 1.5 W.kg–1 can be related to an abnormal grain growth. Sample A presented the higher core loss variation at 845 °C due to an abnormal grain growth.
3.4.
Primary texture
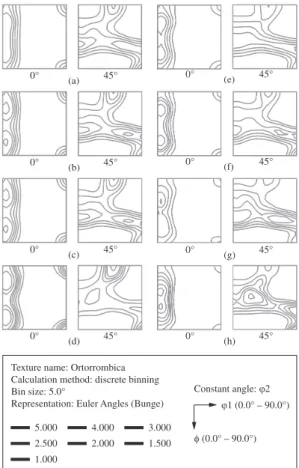
The grain growth changed significantly the primary matrix texture. Figure 6 shows the ϕ2 = 0 e ϕ2 = 45° ODF sections,
Bunge notation, obtained by EBSD after decarburization and Figure 1. Core loss variation at 1 T/50 Hz with the heat treatments
for grain growth: a) as a function of the annealing temperature; and b) as a function of the annealing time.
after grain growth at 825, 835 and 845 °C for 25 hours for samples A and B. Only primary grains were considered in the texture of sample A annealed at 845 °C.
The decarburized sample A presented the typical texture of CGO material, as follows: 28.4% eta, 27.3% gamma and 23.5% alpha8,14-16. The decarburized sample B presented gamma fibre (28.4%) stronger than alpha and eta fibres (26.5%). The grain growth of sample A led to an increase in the eta fibre with gamma fibre constant at 825 °C and decreasing at 835 and 845 °C. Sample B showed a different behavior mainly concerning gamma fibre which presented a slight increase at 825 °C and kept this tendency at 835 and 845 °C.
Taking into account the volume fraction of the main texture components of eta, gamma and alpha fibres, as decarburized samples A and B, can be described as follows: Goss around 6-7%, cube around 5-6%, {130}<001> and {120}<001> around 14-15%, {111}<1-10> and {111}<1-21> around 10-11% and {100]<011> around 1-1.5%16.
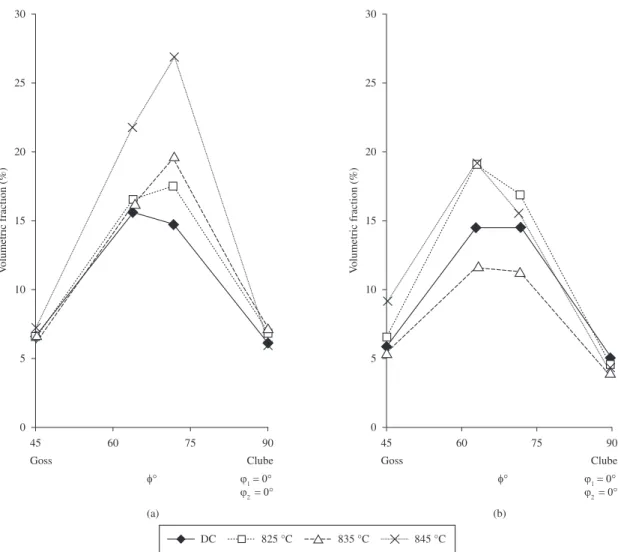
Figure 7 shows the volume fraction of the main texture components along eta fibre before and after grain growth. Sample A mainly increased {130}<001> and cube after annealing at 825 °C and kept this tendency as temperature increased, with a slight Goss component change. See Figure 7a. In gamma fibre, sample A increased {111}<1-10> Figure 3. Grain size distribution after decarburization and after grain growth at 825, 835 and 845 °C for the: a) sample A; b) sample B; and c) sample C.
up to almost 12% after annealing at 825 °C and decreased this texture component and {111}<1-21> to 8-9% at 845 °C. Sample B showed a different texture evolution: increased more {120}<001> than {130}<001>, decreased cube (Figure 7b) and increased {111}<1-10> or {111}<11-2>.
3.5.
Magnetic properties and secondary structure
after final annealing
Table 1 shows the magnetic properties after final annealing of samples of decarburized samples (DC) and of samples annealed at 825 °C. Decarburized sample A presented better magnetic properties than as decarburized samples B and C. The grain growth deteriorated the magnetic properties of the material. B8 results show that the increase of primary grain size led to secondary grains with less sharp Goss texture in sample A and suppressed the abnormal grain growth in samples B and C.
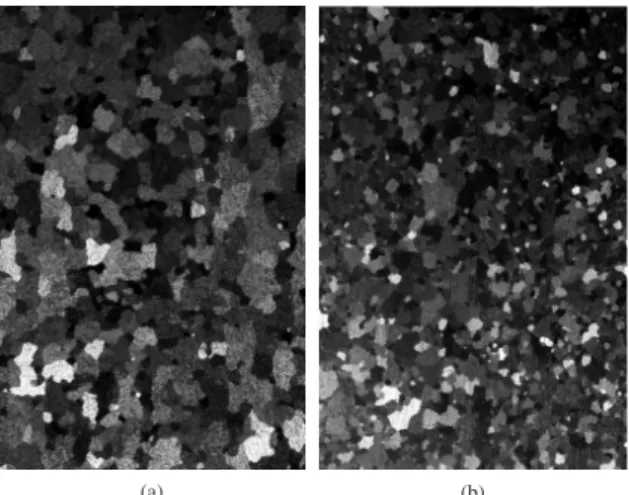
Secondary grains were observed only in samples with B8 equal or higher than 1780 mT. The heat treatments of sample A resulted in smaller secondary grain size than the ones obtained from the as decarburized sample as shown Figures 8a and 8b.
4. Discussion
Primary matrix of sample A presented the following results:
• magneticcorelossdecreasebetween0.5and0.8W.kg–1 at 1 T/50 Hz related to a normal grain growth from 1.2 to 1.7 times the initial grain size;
• smaller normal grain growth during the heat
treatments at 825, 835 and 845 °C when compared to samples B and C;
• slowergraingrowthkinetics;
• graingrowthstrengthenedetaibrewithgammaibre
almost constant at 825 °C and decreasing at 835 and 845 °C. In the same conditions, sample B presented an increase of gamma fibre.
• normal grain growth had a harmful effect on the
secondary recrystallization: the Goss texture deviation increased and consequently reduced B8. Normal grain growth in the samples B and C suppressed the secondary recrystallization;
• bettermagneticpropertiesafterinalannealingofthe
decarburized samples.
The fully processed sample A showed a typical B8 result (CGO), and samples B e C showed B8 results very close to the minimum guaranteed by CGO manufacturers (B8≥ 1780 mT). Sample A presented a ratio Mn/S lower than samples B and C, but this difference should not have affected the magnetic results. Previous works have shown that the magnetic induction depends mainly on the hot rolling operation. In this kind of material, the dispersion of MnS precipitates is obtained during a controlled cooling of the strip in a reverse hot rolling operation. Probably, Figure 5. Core loss variation at 1 T/50 Hz with grain size ratio G/G0.
Figure 6. ϕ2 = 0 e ϕ2 = 45° ODF sections as decarburized (DC)
small differences in the cooling rates during the hot rolled process led to a more suitable dispersion of MnS particles in sample A, and a very fine one in samples B and C. The smaller particles, with larger surface energy per unit volume, may tend to reduce in number or coalesce at a faster rate13,25. This hypothesis is consistent with the results of grain growth kinetics (Figures 4a and 4b) that also suggests a higher rate of coalescence of MnS particles in sample B. The good linear correlation between grain size and time cubic root (t1/3) suggests that the MnS particles growth is more controlled by volume diffusion than by diffusion along grain boundaries23.
The normal grain growth observed in the present work could be compared with that observed in CGO samples during the heating stage of the final annealing. Lee and Szpunar8 reported a grain growth of about 1.1 times, a faster growth of {111}<1-10> and/or {100}<001> grains prior to secondary recrystalization and a consumption of these components after the secondary recrystallization started. Alcântara and Cunha15 reported that grains with orientations close to {100}<001> and {111}<1-10> present CSL Σ5
boundaries with Goss grains and are consumed during abnormal grain growth.
Figure 7. The volume fraction of the main orientation along eta fibre in the primary matrix A and B after decarburization (DC) and after grain growth at 825, 835 and 845 °C for 25 hours. a) sample A, and b) sample B.
Table 1. Core loss at 1.7 T/60 Hz and B8 after final annealing of samples as decarburized and as decarburized and annealed for grain growth.
Samples Sample A Sample B Sample C
Core loss (W.kg–1)
B8 (mT)
Core loss (W.kg–1)
B8 (mT)
Core loss (W.kg–1)
B8 (mT)
As decarburized (DC) 1.30 1854 1.46 1815 1.49 1792
Sample A presented a normal grain growth a little bit higher than that observed in the final annealing and a texture evolution with some similarities as for example the increasing of {111}<1-10> and/or {100}<001> components after annealing at 825 °C/25 hours. The main difference seems to have been the faster growing of {130}<001> grains not observed during the final annealing. Previous works suggest that the increase of {130}<001> component in the primary matrix can be related with a less sharp Goss texture15.
The grain growth in sample B suppressed the secondary recrystallization. The texture evolution suggests that this kind of sample presented a drastic drop in inhibition, which allowed the growth of grains with orientations non-favorable to the abnormal grain growth at the expense of the favorable ones, as for example {100}<001>. The hypothesis to be considered is that sample B lost the inhibition in the annealing in the range 825-845 °C and because of that, it was not able to promote the secondary recrystallization.
5. Conclusions
The heat treatments in the range 825-845 °C of decarburized Fe-3%Si samples promoted a significant growth of primary grain size. The grain growth rate was related to the coarsening rate of MnS particles.
The sample with more stable inhibition annealed at 825 °C for 25 hours presented an increase in mean grain size by 1.2 times, a small narrowing of the initial grain size distribution and strengthened eta fibre with gamma fibre almost constant. Cube, {130}<001> and {111}<1-10> grains grew faster than the others. The texture evolution with annealing temperature promoted an increase of the volume fraction of cube grains that plays an important role on the secondary recrystallization.
The decarburized sample with more stable inhibition presented B8 of 1854 mT after final annealing. The normal grain growth in this kind of sample led to an increase of Goss texture deviation and consequently reduced B8. The increase of the volume fraction of {130}<001> with grain growth may have had a harmful effect on the abnormal grain growth.
The decarburized sample with less stable inhibition presented B8 of 1815 mT after final annealing. The annealing in the range 825-845 °C of this kind of sample led to an increase in the mean grain size by 1.6 to 3 times and mainly strengthened gamma fibre. The texture evolution suggests that this kind of sample presented a drastic drop in inhibition, which allowed the growth of grains with orientations non-favorable to the abnormal grain growth at the expense of the favorable ones, as for example {100}<001>. The normal grain growth suppressed the secondary recrystallization.
Magnetic core loss measurements at 1 T/50 Hz can be used to evaluate the grain growth. Core loss decreasing between 0.3 and 1.5 W.kg–1 can be related to a normal grain growth, and higher than 1.5 W.kg–1 to an abnormal growth. The material with a more stable inhibition should present a magnetic core loss decrease around 0.5 W.kg–1 after annealing at 825 °C for 25 hours. The material with a less stable inhibition should present a core loss decrease around 0.7 W.kg–1 in the same conditions.
Figure 8. Secondary structure after final annealing of sample A (a) DC, (b) DC and annealed at 825 °C for 25 hours.
References
1. Taguchi S, Sakakura A, Matsumoto F, Takashima K and Kuroki K. The development of grain-oriented silicon steel with high permeability. Journal of Magnetism and Magnetic Materials. 1976; 2:121-131. http://dx.doi.org/10.1016/0304-8853(75)90114-6
2. Littmann MF. Iron and silicon-iron alloys. IEEE Transactions on Magnetics. 1970; 7(1):48-60. http://dx.doi.org/10.1109/ TMAG.1971.1066998
3. Hayakawa Y and Szpunar JA. The role of grain boundary character distribution in secondary recrystallization of electrical steels. Acta Materialia. 1997; 45(3):1285-1295. http://dx.doi. org/10.1016/S1359-6454(96)00251-0
4. Matsuo M. Texture Control in the Production of Grain Oriented Silicon Steels. ISIJ International. 1979; 29(10):809-827. http://dx.doi.org/10.2355/isijinternational.29.809
5. Morawiec A. Grain misorientations in theories of abnormal grain growth in silicon steel. Scripta Materialia. 2000; 43:275-278. http://dx.doi.org/10.1016/S1359-6462(00)00403-6
6. Shimizu R, Harase J and Dingley DJ. Prediction of secondary recrystallization texture in Fe-3% Si by three-dimensional texture analysis. Acta Metallurgica et Materialia. 1990; 38(6):973-978. http://dx.doi.org/10.1016/0956-7151(90)90169-H
7. Yoshitomi Y, Ushigami Y, Harase J, Nakayama T, Masui H and Takahashi N. Coincidence grain boundary and role of primary recrystallized grain growth on secondary recrystallization texture evolution in Fe-3%Si alloy. Acta Metallurgica et Materialia. 1994; 42(8):2593-2602. http://dx.doi.org/10.1016/0956-7151(94)90200-3
8. Lee KT and Szpunar JÁ. The role of special grain boundaries during the grain growth in Fe-3%Si. Canadian Metallurgical Quartely. 1995; 34(3):257-263. http://dx.doi.org/10.1016/0008-4433(95)00011-L
10. Konno T, Suga y, Nakamura M and Komtsu H. Annealing Separator Used in the Finishing Annealing Step for Producing Grain Oriented Silicon Steel Sheet. US Patent 4,632,708. Nippon Steel Corporation; 1986. Int. Cl4. H01F1/04. 11. Cunha MA. Structure and Magnetic Properties of Si-Fe
Ribbons produced by rapid solidification. [Tese]. Leeds: Leeds University; 1988. p. 26-27.
12. Humphreys FJ and Hatherly M. Recrystallization and Related Annealing Phenomena. Oxford: Ed. Elsevier Ltd.; 2004. p. 489-491.
13. Cunha MA and Cesar MGMM. Forsterite film formation and grain growth in 3% Si steel. IEEE Transactions on Magnetics. 1994; 30(6):4890-4892. http://dx.doi.org/10.1109/20.334256 14. Abbruzzese G and Barisoni M. Effect of the initial texture
on the secondary recrystallization in grain oriented silicon iron. Journal of Magnetism and Magnetic Materials. 1986; 5:1621-1622. http://dx.doi.org/10.1016/0304-8853(86)90950-9 15. Alcântara FL and Cunha MA. Estudo da recristalização
secundária do aço silíco de grão orientado. Tecnologia em Metalurgia e Materiais. 2006; 2(3):32-36. http://dx.doi. org/10.4322/tmm.00203007
16. Cesar MGMM, Alcântara FL, Paolinelli SC and Cota AB. Recristalização Primária de um aço 3% Si sob alta tensão de tração. In: Proceedings of the 64th Annual Conference on ABM; 2009; Belo Horizonte. ABM; 2009.
17. Park JY, Han KS, Woo JS, Chang SK, Rajmohan N and Szpunar JA. Influence of primary annealing condition on texture development in grain oriented electrical steels. Acta Materialia. 2002; 50:1825-1834. PMid:10460682. http://dx.doi.org/10.1016/S1359-6454(02)00034-4
18. Humphreys FJ. Quantitative metallography by electron backscattered diffraction. Journal of Microscospy. 1999; 195:170-185. http://dx.doi.org/10.1046/j.1365-2818.1999.00578.x 19. Box GEP, Hunter WG and Hunter JS. Statistics for
Experimenters. John Wiley & Sons; 1978.
20. Cunha MA and Paolinelli SC. Effect of the annealing temperature on the structure and magnetic properties of 3% Si non-oriented steel. Journal of Magnetism and Magnetic Materials. 2003; 254:379-381. http://dx.doi.org/10.1016/ S0304-8853(02)00912-5
21. Humphreys FJ. and Hatherly M. Recrystallization and Related Annealing Phenomena. Oxford: Ed. Elsevier Ltd.; 2004. p. 334-335.
22. Kumano T, Haratani T and Ushigami Y. Influence of Primary Recrystallization Texture through Thickness to Secondary Texture on Grain Oriented Silicon Steel. ISIJ International. 2003; 43(3):400-409. http://dx.doi.org/10.2355/ isijinternational.43.400
23. Humphreys FJ. and Hatherly M. Recrystallization and Related Annealing Phenomena. Oxford: Ed. Elsevier Ltd.; 2004. p. 363-364.
24. Paolinelli SC and Cunha MA. Effect of stress relief annealing temperature and atmosphere on the magnetic properties of silicon steel. Journal of Magnetism and Magnetic Materials. 2006; e599-e601. http://dx.doi.org/10.1016/j. jmmm.2006.02.187