425 Cerâmica 60 (2014) 425-428
INTRODUCTION
Among the family of II-VI group inorganic semiconductor nanomaterials like CdS, ZnS, CdSe, ZnSe are proved to be versatile materials because of their applications in optoelectronic devices due to large variation of band gap as a function of particle size. Zinc Sulide (ZnS) is one of the irst semiconductor discovered [1] and it has traditionally shown remarkable fundamental properties versatility and a promise for novel diverse applications, including light-emitting diodes (LEDs), electroluminescence, lat panel displays, infrared windows, sensors, lasers, etc. Eficient doping of rare-earth ions into II-VI semiconductor host is not favorable compared to the transition metals. In view of this, transition metal doped ZnS, like ZnS: Mn [2], ZnS:Cu [3], ZnS:Co [4] and ZnS:Ni [5] have been widely investigated. However, surprisingly, inspite of both applied and academic interest, Cr doped ZnS has been least studied. In fact to the best of our knowledge, there are only a few reports [6-8] on
Cr doped ZnS and all these reports are on ZnS: Cr prepared by physical methods only. Particularly doping of ZnS with Cr is attractive because Cr is an important transition metal and it has ionic radius (0.63 Å) closer to that of Zn2 (0.74 Å) which means that Cr can easily substitute Zn2+ in the host lattice. Based on density- function calculations [9], Cr is theoretically proposed to be a reliable dopant in ZnS.
In view of the above, Cr doped ZnS nanocrystals were synthesized by chemical co-precipitation route. XRD technique was employed to understand crystal structure. Using FTIR, chemical species were detected. Eg was estimated by UV-Vis spectra.
ExpERIMENTAL
Cr doped ZnS with chemical composition Zn1-xCrxS (x = 0% and 10%) were synthesized by chemical co-precipitation route. All chemicals were used of analytical grade. Methanol was used as solvent. The starting materials
Crystallographic and optical studies on Cr doped ZnS nanocrystals
(Estudos ópticos e cristalográicos de ZnS dopado com Cr)
M. R. Bodke1, Y. Purushotham2, B. N. Dole1*
1Advanced Materials Research Laboratory, Department of Physics, Dr. Babasaheb Ambedkar Marathwada
University, Aurangabad-431004, India
2Centre for Materials for Electronics and Technology, IDA Phase III, HCL (PO), Cherlapally,
Hyderabad-500051, India *[email protected]
Abstract
Chromium doped ZnS nanocrystals with pure and 10% compositions were synthesized by chemical co-precipitation route. Samples were characterized by X-ray diffraction (XRD) technique, Fourier transforms infrared spectroscopy (FTIR) and UV-Visible spectrometer. Lattice parameter ‘a’ decreases and grain size increases with increasing Cr concentration. XRD study shows that both the samples have cubic structure. Grain size increases due to ionic radius. The functional groups and chemical species of Cr doped
ZnO samples were determined using FTIR data. UV-Vis study revealed that red shift is clearly observed in absorption band.Surface
morphology of pure and 10% Cr doped samples was investigated by SEM technique and it is conirmed that images exibit cubic form of the samples. Using EDS, percentage of chemical compositions of material recorded.
Keywords: ZnS, grain size, functional group, unit cell volume, red shift.
Resumo
Foram sintetizados nanocristais de ZnS puros e dopados com 10% cromo pela rota química de co-precipitação. As amostras foram caracterizadas pela técnica de difração de raios X (DRX), espectroscopia de infravermelho com transformada de Fourier (FTIR)
e espectrometria UV-Visível. O parâmetro de rede ‘a’ diminui e o tamanho de grão aumenta com o aumento da concentração de
cromo. O estudo de difração de raios X mostra que ambas amostras tem estrutura cúbica. O tamanho de grão aumenta devido ao raio iônico. Os grupos funcionais e as espécies químicas de amostras de ZnS dopadas com cromo foram determinadas com os dados de FTIR. O estudo de UV-Vis revelou que o deslocamento para o vermelho observado na banda de absorção. A morfologia da superfície de amostras puras e dopadas com 10% de cromo foi investigada por microscopia eletrônica de varredura e foi
426 M. R. Bodke et al. / Cerâmica 60 (2014) 425-428
zinc nitrate, chromium nitrate and sodium sulide. The appropriate amounts of zinc nitrate and chromium nitrate were dissolved separately in 100 mL methanol and stirred at room temperature for 2 h. Chromium nitrate solution was added into zinc nitrate and stirred for 20 min. A high alkaline medium (pH-10) was maintained by adding sodium sulide solution into mixed solution of zinc nitrate and chromium nitrate drop wise, the light sky-blue coloured precipitate was obtained, the colour of the precipitate becomes dark for 10% Cr concentration. The precipitate was stirred for 2 h again to get homogeneous particle size. The precipitate was collected and washed several times by DI water and methanol. Finally to get Cr doped ZnS nanocystals, the precipitate was dried in the oven at 50 oC for 4 h. The X-ray diffraction patterns of undoped and 10% Cr doped ZnS nanocrystals were recorded using Cukα radiation (Bruker, λ=1.5406 Å) with 2θ ranging 20-80o. FTIR (Jasco FTIR, Japan) spectra were recorded at room temperature. The UV-Vis measurements were done with UV-Vis spectrometer (Jasco UV-VIS-NIR spectrophotometer V-670) in the wavelength range of 200 nm to 1000 nm.
RESULTS AND DISCUSSION
Diffraction study
XRD patterns of Cr doped ZnS nanocrystals are as shown in Fig 1. The broadening of diffraction conirmed that the crystallites were nanosized. The diffraction peaks corresponds to (111), (220) and (311) planes are in good agreement with the standard diffraction peaks (JCPDS 00-001-0792) of cubic structure and also indicates that the Cr2+ ions substituted into Zn2+ site has no effect on the crystal structure. No additional peaks were observed. The lattice parameter, volume cell, X-ray density, grain size and % of crystallinity were determined using XRD data. Grain size of the nanoparticles determined by the Debye-Scherrer’s equation D=Kl/bcosq, where K=0.09 [12] and their values are depicted in Table I.
Reddy et al [10] reported that the diffraction peak of
(111) is slightly shifted to higher angles as the concentration increases. Rahdar et al [11] reported that the Cr doped ZnS
nanocystals synthesized by co-precipitation route was wurtzite (hexagonal) structure. In the present investigation the (111) diffraction peak is also shifted to higher angle for 10% Cr doped ZnS in comparison to pure ZnS samples. It may be due to the small ionic radii of Cr3+ (0.63 Å) compared
to that of Zn2+ (0.74 Å), which have entered into ZnS. Our XRD data is in good agreement with the diffraction data of cubical structure and the cell parameter ‘a’ is very close to the reported value in JCPDS 00-001-0792 data. From Table I we attribute that the grain size and the X-ray density are more and lattice parameter ‘a’, volume of unit cell and % of crystallinity are less for Cr doped ZnS than in undoped nanocystals.
Estimation of chemical species
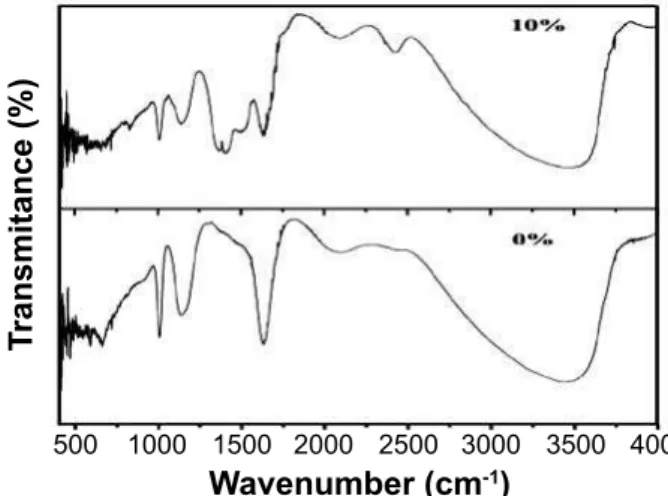
FTIR absorption spectra of Cr doped ZnO nanocrystals are shown in Fig 2.
The FTIR spectra of the pure and 10% Cr doped ZnS nanocystals samples of present investigations are in good agreement with the reported values [13]. One can observe that broad bands appeared around 3440 cm-1 and 3470 cm-1 typically due to O-H stretching. The additional weak bands and shoulders that are observed at 1631 cm-1 and 1639 cm-1 may be due to microstructural formation of the samples. The C-H bending of methylene in ME is observed at the 1407 cm-1
Figure 1: XRD pattern of Zn1-xCrxS nanocystals.
[Figura 1: Difratograma de raios X de cristais de Zn1-xCrxS.]
20
2q (degree)
In
te
n
s
ty
40 70
30 50 60 80
Conc. x (%)
‘a’ (Å)
Volume (Å)3
X-ray density (gm/cm3)
Grain size (nm)
% of crystallinity
0 5.3913 156.151 1.0366 3.853 57.4
10 5.3423 152.475 1.0470 3.886 56.6
Table I - Lattice parameter, volume cell, X-ray diffraction density, grain size and % of crystallinity of Zn1-xCrxS. [Tabela I - Parâmetro de rede, volume da célula, densidade por difração de raios X, tamanho de grão e % de cristalinidade de Zn1-xCrxS.
Figure 2: FTIR spectra of Zn1-xCrxS nanocrystals. [Figura 2: Espectros FTIR de cristais de Zn1-xCrxS.]
500 1000 1500 2000 2500 3000 3500 4000
Wavenumber (cm-1)
T
ra
n
s
m
ita
n
c
e
(%
427 M. R. Bodke et al. / Cerâmica 60 (2014) 425-428
band. The spectra at 1135 cm-1 is due to IR characterization size frequency of inorganic ions. The bands at 1008 cm-1 and 1010 cm-1 are due to C-O stretching. The spectra at 661 cm-1 and 668 cm -1 are ZnS bands that correspond to sulide. Two more bands are observed in the FTIR spectra for 10% Cr doped ZnS nanocrystals sample at 2103 cm-1 and 2433 cm-1 and are assigned to the CO2 mode, it may be due to the CO2 absorbed from the atmosphere. From this study one can say that the substitutional effect of Cr concentration takes place in the ZnS nanocrystals synthesized by chemical co-precipitation route.
Optical Properties
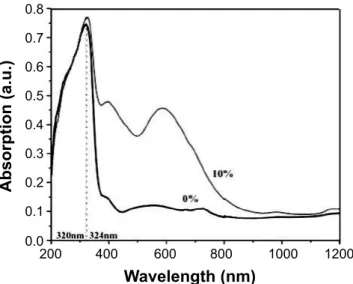
The Tauc plot was employed to determine the energy band of the samples. The UV-Vis study of the samples was carried out with a view to explore their optical properties. The UV-Vis spectra of the samples are shown in Fig 3. The
absorption bands were 320 nm and 324 nm for pure and Cr doped ZnS respectively. The band-edge emissions show blue shift for pure to Cr doped ZnS nanocrystals. The energy band gap was calculated from the Tauc plots of photon energy (E = hn) versus (αhn)2. It was reported that the band gap increase with increasing Cr concentration and is attributed to size quantization effect due to the smaller size of the particles [10]. In the present work, the band gap from Tauc plots of pure ZnS and 10% Cr doped ZnS samples were 3.36 eV and 3.16 eV respectively. It is conirmed that the band gap of pure ZnS is higher than that of 10% Cr doped ZnS nanocystal and is attributed to the s-d and p interactions and the quantum coninement effect. Fig. 4 shows the red shift of the band gap, which conirms the uniform substitution of Cr ions into the ZnS lattice.
Surface morphology
SEM images of pure and 10% Cr doped ZnS were recorded and are shown in Fig. 5a and 5b, respectively. It is conirmed that pure and 10% Cr doped ZnS samples exibit cubic shape but the pure ZnS sample has more agglomeration than Cr doped ZnS sample. It means that Cr doping effect is clearly observed.
EDS Study
Energy dispersive spectra (EDS) were recorded at room tempreture in the range of 0-20 keV with the count rate of 7277 cps for the chemical composition analysis. Energy
Figure 3: UV-Vis absorption spectra of Zn1-xCrxS nanocrystals.
[Figure 3: Espectros de absorção óptica UV-Vis de nanocristais de Zn1-xCrxS.]
0.8
0.4 0.6
0.2 0.7
0.3 0.5
0.1
0.0 200
Wavelength (nm)
A
b
s
o
rp
ti
o
n
(a
.u
.)
600 1000
400 800 1200
Figure 4: Tauc plots of photon energy for Zn1-xCrxS nanocrystals. [Figura 4: Gráicos de Tauc da energia de fótons de nanocristais de Zn1-xCrxS.]
1.0 2.0 3.0 4.0
hn (eV)
(
a
h
n
)
2
3.5
2.5
1.5
0.5 3.0
2.0
1.0
0.0
1.5 2.5 3.5
Figure 5: SEM images of (a) pure ZnS nanoparticles and (b) 10% Cr doped ZnS nanocrystals.
428 M. R. Bodke et al. / Cerâmica 60 (2014) 425-428
dispersive spectra of the samples are shown in Figs. 6a and 6b. It is conirmed that there are no extra traces. It is intervened that the as prepared samples are highly pure. From our EDS study it is acknowledged that exact percentage of chemical compositions are highly matchable with standard results. This study revels accurate information about the
chemical compositions and their percentage are summarized in Table II.
CONCLUSIONS
Pure and 10% Cr doped ZnS nanocrystals were synthesized by the co-precipitation route. Lattice parameters were determined using X-ray diffraction data and it is found that the samples show cubic structure. The average grain size is in the range of 3.85 and 3.89 nm. The chemical groups and the chemical bonding for pure and Cr-doped ZnS samples were conirmed by FTIR spectra. Reduction in Eg with enhancing Cr concentration may be owing to quantum coninement effect and the ionic radius of Cr, which is smaller than that of Zn. The surface morphology of pure and 10% Cr-doped samples was investigated and it is found that samples are cubic. Compositional percentage was detected using EDS and did not conirm the presence of any other impurity phases. It means that the as-synthesized samples are highly pure.
REFERENCES
[1] W. L. Davidson. Phys. Rev 74 (1948) 116.
[2] R. Sarkar, C. S. Tiwary, P. Kumbhakar, S. Basu, A. K. Mitra, Physica E 40 (2008) 3115.
[3] H. Zhang, Z. Wang, L. Zhang, Y. Li, J. Yuan, S. Yan, J. Mater. Sci. Lett. 21 (2002) 31.
[4] R. Sarkar, C. S. Tiwary, P. Kumbhakar, A. K. Mitra, Physica B 404 (2009) 3855.
[5] P. Yang, M. Lu, D. Xu, D. Yuan, J. Chang, G. Zhou, M. Pan, Appl. Phys. A 74 (2002) 257.
[6] D. V. Martyshkin, V. V. Fedorov, C. Kim, I. S. Moskalev, S. B. Mirov, J. Opt. 12 (2010) 024005.
[7] K. Ichino, Y. Morimoto, H. Kobayashi, Phys. Status Solidi C 3 (2006) 776.
[8] H. Nelkowski, G. Grebe, J. Lumin. 88 (2002) 1-2. [9] X. Jia, M. Qin, W. Yang, J. Phys. D 42 (2009) 235001. [10] D. A. Reddy, G. Murali, R. P. Vijayalakshmi, B. K. Reddy, Appl. Phys. A 105 (2011) 119.
[11] A. Rahdar, H. A. Eivari1, R. Sarhaddi, Ind. J. Sci.Tech. 1 (2012) 1855.
[12] P. D. Cozzoli, M. L. Curri, A. Agostiano, G. Leo, M. Lomasola, J. Phys. Chem. B 107 (2003) 4756.
[13] V. D. Mote, V. R. House, B. N. Dole, W. J. Cond. Matter. Phys. 2 (2012) 208.
(Rec. 03/04/2014, Ac. 15/05/2014) Figure 6: EDS spectra of (a) pure ZnS nanoparticles and (b) 10%
Cr doped ZnS nanocrystals.
[Figura 6: Espectros EDS de (a) nanopart[iculas de ZnS puro e (b) nanocristais de ZnS dopados com 10% Cr.]
4400
4400 2800
2800 2400
2400 1200
1200 3600
3600 2000
2000 800
800 4000
4000 3200
3200 1600
1600 400
400 0
0 0.00
KeV
KeV
C
o
u
n
ts
C
o
u
n
ts
0.00 1.00
1.00
5.00
5.00 3.00
3.00
7.00
7.00
9.00
9.00 2.00
2.00
6.00
6.00 4.00
4.00
8.00
8.00
10.00
10.00
(a)
(b)
Table II - Chemical spacies present in the pure ZnS and 10% Cr doped ZnS samples.
[Tabela II - Espécies químicas presentes em ZnS puro e em ZnS dopado com 10% Cr.]
Elements Atomic percentage
Pure ZnS Cr doped ZnS
Zn 60.27 52.94
Cr 0.08 4.94