www.scielo.br/zool
The fact that spiders are widely distributed in terrestrial ecosystems makes them efficient organisms to help elucidate biodiversity patterns (UETZ 1991, FOELIX1996, PLATNICK 1999, CAR
-DOSO 2009). In order to know and to catalogue the biodiversity
elements of a given place, however, it is necessary to conduct biodiversity surveys (DENNIS & RUGGIERO 1996). Such inventories should not be restricted to a list of species, but need to include information on systematics, ecology, and biogeography (HALFFTER et al. 2001).
Among the environments where spiders have already been inventoried, riparian forests are still largely unknown (RODRIGUES et al. 2014). These habitats have important ecosystem functions, since they are ecotones between adjacent environments and therefore harbor a diverse fauna (NAIMAN et al. 1993). Riparian
forests are peculiar: they occupy a small proportion of the hydrographic basin they belong to, are considered ecologically stable and are well defined, have high plant biomass production and support high biodiversity levels compared to other forest environments (DAVIDE & BOTELHO 1999). They are considered extremely important for plant dispersal, and as “corridors” for animal movement (NAIMAN et al. 1993, MALAVASI et al. 2004), in-cluding spiders (RAIZER et al. 2005, RODRIGUES et al. 2014). However, these corridors may be interrupted when plant formations are altered. In the past, Brazilian native riparian forests were partly substituted for large plantations of exotic trees and, very close to rivers, by agricultural endeavors, a process that has resulted in numerous forest remnants and semi-natural areas (DENNIS 1997, MALAVASI et al. 2004).
ECOLOGY
Spider species composition in the tree-shrub strata of riparian forests
and its microhabitats in southern Brazil
Everton N.L. Rodrigues
1*, Patrícia E.S. Rodrigues
2& Milton de S. Mendonça Jr
31Laboratório de Diversidade e Sistemática de Arachnida, Programa de Pós-Graduação em Biologia, Universidade
do Vale do Rio dos Sinos. Avenida Unisinos 950, 93022-000 São Leopoldo, RS, Brazil.
2Programa de Pós-Graduação em Biologia Animal, Universidade Federal do Rio Grande do Sul. Avenida Bento
Gonçalves 9500, Bloco IV, Prédio 43435, 91501-970 Porto Alegre, RS, Brazil.
3Departamento de Ecologia, Instituto de Biociências, Universidade Federal do Rio Grande do Sul. Avenida Bento
Gonçalves 9500, Bloco IV, Prédio 43422, 91501-970 Porto Alegre, RS, Brazil.
*Corresponding author. E-mail: enlrodrigues@unisinos.br
ABSTRACT. The composition of the spider fauna of riparian forests is insufficiently known. These forests, adjacent to both aquatic and terrestrial environments, are recognised as having important ecosystem functions. We compare the composition of spider assemblages of four riparian forests in different drainage basins, along with their microhabitats (edges and forest interior), in the state of Rio Grande do Sul, southern Brazil. Sampling was carried out in the riparian forests of the following rivers: Piratini, municipality of Arroio Grande; Camaquã, municipality of Cristal; Sinos, municipality of Parobé, and Maquiné, municipality of Maquiné. Two samples per season were collected in two years, by sampling the tree-shrub strata with a beating tray, following fixed transects. There were six transects per drainage basin, two per microhabitat: grassland edge, forest interior and river edge. Overall, 42,057 spiders were sampled (juveniles: 79%; adults: 21%). Among the adults (8,851 individuals), we identified 440 species. Similarity analyses (ANOSIM) indicated that the araneofauna composition of the four drainage basins differ in their quantitative (Morisita) and qualitative (Simpson) similarity indexes. There were no differences in composition among microhabitats. The composition of the Maquiné River basin was the most distinct, possibly due to a greater influence of the Atlantic forest on it and a greater dominance of the Linyphiidae Sphecozone personata (Simon, 1894) (SIMPER analysis, contribution to dissimilarity: 12.15%). Differences in spider composition on large spatial scales most likely reflect regional variations in a number of environmental factors, and result in each area having in increased importance in terms of conservation.
Understanding the composition of spider species and their distribution within riparian forests is the first step to in-creasing our knowledge on the dynamics of spider assemblages. This information may be helpful in planning environmental monitoring, and ultimately improving the conservation of these forest formations. Data on the spider fauna of the native areas of southern Brazil have increased through simple species lists and ecological studies (INDRUSIAK & KOTZIAN 1998, BONALDO &
OTT 2002, RODRIGUES 2005, SILVA & ARAÚJO 2005, OTTet al. 2006,
BONALDOet al. 2007, PODGAISKIet al. 2007, BALDISSERAet al. 2008,
RODRIGUES & MENDONÇA, 2012, RODRIGUESet al. 2014). However, there are still few studies comparing species composition among different ecosystems.
There are a number of factors determining the species composition of spider assemblages (UETZ1991, FOELIX 1996). For example, human impacts, which lead to edge effects in forests (MURCIA 1995), and changes in abiotic factors (BALDISSERA et al. 2008) may force spiders to live in a more open environment where sun light, temperature, humidity and other factors are different than the conditions they are adapted to (RODRIGUES et al. 2014). Spiders are known to be strongly influenced by hab-itat structure (UETZ 1991, GALLÉR & SCHWÉGER 2014), including vegetation structure (WU & CHENG 2012, RODRIGUES et al. 2014) and microclimatic factors (SAMU et al. 1999). In this work we compare the spider assemblages of three distinct microhabitats (edges: river edge and grassland edge; and forest interior) and four distinct drainage basins of a riparian forest of the state of Rio Grande do Sul, southern Brazil. We also give a list of the spider species found in these riparian forests.
MATERIAL AND METHODS
Sampling took place in four riparian forests on four dis-tinct drainage basins in southern Brazil, state of Rio Grande do Sul (RS) (Fig. 1). Detailed information on these basins can be found in RODRIGUES & MENDONÇA (2012). Their main characteristics are: 1) Piratini River (PR), sampling site at the municipality of Arroio Grande (31°54’06.47”S, 52°39’08.29”W), 14 m a.s.l., good state of conservation, largest continuous native forest segment in the coastal plain region, climate TE UM “humid temperate” (MALUF 2000); 2) Camaquã River (CR), sampling site at the mu-nicipality of Cristal (31°01’01.7”S, 51°56’42.0”W), 14 m a.s.l., good state of conservation, continuous forest at the centre-south part of the Coastal Plain region, climate STE UM “humid sub-temperate” (MALUF 2000); Sinos River (SR), sampling site at the municipality of Parobé (29°41’06.94”S, 50°51’05.98”W), 6-10 m a.s.l., fragmented forest in the Serra Geral slopes region, sampling site at the largest fragment available, climate ST SB “sub-humid subtropical” (MALUF2000); Maquiné River (MR), sampling site at the municipality of Maquiné (29°40’47.99”S, 50°11’20.03”W), between the Serra Geral slopes and the Coastal Plain, belongs to Atlantic forest Biosphere Reserve recognized by UNESCO, climate is ST PU “perhumid subtropical” (MALUF 2000).
Fieldwork lasted two years (August 1st, 2007 to June 6th,
2009), with two samplings per season (four seasons: spring, summer, autumn and winter) at each of the four drainage ba-sins, totaling 64 samples overall, thus covering distinct times of the year, differences in vegetation (e.g., plant phenology) and climatic variability (temperature, rainfall, river levels). To evalua-te spider fauna diversity we used six transects (approximaevalua-tely 30 m each) per sampling site, straight 4 m-wide lines, parallel to the river. These were placed in different microhabitats at each forest site: two transects at the forest edge with the river (river edge, RE); two transects at the forest interior (FI) and the latter two at the forest edge with neighboring grasslands (grassland edge, GE). Transects at the same microhabitat were placed at least 500 m far from each other. Overall, 24 transects were thus established on all forest sites.
The method employed for spider capture was the beating tray (BT), which allows access to tall herbs, small and medi-um-sized shrubs, small trees and large tree branches, along with woody vines (CODDINGTONet al. 1996, INDRUSIAK & KOTZIAN 1998,
SØRENSEN et al. 2002). On each transect, spiders were sampled for 45 min with a 70 cm x 70 cm BT with white nylon fabric, totaling 288 h of sampling. Collecting was carried out by the first and second authors.
Spiders were kept in vials and preserved in ethanol 80%. The material was identified by the first author in the Laboratório de Aracnologia and the material was deposited in the spider collection of the Museu de Ciências Naturais, in the Fundação Zoobotânica do Rio Grande do Sul, Porto Alegre, Brazil (MCN/ FZB, curator: Ricardo Ott).
The species composition of the four distinct localities and the three microhabitats were compared with separate ANOSIM tests (CLARKE & WARWICK 1994). The null hypotheses are that there are no differences in species composition in space in a larger scale, among drainage basins, and that there are no dif-ferences in space in a smaller scale, among microhabitats. Two tests were employed per factor, each with a different similarity index, one qualitative (Simpson) and one quantitative (Morisita).
With the same composition matrix we plotted two ordinations (non-metric multidimensional scaling, NMDS), one for each of the previously mentioned indexes. For each ordination we also obtained stress values, measuring the relationship between real distances, obtained with dissimilarity indexes between samples, with distances used in the NMDS.
A SIMPER (Similarity percentage) analysis was employed to evaluate which species contributed more to the dissimilarity (Bray Curtis index) among basins and microhabitats (CLARKE &
WARWICK 1994). All analyses were implemented in PAST (Pale-ontological Statistics, HAMMER & HARPER 2009).
RESULTS
Overall, 42,057 spiders were collected, representing 35 families. For the purpose of analysis, only adults were conside-red, since immature spiders are difficult to identity to species. However, immatures predominated in the inventory, represent-ing 79% of all specimens captured. The total sample contained 8,851 adult spiders (21%), representing 29 families (Appendix 1), and females were more abundant (60.8%) than males (39.2%).
Family composition among basins and microhabitats
Only juvenile spiders represented the following families in our samples: Ctenidae, Hersiliidae, Idiopidae, Lycosidae, Pisauri-dae and SegestriiPisauri-dae. Among the families that were represented by adults, Theridiidae predominated (n = 4,363 individuals, 49.3% of the total), followed by Linyphiidae (1,646, 18.6%), Salticidae (742, 8.4%), Araneidae (533, 6.1%) and Thomisidae (265, 3%), which together comprised 85% of all spiders.
The riparian forest of the Maquiné River basin had the greatest number of families (25), followed by Camaquã and Sinos (21 families each), with the Piratini River scoring only 20 families. Five families were only found at the Maquiné River (Clubionidae, Hahniidae, Gnaphosidae, Scytodiidae and Synotaxidae) and one at the Piratini River (Dictynidae). Sixteen families were shared among distinct basins. Theridiidae was the most abundant family, with more than 50% of the sampled spiders in each basin, except for the Maquiné River basin, where Linyphiidae dominated.
The family composition of adults was very similar among microhabitats, with 25 families at each edge (river and grassland) and 24 families at the forest interior. Theridiidae was again the predominant family in all microhabitats, followed by Linyphi-idae. The three microhabitats shared 22 families, with one exclusive family at each one (RE: Clubionidae, FI: Gnaphosidae, GE: Dictynidae, Appendix 1).
Species list and composition among basins and
microhabitats
Overall there were 440 spider species/morphospecies, in 168 genera. A total of 232 named species were obtained, representing 53% of all adults. The other 47% of the specimens could not be identified. They were separated into
morphospe-cies, and we believe that at least some of them might represent undescribed species (Appendix 1). Acragas nigromaculatus
(Mello-Leitão, 1922), Cylistella cuprea (Simon, 1864), Faiditus alticeps (Keyserling, 1891), Lyssomanes leucomelas Mello-Leitão, 1917, Mopiopia labyrinthea (Mello-Leitão, 1947), Opas paranensis
(Mello-Leitão, 1937), Runcinioides argenteus Mello-Leitão, 1929,
Sanogasta maculosa (Nicolet, 1849), Stephanopsis colatinae Soares & Soares, 1946, Synema nigrianum Mello-Leitão, 1929 and Tro-gloneta cantareira Brescovit & Lopardo, 2008 are recorded for the first time for the state of Rio Grande do Sul and Conifaber yasi
Grismado, 2004, Deinopis amica Schiapelli & Gerschman, 1957 and Senoculus purpureus (Simon, 1880) are new records for Brazil. Among the most common families, Araneidae and Theridiidae had the highest percentages of named spider species (95.3% and 64.7%, respectively), which is an indication that the taxonomy of these two families in southern Brazil is well known.
Amaurobiidae, Clubionidae, Dictynidae, Gnaphosidae, Hahniidae, Mysmenidae, Nephiliidae, Scytodiidae and Synotaxi-dae were each represented by a single species, as follows: Hahnia
sp. (Hahnidae), Scytodes maquine Rheims & Brescovit, 2009, and
Synotaxus longicaudatus (Keyserling, 1891) (Synotaxidae), were only found at the Maquiné River basin; Elaver brevipes (Keyserling, 1891) (Clubionidae), Dictynidae undetermined (Dictynidae), and
Zimiromus montenegro Buckup & Brescovit, 1993 (Gnaphosidae) were singletons. All other families had more than one individual and were registered at more than one basin (Appendix 1).
Of all species/morphospecies, 47 (10.68%) were shared among all basins, 64 (14.54%) were shared at least among three basins, 104 (23.64%) were shared between at least two basins, and most (225 species, 51.14%) were exclusive to a single ba-sin. Riparian forests of the Piratini and Camaquã basins had the greatest number of shared species (34 species), the smallest being between Piratini and Maquiné (9). The greatest number of exclusive species was recorded at the Maquiné basin (82 species) and the fewest number of exclusives at Sinos basin (38); the forests at Piratini and Camaquã had nearly the same number of exclusive species (55 and 50, respectively).
The most abundant species was Sphecozone personata
(Simon, 1894) (n = 1,222, 13.8% of the total), but it was almost exclusive to the Maquiné River basin, except for two individ-uals found at Sinos basin. The second most abundant species,
Thymoites promatensis Lise & Silva, 2009 (n = 436, 4.93%) was recorded in all rivers except Maquiné, and the third most abun-dant, Spintharus gracilis Keyserling, 1886 (n = 325, 3.67%) was sampled from all basins except Piratini (Appendix 1).
Among the spider species for which more than 100 indivi-duals were collected (22 species), or which represented more than 1% of the total, nine were not found at all rivers. Some of those were sampled from only one or two of the basins (Appendix 1).
between the edges (river edge and grassland edge: 63 species) and the greater number of exclusive species occurred at the edge of the grassland (75 species), followed by the river edge (56) and forest interior (53). Of the four most abundant species, equivalent to more than 25% of the total, all were predominant in the forest interior, each with almost 50% of all individuals recorded there. Thymoites promatensis was more dominant in the forest interior (>88%).
Araneofauna composition quantitative similarity
and dissimilarity
The quantitative (Morisita, ANOSIM: R = 0.824, p < 0.0001) and qualitative indexes (Simpson, ANOSIM: R = 0.809, p = 0.001) in our results indicate that the spider fauna differ significantly among river basins. The SIMPER analysis reveals that Sphecozone personata contributed a much greater value (12.15) than the other species (Table 1) when it comes to quantitative differences among river basins. The first ten species, all contributing more than 1%, together contribute 38% of the total dissimilarity among rivers.
was not significantly distinct, neither according to quantitative (Morisita, ANOSIM: R = -0.078, p = 0.709, Fig. 4), nor qualitative indicators (Simpson, R = 0.008, p = 0.442, Fig. 5). The NMDS ordination had stress values close to the ones reported above: 0.127 for Morisita (Fig. 4) and 0.165 for Simpson (Fig. 5).
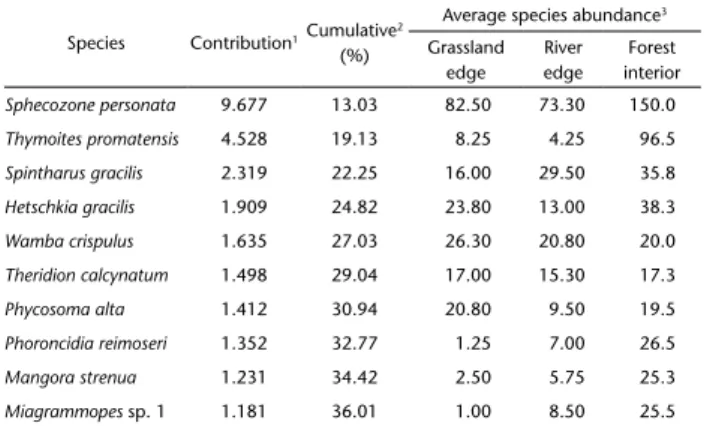
In the SIMPER analysis for microhabitats (Table 2), species contributing the most were the same as for the basins analysis (S. personata, T. promatensis, S. gracilis), with greater values at the forest interior. The ten species in Table 2 contributed more than 36% to the dissimilarity among microhabitats. At basins as well as in microhabitats, among these first ten species with the highest contribution, seven belong to Theridiidae.
Table 1. SIMPER analysis for the ten spiders species contributing most to dissimilarity among riparian forests in southern Brazil. 1Species percentage contribution to dissimilarity, 2cumulative dissimilarity among riparian forests, 3average species abundance in each riparian forest.
Species Contribution1Cumulative 2
(%)
Average species abundance3
Piratini Camaquã Sinos Maquiné
Sphecozone personata 12.150 15.61 0.00 0.0 0.667 407.00
Thymoites promatensis 3.992 20.73 4.33 45.0 96.000 0.00
Spintharus gracilis 2.774 24.30 0.00 3.0 33.000 72.30
Hetschkia gracilis 2.135 27.04 10.30 45.3 1.000 43.30
Theridion calcynatum 1.854 29.42 44.00 22.0 0.000 0.00
Wamba crispulus 1.845 31.79 43.00 33.0 10.000 3.33
Phycosoma alta 1.452 33.65 21.70 18.3 26.300 0.00
Phoroncidia reimoseri 1.296 35.32 0.00 2.0 35.300 9.00
Metagonia sp. 1.161 36.81 0.00 18.7 0.000 28.00
Mangora strenua 1.148 38.28 29.00 10.0 3.330 2.33
Average dissimilarity overall: 77.86
Table 2. SIMPER analysis for the ten spiders species contributing most to dissimilarity among microhabitats of riparian forests in southern Brazil. 1Species percentage contribution to dissimilarity, 2cumulative dissimilarity among microhabitat, 3average species abundance in each microhabitat.
Species Contribution1Cumulative 2
(%)
Average species abundance3
Grassland edge River edge Forest interior
Sphecozone personata 9.677 13.03 82.50 73.30 150.0
Thymoites promatensis 4.528 19.13 8.25 4.25 96.5
Spintharus gracilis 2.319 22.25 16.00 29.50 35.8
Hetschkia gracilis 1.909 24.82 23.80 13.00 38.3
Wamba crispulus 1.635 27.03 26.30 20.80 20.0
Theridion calcynatum 1.498 29.04 17.00 15.30 17.3
Phycosoma alta 1.412 30.94 20.80 9.50 19.5
Phoroncidia reimoseri 1.352 32.77 1.25 7.00 26.5
Mangora strenua 1.231 34.42 2.50 5.75 25.3
Miagrammopes sp. 1 1.181 36.01 1.00 8.50 25.5
Average dissimilarity overall: 74.26
Results of the multivariate analysis (NMDS) revealed a proximity between the Piratini and Camaquã rivers, both in the qualitative (stress: 0,166) (Fig. 2) and quantitative (stress: 0,126) (Fig. 3) indexes, but a larger distance was revealed for the Maquiné River. The Sinos River is at the threshold between the Piratini-Camaquã and Maquiné rivers. With respect to the qualitative index, it is possible that the Maquiné River is more distinct due to the elevated number of adult spiders of the family Linyphiidae, since Theridiidae adults predominated at all other basins. In the qualitative index, the Maquiné River basin formed an isolated cluster, most likely due to the high number of exclu-sive species. At the different microhabitats, species composition
DISCUSSION
In the present study, immature spiders predominated. The percentage of juvenile spiders sampled in the tropics and subtropics is usually about 60-70% (SILVA 1996, SØRENSEN et al. 2002). The percentage we report here is close to that obtained by other authors using BT in southern (RODRIGUES 2005: 27.2% adults, BONALDO et al. 2007: 32.6%, BALDISSERA et al. 2008: 15%), south-eastern (GONÇALVES-SOUZA et al. 2007: 18%), west-central (RAIZER et al. 2005: 28%) and north-eastern Brazil (OLIVEIRA-ALVES et al. 2005: 29%).
of Rio Grande do Sul (RS)), Salticidae predominated in an area of continuous forest, (PODGAISKI et al. (2007). All families recorded by previous studies in other ecosystems of RS, using the same sampling method we used, were also collected in riparian forests, with a few exceptions. Hersiliidae, recorded by INDRUSIAK & KOT -ZIAN (1998) from the central portion of the state, was represented
only by immature spiders in our samples. BONALDOet al. (2007) sampled Caponiidae and Selenopidae in different ecosystems,
including a few riparian forests. PODGAISKI et al. (2007), using BT, obtained only immatures of Ctenidae, Lycosidae and Pisauridae in riparian forests. OTT et al. (2006) recorded Ctenidae, Lycosidae and Pisauridae only with other sampling methods, not BT, and observed that these families are nocturnal. In the west-central region of Brazil, state of Mato Grosso, RAIZER et al. (2005) studied the araneofauna of distinct environments, including various riparian forests of the Paraguay River, and recorded Araneidae
Figures 2-5. Non-metric multidimensional scaling (NMDS) of spider fauna composition in southern Brazil. (2-3) Among riparian forests: (2) Morisita index (stress: 0.166); (3) Simpson index (stress: 0.126). (4-5) Among microhabitats: (4) Morisita index (stress: 0.127); (5) Simpson index (stress: 0.165). (PR) Piratini river, (CR) Camaquã river, (SR) Sinos river, (MR) Maquiné river, (GE) grassland edge, (RE) river edge, (FI) forest interior.
2 3
as dominant. The family and species composition in our results are very different from theirs. This is possibly due to the fact that RAIZER et al. (2005) used nocturnal searching as a sampling method, which favors the capture of Araneidae spiders.The family composition of spiders represented by adults in our samples varied very little among microhabitats. Theridiidae predominated in all, followed by Linyphiidae. Both are found in the forest interior. Theridiids are known to occupy a variety of ecological niches (SILVA 1996, SILVA & CODDINGTON 1996), which could possibly explain their wide distribution across microhabi-tats in our data.
The frequency of individuals of some families was higher in the forest interior than in the forest edges (e.g., Anyphaeni-dae, LinyphiiAnyphaeni-dae, MimetiAnyphaeni-dae, PholciAnyphaeni-dae, Theridiosomatidae). The great presence of Theridiosomatidae there substantiates the results of CODDINGTON (1986), according to whom these spiders inhabit mainly dark and humid sites within forests. At the Ma-quiné River, the river edge has a much more closed forest with high vegetation density. GONÇALVES-SOUZA et al. (2007) also found more Theridiosomatidae in the forest interior than at the forest edges of the Atlantic forest of south-eastern Brazil, also recording Linyphiidae with many species exclusive to the forest interior.
Members of Salticidae showed no clear microhabitat pref-erence in our samples. In contrast, in previous studies this family was collected more often at the edges of forests (GONÇALVES-SOUZA et al. 2007, OLIVEIRA-ALVES et al. 2005). These spiders have great vi-sual accuracy, and can use the light incidence at the forest edges to locate and capture prey (ROMERO & VASCONCELLOS-NETO 2005). Two families represented in our samples have been in-frequently collected as part of other inventories in the South. Mysmenidae was represented by T. cantareira. Synotaxidae, represented by S. longicaudatus, had only been recorded from Rio Gande do Sul before by SILVA & ARAÚJO (2005) having also been found in the Atlantic forest of south-eastern Brazil (GONÇALVES-SOUZA et al. 2007).
Besides the high species richness recorded in the present study, and new records for Rio Grande do Sul and Brazil,new species and new records had been previously reported from the same data by RODRIGUES & MENDONÇA (2011) for Araneidae; RO -DRIGUES & MARQUES (2010) for Phoroncidia (Theridiidae), RODRIGUES
& OTT (2010) for Psilocymbium (Linyphiidae) and RODRIGUES & BRESCOVIT (2015) for Thymoites (Theridiidae).
The composition of spider species differed among river basins. A number of factors such as geographical distance be-tween basins, composition of the vegetation, climatic factors and biome may be plausible explanations for it. Piratini and Camaquã, which are very similar to each other, are within the Pampa biome. Given that the Maquiné River Basin is well within the Atlantic forest, it was expected that its fauna would differ from the other basins. The Atlantic forest is a peculiar biome, with high diversity levels and heterogeneous areas and habitats that reflect different physical environmental characteristics (CONSERVATION INTERNATIONALet al. 2000, TABARELLI et al. 2005).
Habitat heterogeneity could be responsible for the number of exclusive spider species at the Maquiné River basin. The Sinos River is at the limit between the Pampa and the Atlantic forest biomes. Even though the forest of the Sinos River is not con-tinuous, our sampling site includes a fraction of the forest that is in good condition. These characteristics of the Sinos basin may explain the faunistic differences with respect to Maquiné.
Even though some species seemed to prefer one of the three forest microhabitats, and the slight tendency for edge microhabitats to share more species, the overall species compo-sition did not significantly differ among them. In contrast, the results of OLIVEIRA-ALVES et al. (2005), which were obtained with the same collecting method as ours, indicated low similarity between the spider fauna of the forest interior and the edges of an Atlantic forest fragment in north-eastern Brazil. They suggested that the faunistic differences in spider assemblages were due to the differences in vegetation at the edges and forest interior. When different environments are compared, variations in species composition are usually stronger.
An alternative explanation to vegetation structure deter-mining faunistic differences is that the basins rest on different phytogeographic regions, thus supporting different plant species/taxa. This would affect spiders more strongly, and in a different way, than vegetation structure per se (RODRIGUES et al. 2014). Spider assemblages can be notably dependent on regional aspects, and dissimilarities among basins might indicate an association between spiders and particular vegetation subtypes (RAIZER et al. 2005, RINALDI & TRINCA 2008). A second possibility would be differences in the conservation status of the landscape of each basin, making it difficult to compare them. However, our data on vegetation density and complexity (not shown, partial results in RODRIGUES & MENDONÇA 2012) in these riparian forests of Rio Grande do Sul do not support that the sampled riparian forests are similar in structure and density.
We had already shown that vegetation structure does not affect spider functional diversity: guild abundance and distribu-tion in these same riparian forests do not respond to standard measurements of vegetation structure and density (RODRIGUES
& MENDONÇA 2012). Now we can make a stronger case for this argument, since in our results the three microhabitats do not differ in their spider assemblages.
ACKNOWLEDGEMENTS
We thank José V. Feltrim for access to the study area at the Maquiné River; the people in Corticeiras Empreendimentos e Participações LTDA farm, in Cristal, for access to the study area and Tiago C. de Marchi and João A. Jarenkow for information on the areas; Erica H. Buckup, Maria Aparecida de L. Marques and Ricardo Ott for access to the spider collection and literature of the MCN. We also thank Pedro Cardoso (Finnish Museum of Natural History, Helsinki, Finland) and two anonymous review-ers for their valuable comments. CNPq funded ENLR through a PhD stipend 140586/2007-5). MMJ was supported by a research productivity grant (CNPq 309348/2012-9).
LITERATURED CITED
BALDISSERA R, GANADE G, BRESCOVIT AD, HARTZ SM (2008) Landscape mosaic of Araucaria forest and forest monoculture influencing understory spider assemblages in southern Brazil. Austral Ecology 33: 45-54. doi: 10.1111/j.1442-9993.2007.01789.x
BONALDO AB, OTT R (2002) Aranhas, as versáteis estrategistas do Delta. Natureza em Revista 13: 40-43.
BONALDO AB, MARQUES MAL, PINTO-DA-ROCHA R, GARDNER T (2007) Species richness and community structure of arboreal spider assemblages in fragments of three vegetacional types at Ban-hado Grande wet plain, Gravataí river, Rio Grande do Sul, Brazil. Iheringia, Série Zoologia, 97: 143-151.
CARDOSO P (2009) Standardization and optimization of arthropod inventories – the case of Iberian spiders. Biodiversity and Conservation 18: 3949-3962. doi: 10.1007/s10531-009-9690-7
CODDINGTON JA (1986) The genera of the spider family Theridioso-matidae. Smithsonian Contribution to Zoology 422: 1-96.
CODDINGTON JA, YOUNG LH, COYLE FA (1996) Estimating spider species richness in a Southern Appalachian cove hardwood forest. Journal of Arachnology 24: 111-128.
CONSERVATION INTERNATIONALDO BRAZIL, FUNDAÇÃO SOS MATA ATLÂN -TICA, FUNDAÇÃO BIODIVERSITAS, INSTITUTODE PESQUISAS ECOLÓGICAS, SECRETARIADO MEIO AMBIENTEDO ESTADODE SÃO PAULO, SEMAD/ INSTITUTO ESTADUALDE FLORESTAS MG (2000) Avaliações e ações prioritárias para a conservação da biodiversidade da Mata Atlântica e Campos Sulinos. Brasília, Ministério do Meio Ambiente/SBF, 40p.
CLARKE KR, WARWICK RM (1994) Change in Marine Communi-ties. Plymouth, National Research Concil, 144p.
DAVIDE AC, BOTELHO SA (1999) Análise crítica dos programas de recomposição de matas ciliares em Minas Gerais, p. 172-188. In: Simpósio de Mata Ciliar: Ciência e Tecnologia. Belo Horizonte, Lavras, UFLA/FAEPE/CEMIG.
DENNIS JG, RUGGIERO MA (1996) Biodiversity inventory: building an inventory at scales from local to global, p. 149-156. In:
SZARO RC, JOHNSTON DW (Eds.) Biodiversity in managed landscapes. Oxford, Oxford University Press.
DENNIS P (1997) Impact of forest and woodland structure on insect abundance and diversity, p. 321-349. In: WATT AD,
STOCK NE, HUNTER MD (Eds.). Forest and Insects. London, Chapman & Hall.
FOELIX RF (1996) Biology of spiders. New York, Oxford Univer-sity Press, 306p.
GALLÉR R, SCHWÉGER S (2014) Habitat and landscape attributes influencing spider assemblages at lowland forest river valley (Hungary). North-Western Journal of Zoology 10: 36-41.
GONÇALVES-SOUZA T, MATALLANA G, BRESCOVIT AD (2007) Effects of habitat fragmentation on the spider community (Arachnida, Araneae) in three Atlantic forest remnants in Southeastern Brazil. Revista Ibérica de Aracnología 16: 35-42.
HALFFTER G, MORENO CE, PINEDA EO (2001) Manual para evalua-ción de la biodiversidad en Reservas de la Biosfera. México, Cyted Orcyt, Unesco, Sea, 79p.
HAMMER O, HARPER DAT (2009) Past: Paleontological Statistics. Version 1.97. Available online at http://folk.uio.no/oham-mer/past [Accessed: 16/05/2015]
INDRUSIAK LF, KOTZIAN CB (1998) Inventário das aranhas arborícolas de três regiões de Santa Maria, RS, Brazil. Revista Ciência e Natura 20: 187-214.
MALAVASI UC, MALAVASI MM, CURTI M (2004) III Simpósio regional de mata Ciliar. Cascavel, Unioeste, 96p.
MALUF JRT (2000) Nova classificação climática do Estado do Rio Grande do Sul. Revista Brasileira de Agrometeorologia 8: 141-150.
MURCIA C (1995) Edge effect in fragmented forests: implications for conservation. Trends in Ecology & Evolution 10: 58-62.
NAIMAN RJ, DECAMPS H, POLLOCK M (1993) The role of riparian corridors in maitaning regional biodiversity. Ecological Applications 3: 209-212.
OLIVEIRA-ALVES A, PERES MCL, DIAS MA, CAZAIS-FERREIRA GS, SOUTO
LRA (2005) Estudos das comunidades de aranhas (Arach-nida: Araneae) em ambiente de Mata Atlântica no Parque Metropolitano de Pituaçu – PMP, Salvador, Bahia. Biota Neotropica 5: http://www.biotaneotropica.org.br/v5n1a/ pt/abstract?inventory+BN006051a2005
OTT R, BUCKUP EH, MARQUES MAL (2006) Aranhas, p. 172-184. In: BECKER FG, RAMOS RA, MOURA LA (Orgs). Biodiversidade. Regiões da Lagoa do Casamento e dos Butiazais de Tapes, Planície Costeira do Rio Grande do Sul. Brasília, Ministério do Meio Ambiente MMA/SBF.
PODGAISKI LR, OTT R, RODRIGUES ENL, BUCKUP EH, MARQUES MAL (2007) Araneofauna (Arachnida; Araneae) do Parque Estadual do Turvo, Rio Grande do Sul, Brazil. Biota Neotropica 7: http://www.biota-neotropica.org.br/v7n2/pt/abstract?inventory+bn01107022007
PLATNICK NI (1999) Dimensions of biodiversity: targeting meg-adiverse groups, p. 33-52. In: CRACRAFT J, GRIFOFT (Eds.). The living planet in crisis: Biodiversity science and policy. New York, Columbia University Press.
(Mato Grosso, Brazil) e sua similaridade com a araneofauna amazônica. Biota Neotropica 5: http://www.biotaneotropica. org.br/v5n1a/pt/abstract?inventory+ BN009051a2005
RINALDI IM, TRINCA LA (2008) Spider assemblages in widely-sepa-rated patches of Cerrado in São Paulo State, Brazil. Acta Biologica Paranaense 37: 165-180.
RODRIGUES ENL (2005) Fauna araneológica (Arachnida; Araneae) arborícola de duas áreas em uma mata de restinga no sul do Brazil. Acta Biologica Leopoldensia 27: 73-92.
RODRIGUES ENL, MARQUES MAL (2010) Sobre o gênero Phoroncidia: nova espécie, ecologia e descrição do macho de P. reimoseri
com novas ocorrências para o sul do Brasil (Araneae, Theridi-idae). Iheringia, Série Zoologia, 100: 247-253. doi: 10.1590/ S0073-47212010000300010
RODRIGUES ENL, OTT R (2010) A new species of Psilocymcium with the descriptions of the male and new records of P. lineatum at South Brazil (Araneae: Linyphiidae). Zoologia 27: 445-450. doi: 10.1590/S1984-46702010000300018
RODRIGUES ENL,MENDONÇA JR MS (2011) Araneid orb-weavers (Ara-neae, Araneidae) associated with riparian forests in southern Brazil: a new species, complementary descriptions and new records. Zootaxa 2759: 60-68.
RODRIGUES ENL, MENDONÇA JR MS (2012) Spider guilds in the tree-shrub strata of riparian forests in southern Brazil. Journal of Arachnology 40: 39-47.
RODRIGUES ENL, BRESCOVIT AD (2015) On the spider genus Thy-moites in the Neotropical Region (Araneae, Theridiidae): nine new species, complementary descriptions and new records. Zootaxa 3972: 181-207. doi: 10.11646/zootaxa.3972.2.3
RODRIGUES ENL, MENDONÇA JR MS, COSTA-SCHMIDTLE (2014) Spider diversity responds strongly to edge effects but weakly to vegetation structure in riparian forests of Southern Brazil. Arthropod-Plant Interactions 8: 123-133. doi: 10.1007/ s11829-014-9294-3
ROMERO GQ, VASCONCELOS-NETO J (2005) Spatial distribution and microhabitat preference of Psecas chapoda (Peckham & Peckham) (Araneae, Salticidae). Journal of Arachnology 33: 124-134.
SAMU F, SUNDERLAND KD, SZINETÁR C (1999) Scale-dependent disper-sal and distribution patterns of spiders in agricultural systems: a review. Journal of Arachnology 27: 325-32.
SILVA D (1996) Species composition and community structure of Peruvian rainforest spiders: a case study from a seasonally inundated forest along the Samiria river. Revue Suisse de Zoologie, Hors Serie: 597-610.
SILVA D, CODDINGTON JA (1996) Spiders of Pakitza (Madre de Dios) Peru: species richness and notes on community structure, p. 241-299. In: WILSON DE, SANDOVAL A (Eds.). The biodiversity of Pakitza and its environs. Washington, DC, Smithsonian Institution.
SILVA ELC, ARAÚJO AM (2005) Distribuição e diversidade das spe-cies de aranhas (Araneae) coletadas na região de Taínhas e Terra de Areia, Rio Grande do Sul, Brasil. Revista Brasileira de Zoociências 7: 285-296.
SØRENSEN LL, CODDINGTON JA, SCHARFF N (2002) Inventorying and estimating subcanopy spider diversity using semiquantitative sampling methods in an Afromontane Forest. Environmen-tal Entomology 31: 319-330.
TABARELLI M, PINTO LP, SILVA JMC, HIROTA MM, BEDÊLC (2005) Desa-fio e oportunidades para a conservação da biodiversidade na Mata Atlântica Brasileira, p. 132-138. In: Megadiversidade. Belo Horizonte, Conservação Internacional, vol. 1.
UETZ GW (1991) Habitat structure and spider foraging, p. 325-348. In: BELL SS, MCCOY ED, MUSHINSKY HR (Eds.). Habitat structure. The physical arrangement of objects in space. London, Chapman and Hall.
WU YH, CHENG X (2012) Spider community structures in different types of hedgerows in the purple soil hilly areas of Sichuan Ba-sin. Journal of Ecology and Rural Environment 28: 661-668.
Submitted: 15 July 2015
Received in revised form: 22 December 2015 Accepted: 16 March 2016
Editorial responsibility: Antonio D. Brescovit
Author Contributions. ENLR and MSMJ designed sampling, ENLR and PESR conducted sampling, ENLR, PESR and MSMJ analysed the data and wrote the paper.
Appendix 1. Species/morphospecies list for spiders sampled in riparian forests and respective microhabitats (edges and forest interior) in southern Brazil. (GE) Grassland edge, (RE) river edge, (FI) forest interior.
Taxa
Riparian forests/microhabitats
Total %
Piratini Camaquã Sinos Maquiné
RE FI GE RE FI GE RE FI GE RE FI GE
Amaurobiidae
Amaurobiidae undet. 1 2 1 4 0.05
Anyphaenidae
Anyphaenoides clavipes (Mello-Leitão, 1922) 2 1 3 2 8 0.09
Arachosia praesignis (Keyserling, 1891) 7 1 8 0.09
Arachosia sp. 1 1 0.01
Aysha borgmeyeri (Mello-Leitão, 1926) 3 1 4 8 0.09
Aysha chicama Brescovit,1992 3 3 0.03
Aysha ericae Brescovit,1992 2 2 1 5 0.06
Aysha helvola (Keyserling, 1891) 1 1 0.01
Aysha montenegro Brescovit,1992 1 3 2 1 6 13 0.15
Aysha rubromaculata (Keyserling, 1891) 1 1 2 0.02
Aysha triunfo Brescovit,1992 1 2 2 1 2 8 0.09
Aysha sp. 1 3 3 0.03
Aysha sp. 2 2 5 7 0.08
Aysha sp. 3 1 1 2 0.02
Aysha sp. 4 1 12 3 1 2 19 0.21
Aysha sp. 5 1 3 1 5 0.06
Aysha sp. 6 1 1 0.01
Aysha sp. 7 1 1 2 4 0.05
Aysha sp. 8 1 1 0.01
Jessica osoriana (Mello-Leitão, 1922) 1 1 0.01
Jessica sp. 1 1 2 0.02
Patrera longipes (Keyserling, 1891) 7 1 5 2 1 4 20 0.23
Patrera procera (Keyserling, 1891) 1 1 2 1 5 0.06
Sanogasta maculatipes (Keyserling, 1878) 1 1 0.01
Sanogasta maculosa (Nicolet, 1849) 1 1 0.01
Sanogasta sp. 1 1 1 0.01
Sanogasta sp. 2 1 1 0.01
Sanogasta sp. 3 1 1 1 3 0.03
Tasata variolosa Mello-Leitão, 1943 3 3 1 5 1 13 0.15
Tasata sp. 1 1 1 1 1 4 0.05
Tasata sp. 2 1 1 2 0.02
Tasata sp. 3 1 1 0.01
Wulfila albus (Mello-Leitão, 1945) 4 1 1 2 2 1 5 1 17 0.19
Wulfilopsis sp. 4 6 1 11 0.12
Wulfilopsis tripunctata (Mello-Leitão, 1947) 5 12 17 0.19
Xiruana gracilipes (Keyserling, 1891) 1 3 4 0.05
Xiruana sp. 1 1 1 3 0.03
Araneidae
Acasesia graciosa Lise & Braul, 1995 1 2 3 0.03
Alpaida alticeps (Keyserling, 1880) 2 2 4 0.05
Alpaida citrina (Keyserling, 1892) 10 10 0.11
Alpaida erica Levi, 1988 1 1 0.01
Alpaida grayi (Blackwall, 1863) 5 5 0.06
Alpaida lomba Levi, 1988 1 1 0.01
Alpaida nonoai Levi, 1988 2 2 0.02
Alpaida octolobata Levi, 1988 4 12 16 0.18
Alpaida pedro Levi, 1988 1 2 3 0.03
Alpaida truncata (Keyserling, 1865) 1 1 0.01
Araneus omnicolor (Keyserling, 1893) 1 2 1 1 2 1 5 13 0.15
Araneus unanimus (Keyserling, 1880) 4 2 1 1 8 0.09
Appendix 1. Continued.
Taxa
Riparian forests/microhabitats
Total %
Piratini Camaquã Sinos Maquiné
RE FI GE RE FI GE RE FI GE RE FI GE
Araneus uniformis (Keyserling, 1880) 2 2 0.02
Araneus venatrix (C.L. Koch, 1839) 1 1 1 1 4 0.05
Araneus vincibilis (Keyserling, 1893) 3 2 1 6 0.07
Bertrana rufostriata Simon, 1893 1 5 1 7 0.08
Cyclosa camargoi Levi, 1999 1 1 0.01
Cyclosa diversa (O.P.-Cambridge, 1894) 1 1 0.01
Cyclosa fililineata Hingston, 1932 2 1 7 10 0.11
Cyclosa inca Levi, 1999 2 2 0.02
Cyclosa machadinho Levi, 1999 1 1 1 5 1 1 6 16 0.18
Cyclosa morretes Levi, 1999 1 1 2 0.02
Eustala albiventer (Keyserling, 1884) 2 1 3 0.03
Eustala crista Poeta, Marques & Buckup, 2010 1 1 0.01
Eustala levii Poeta, Marques & Buckup, 2010 4 4 0.05
Eustala palmares Poeta, Marques & Buckup,2010 3 4 1 8 0.09
Eustala photographica Mello-Leitão, 1944 10 1 3 14 0.16
Eustala saga (Keyserling, 1893) 1 1 0.01
Eustala taquara (Keyserling, 1892) 5 4 12 8 9 3 41 0.46
Eustala sp. 1 1 1 0.01
Eustala sp. 2 1 1 0.01
Eustala sp. 3 1 1 0.01
Gasteracantha cancriformis (Linnaeus, 1767) 2 1 2 1 3 9 0.1
Hypognatha viamao Levi, 1996 1 1 1 1 4 0.05
Larinia montecarlo (Levi, 1998) 1 1 2 0.02
Mangora fundo Levi, 2007 1 3 1 5 0.06
Mangora lactea Mello-Leitão, 1944 1 2 3 0.03
Mangora melanocephala (Taczanowski, 1878) 1 3 4 0.05
Mangora missa Levi, 2007 1 1 0.01
Mangora piratini Rodrigues & Mendonça, 2011 1 1 0.01
Mangora strenua (Keyserling, 1893) 11 68 8 8 21 1 1 9 3 3 1 134 1.51
Mecynogea bigibba Simon, 1903 1 1 1 3 0.03
Metazygia floresta Levi, 1995 1 1 0.01
Metazygia genialis (Keyserling, 1892) 1 1 0.01
Metazygia lagiana Levi, 1995 1 1 0.01
Metepeira compsa (Chamberlin, 1916) 1 1 0.01
Metepeira glomerabilis (Keyserling, 1892) 1 1 0.01
Micrathena furva (Keyserling, 1892) 1 1 0.01
Micrathena guanabara Levi, 1985 2 2 6 1 2 13 0.15
Micrathena jundiai Levi, 1985 2 2 0.02
Micrathena lata Chickering, 1960 1 1 0.01
Micrathena nigrichelis Chickering, 1960 1 1 0.01
Micrathena spitzi Mello-Leitão, 1932 3 24 3 6 3 1 1 41 0.46
Ocrepeira fiebrigi (Dahl, 1906) 1 1 0.01
Ocrepeira galianoae Levi, 1993 2 2 4 8 0.09
Ocrepeira gnomo (Mello-Leitão, 1943) 1 2 1 1 1 6 0.07
Ocrepeira malleri Levi, 1993 1 1 0.01
Parawixia audax (Blackwall, 1863) 1 1 3 2 7 0.08
Parawixia velutina (Taczanowski, 1878) 1 1 0.01
Scoloderus cordatus (Taczanowski, 1879) 1 4 14 8 4 16 1 14 1 4 2 69 0.78
Testudinaria lemniscata (Simon, 1893) 10 10 0.11
Testudinaria quadripunctata Taczanowski, 1879 1 1 0.01
Verrucosa meridionalis (Keyserling, 1892) 3 3 0.03
Verrucosa undecimvariolata (O.P.-Cambridge,1889) 3 3 0.03
Wagneriana taim Levi, 1991 2 2 0.02
Appendix 1. Continued.
Taxa
Riparian forests/microhabitats
Total %
Piratini Camaquã Sinos Maquiné
RE FI GE RE FI GE RE FI GE RE FI GE
Clubionidae
Elaver brevipes (Keyserling, 1891) 1 1 0.01
Corinnidae
Castianeira sp. 1 1 2 0.02
Deinopidae
Deinopis amica Schiapelli & Gerschman, 1957 1 2 2 1 1 7 0.08
Deinopis sp. 1 1 1 2 0.02
Deinopis sp. 2 1 1 0.01
Dictynidae
Dictynidae undet. 1 1 0.01
Eutichuridae
Cheiracanthium inclusum (Hentz, 1847) 6 1 1 4 2 14 0.16
Eutichurus ravidus Simon, 1896 1 1 0.01
Gnaphosidae
Zimiromus montenegro Buckup & Brescovit, 1993 1 1 0.01
Hahniidae
Hahnia sp. 32 16 8 56 0.63
Linyphiidae
Anodoration claviferum Millidge, 1991 12 1 4 9 13 2 4 1 10 56 0.63
Asemostera latithorax (Keyserling, 1886) 1 1 0.01
Asemostera tacuapi Rodrigues, 2007 1 3 1 1 3 9 0.1
Dubiaranea sp. 2 1 3 0.03
Erigone sp. 2 2 1 6 1 2 6 1 21 0.24
Erigoninae undet. 1 1 0.01
Laminacauda montevidensis (Keyserling, 1878) 1 3 4 0.05
Laminacauda sp. 1 1 0.01
Lepthyphantes sp. 1 1 1 1 3 0.03
Lepthyphantes sp. 2 1 4 5 0.06
Lepthyphantes sp. 3 1 1 0.01
Linyphiinae undet. 1 1 0.01
Lygarina sp. 1 1 1 2 0.02
Lygarina sp. 2 1 5 6 0.07
Lygarina sylvicola Millidge,1991 11 6 5 22 0.25
Meioneta sp. 1 3 1 3 4 2 2 1 16 0.18
Meioneta sp. 2 2 1 1 1 5 0.06
Meioneta sp. 3 1 1 0.01
Meioneta sp. 4 3 3 0.03
Mermessus sp. 1 1 2 0.02
Neomaso sp. 2 1 3 0.03
Notiohyphantes excelsus (Keyserling, 1886) 1 2 3 0.03
Psilocymbium lineatum (Millidge, 1991) 1 1 2 0.02
Scolecura cambara Rodrigues, 2005 1 1 0.01
Scolecura parilis Millidge, 1991 3 2 5 0.06
Smermisia sp. 2 2 0.02
Sphecozone diversicolor (Keyserling, 1886) 1 1 2 0.02
Sphecozone ignigena (Keyserling, 1891) 9 2 8 2 1 1 2 25 0.28
Sphecozone personata (Simon, 1894) 1 1 293 598 329 1222 13.8
Sphecozone rostrata Millidge, 1991 2 15 22 55 6 100 1.13
Sphecozone sp. 1 1 1 0.01
Sphecozone sp. 2 1 1 0.01
Sphecozone sp. 3 1 1 0.01
Sphecozone sp. 4 1 1 0.01
Sphecozone sp. 5 1 1 0.01
Appendix 1. Continued.
Taxa
Riparian forests/microhabitats
Total %
Piratini Camaquã Sinos Maquiné
RE FI GE RE FI GE RE FI GE RE FI GE
Sphecozone sp. 6 4 1 5 0.06
Triplogyna ignitula (Keyserling, 1886) 2 2 1 5 0.06
Tutaibo aff. debilipes 6 6 0.07
Tutaibo rusticellus (Keyserling, 1891) 5 2 1 8 0.09
Tutaibo velox (Keyserling, 1886) 1 1 0.01
Tutaibo sp. 1 4 4 5 2 1 1 17 0.19
Tutaibo sp. 2 2 1 1 1 5 0.06
Tutaibo sp. 3 32 1 10 2 15 60 0.68
Tutaibo sp. 4 4 4 0.05
Tutaibo sp. 5 1 1 2 0.02
Mimetidae
Gelanor altithorax Keyserling, 1893 3 2 2 7 0.08
Gelanor zonatus (C. L. Koch, 1845) 1 9 2 1 4 2 1 3 1 24 0.27
Mimetinae undet. 1 3 2 49 3 8 65 0.73
Mimetinae undet. 2 12 6 1 5 1 3 28 0.32
Mimetinae undet. 3 1 1 2 0.02
Mimetus hieroglyphicus (Mello-Leitão, 1929) 2 1 3 0.03
Mysmenidae
Trogloneta cantareira Brescovit & Lopardo, 2008 1 1 1 2 5 0.06
Nephiliidae
Nephila clavipes (Linnaeus, 1767) 3 3 4 3 4 6 16 2 1 2 44 0.50
Oonopidae
Gamasomorpha sp. 1 2 1 3 0.03
Gamasomorpha sp. 2 1 1 2 4 0.05
Oonops sp. 1 2 3 0.03
Orchestina sp. 1 13 2 3 7 13 3 2 5 13 1 62 0.70
Orchestina sp. 2 1 1 2 0.02
Orchestina sp. 3 1 1 0.01
Oxyopidae
Hamataliwa sp. 2 1 3 0.03
Oxyopes sp. 1 1 5 1 8 0.09
Philodromidae
Berlandiella magna Mello-Leitão, 1929 2 3 6 8 7 26 0.29
Berlandiella sp. 1 1 1 0.01
Berlandiella sp. 2 1 1 0.01
Philodromidae undet. 1 1 2 0.02
Pholcidae
Mesabolivar aff. cyaneomaculatus 1 1 2 2 6 0.07
Mesabolivar luteus (Keyserling, 1891) 2 8 1 11 0.12
Metagonia argentinensis Mello-Leitão, 1945 4 1 4 9 0.10
Metagonia sp. 1 47 8 17 64 3 140 1.58
Tupigea paula Huber, 2000 4 4 0.05
Tupigea sp. 1 1 2 0.02
Salticidae
Acragas nigromaculatus (Mello-Leitão, 1922) 1 1 0.01
Ashtabula sp. 1 5 4 3 12 0.14
Ashtabula sp. 2 1 1 0.01
Atelurius segmentatus Simon, 1901 2 2 0.02
Beata aff. maccuni 1 1 0.01
Beata sp. 1 1 0.01
Chira sp. 1 1 0.01
Chira thysbe Simon, 1902 7 2 1 1 7 3 2 23 0.26
Chirothecia semiornata Simon, 1901 1 2 6 1 2 12 0.14
Appendix 1. Continued.
Taxa
Riparian forests/microhabitats
Total %
Piratini Camaquã Sinos Maquiné
RE FI GE RE FI GE RE FI GE RE FI GE
Chirothecia sp. 1 1 1 6 8 0.09
Chirothecia sp. 2 1 1 0.01
Coryphasia albibarbis Simon, 1902 1 1 1 3 2 1 9 0.10
Coryphasia sp. 1 1 1 0.01
Coryphasia sp. 2 7 3 10 0.11
Corythalia sp. 1 2 2 4 0.05
Corythalia sp. 2 1 1 0.01
Cotinusa aff. deserta 5 8 3 9 17 5 26 25 2 100 1.13
Cotinusa trifasciata (Mello-Leitão, 1943) 9 22 27 14 29 6 14 19 2 36 26 204 2.30
Cotinusa sp. 1 1 1 2 0.02
Cotinusa sp. 2 3 3 0.03
Cotinusa sp. 3 2 1 2 6 1 12 0.14
Cotinusa sp. 4 1 1 2 1 1 6 0.07
Cotinusa sp. 5 1 1 0.01
Cylistella cuprea (Simon, 1864) 7 27 1 4 11 50 0.56
Cylistella sp. 1 1 1 0.01
Cylistella sp. 2 1 1 2 0.02
Cylistella sp. 3 1 3 7 1 12 0.14
Dendryphantes sp. 1 1 0.01
Euophrys saitiformis Simon, 1901 1 1 0.01
Gastromicans albopilosa (Simon, 1903) 1 1 2 0.02
Hasarius lisei Vianna & Soares, 1982 1 1 0.01
Hasarius sp. 9 5 9 4 6 1 13 47 0.53
Lyssomanes leucomelas Mello-Leitão, 1917 1 1 0.01
Lyssomanes nigrofimbriatus Mello-Leitão, 1940 4 1 3 2 3 13 0.15
Lyssomanes pauper Mello-Leitão, 1945 15 6 21 0.24
Mopiopia labyrinthea (Mello-Leitão, 1947) 21 10 4 8 13 2 58 0.66
Mopiopia sp. 1 4 2 7 0.08
Myrmarachne sp. 1 2 3 0.03
Noegus australis (Mello-Leitão, 1941) 8 4 7 6 25 0.28
Paradescanso aff. fallax 1 1 2 0.02
Rudra sp. 2 1 1 4 0.05
Sarinda sp. 3 3 0.03
Sassacus sp. 1 1 3 10 14 0.16
Sassacus sp. 2 1 1 0.01
Synemosyna aurantiaca (Mello-Leitão, 1917) 1 1 1 3 0.03
Synemosyna lauretta Peckham & Peckham, 1892 2 2 0.02
Tacuna delecta Peckham & Peckham, 1901 4 2 3 1 13 23 0.26
Tariona bruneti Simon, 1903 1 1 3 5 10 0.11
Thiodina robusta Mello-Leitão, 1945 1 1 1 3 0.03
Tulpius gauchus Vianna & Soares, 1983 2 2 1 1 6 0.07
Unidentati undet. 1 1 2 0.02
Vinnius sp. 1 1 0.01
Vinnius uncatus Simon, 1902 2 5 7 0.08
Scytodiidae
Scytodes maquine Rheims & Brescovit, 2009 2 7 3 12 0.14
Senoculiidae
Senoculus purpureus (Simon, 1880) 2 1 2 1 1 1 8 0.09
Senoculus sp. 1 1 0.01
Sparassidae
Caayguara album (Mello-Leitão, 1918) 1 1 2 0.02
Polybetes germaini Simon, 1896 1 1 2 0.02
Polybetes rubrosignatus Mello-Leitão, 1943 3 2 2 1 8 0.09
Appendix 1. Continued.
Taxa
Riparian forests/microhabitats
Total %
Piratini Camaquã Sinos Maquiné
RE FI GE RE FI GE RE FI GE RE FI GE
Polybetes sp. 1 1 0.01
Synotaxidae
Synotaxus longicaudatus (Keyserling, 1891) 3 1 4 0.05
Trachelidae
Meriola cetiformis (Strand, 1908) 1 1 0.01
Trachelas sp. 1 1 1 2 0.02
Trachelas sp. 2 1 1 1 1 4 0.05
Trachelinae undet. 1 1 0.01
Trachelopachys cingulipes (Simon 1886) 3 3 0.03
Trachelopachys keyserlingi (Roewer, 1951) 1 3 4 0.05
Tetragnathidae
Chrysometa aramba Levi, 1986 1 1 0.01
Chrysometa boraceia Levi, 1986 2 2 4 0.05
Dolichognatha pinheiral Brescovit & Cunha, 2001 1 2 1 1 5 0.06
Glenognatha lacteovittata (Mello-Leitão, 1944) 1 1 0.01
Leucauge roseosignata Mello-Leitão, 1943 1 15 2 4 7 8 2 1 2 1 2 1 46 0.52
Leucauge sp. 1 8 1 1 1 11 0.12
Leucauge sp. 2 1 2 1 4 0.05
Leucauge sp. 3 1 1 0.01
Leucauge sp. 4 1 1 0.01
Leucauge sp. 5 1 1 0.01
Leucauge volupis (Keyserling, 1893) 2 5 7 0.08
Opas paranensis (Mello-Leitão, 1937) 1 1 4 1 1 1 9 0.10
Tetragnatha longidens Mello-Leitão, 1945 5 20 1 26 0.29
Tetragnatha sp. 1 1 1 2 4 0.05
Tetragnatha sp. 2 1 1 6 1 2 11 0.12
Tetragnatha sp. 3 1 2 1 4 0.05
Tetragnatha sp. 4 1 1 2 0.02
Tetragnatha sp. 5 1 1 0.01
Tetragnatha sp. 6 2 2 0.02
Tetragnatha sp. 7 2 2 0.02
Tetragnatha sp. 8 1 1 0.01
Theridiidae
Anelosimus ethicus (Keyserling, 1884) 5 1 2 1 9 0.10
Anelosimus nigrescens (Keyserling, 1884) 1 5 2 1 4 13 0.15
Anelosimus sp. 1 1 0.01
Argyrodes elevatus Taczanowski, 1873 1 1 0.01
Ariamnes longissimus Keyserling, 1891 2 2 1 2 2 1 4 1 15 0.17
Chrosiothes niteroi Levi, 1964 40 3 1 44 0.50
Chrosiothes perfidus Marques & Buckup, 1997 1 6 2 9 0.10
Chrysso compressa (Keyserling, 1884) 1 1 0.01
Chrysso nigrosterna Keyserling, 1891 15 1 3 13 16 1 34 11 27 121 1.37
Chrysso rubrovittata (Keyserling, 1884) 13 1 1 15 0.17
Chrysso sp. 1 14 16 1 31 0.35
Chrysso sp. 2 1 1 0.01
Coleosoma sp. 1 1 0.01
Craspedisia cornuta (Keyserling, 1891) 1 1 0.01
Cryptachaea altiventer (Keyserling, 1884) 7 3 2 1 11 3 2 1 1 9 40 0.45
Cryptachaea analista (Levi, 1963) 1 1 1 4 7 0.08
Cryptachaea bellula (Keyserling, 1891) 1 13 2 1 2 1 2 1 1 24 0.27
Cryptachaea cinnabarina (Levi, 1963) 3 7 1 1 1 13 0.15
Cryptachaea digitus (Buckup & Marques, 2006) 1 1 0.01
Appendix 1. Continued.
Taxa
Riparian forests/microhabitats
Total %
Piratini Camaquã Sinos Maquiné
RE FI GE RE FI GE RE FI GE RE FI GE
Cryptachaea hirta (Taczanowski, 1873) 4 3 1 15 1 5 7 36 0.41
Cryptachaea isana (Levi, 1963) 2 9 11 0.12
Cryptachaea passiva (Keyserling, 1891) 13 23 22 35 25 3 36 11 11 4 15 1 199 2.25
Cryptachaea rioensis (Levi, 1963) 1 3 1 5 0.06
Cryptachaea taim (Buckup & Marques, 2006) 1 1 1 3 0.03
Cryptachaea triguttata (Keyserling, 1891) 10 1 3 23 1 8 10 56 0.63
Dipoena atlantica Chickering, 1943 1 1 2 0.02
Dipoena cordiformis Keyserling, 1886 1 1 0.01
Dipoena ira Levi, 1963 5 2 4 4 6 21 0.24
Dipoena pumicata (Keyserling, 1886) 2 1 1 1 5 0.06
Dipoena pusilla (Keyserling, 1886) 4 2 1 7 0.08
Dipoena santacatarinae Levi, 1963 9 23 5 36 24 12 13 2 5 129 1.46
Dipoena sp. 1 1 2 1 4 1 1 1 11 0.12
Dipoena sp. 2 9 9 0.10
Dipoena sp. 3 3 1 4 0.05
Dipoena sp. 4 1 1 0.01
Dipoena taeniatipes Keyserling, 1891 1 2 1 2 1 7 0.08
Dipoena variabilis (Keyserling, 1886) 2 3 1 6 0.07
Echinotheridion sp. 2 2 0.02
Emertonella taczanowskii (Keyserling, 1886) 6 1 17 24 0.27
Episinus teresopolis Levi, 1964 5 5 45 55 0.62
Episinus sp. 1 1 1 0.01
Episinus sp. 2 6 1 13 5 6 31 0.35
Episinus sp. 3 12 24 3 39 0.44
Exalbidion sp. 6 2 23 4 4 5 5 1 5 12 67 0.76
Faiditus affinis (O.P.-Cambridge, 1880) 4 43 14 19 3 3 16 3 2 1 108 1.22
Faiditus alticeps (Keyserling, 1891) 1 1 0.01
Faiditus americanus (Taczanowski, 1874) 6 4 1 11 0.12
Faiditus plaumanni (Exline & Levi, 1962) 5 2 17 1 8 3 36 0.41
Faiditus sicki (Exline & Levi, 1962) 1 1 0.01
Faiditus striatus (Keyserling, 1891) 3 35 4 14 1 5 22 84 0.95
Faiditus sp. 1 5 25 3 8 1 42 0.47
Faiditus sp. 2 2 2 3 7 0.08
Faiditus sp. 3 1 1 0.01
Faiditus sp. 4 1 1 2 0.02
Hadrotarsinae undet. 1 1 0.01
Hetschkia gracilis Keyserling, 1886 22 9 20 54 62 3 29 77 24 300 3.39
Kochiura olaup (Levi, 1963) 12 4 16 6 3 13 2 2 8 14 80 0.90
Neospintharus rioensis (Exline & Levi, 1962) 2 1 1 1 2 1 2 10 0.11
Parasteatoda tesselata (Keyserling, 1884) 5 1 12 1 7 1 15 1 43 0.49
Phoroncidia piratini Rodrigues & Marques, 2010 1 1 2 4 0.05
Phoroncidia reimoseri Levi, 1964 4 2 21 82 3 7 20 139 1.57
Phoroncidia sp. 1 1 1 2 0.02
Phoroncidia sp. 2 1 6 7 0.08
Phycosoma alta (Keyserling, 1886) 11 54 6 27 22 21 51 7 199 2.25
Rhomphaea Braziliensis Mello-Leitão, 1920 15 29 6 10 33 8 2 2 1 106 1.20
Rhomphaea sp. 1 1 1 2 1 1 6 0.07
Rhomphaea sp. 2 1 1 3 5 0.06
Spintharus gracilis Keyserling, 1886 3 3 3 26 29 44 89 111 17 325 3.67
Tekellina guaiba Marques & Buckup, 1993 2 29 4 15 8 10 2 1 8 18 3 100 1.13
Tekellina sp. 1 1 1 4 1 7 0.08
Tekellina sp. 2 1 1 0.01
Theridiidae undet. 2 2 0.02
Appendix 1. Continued.
Taxa
Riparian forests/microhabitats
Total %
Piratini Camaquã Sinos Maquiné
RE FI GE RE FI GE RE FI GE RE FI GE
Theridion bergi Levi, 1963 1 1 0.01
Theridion biezankoi Levi, 1963 1 6 2 9 0.10
Theridion calcynatum Holmberg, 1876 31 50 51 30 19 17 198 2.24
Theridion eremum Levi, 1963 1 1 0.01
Theridion filum Levi, 1963 1 7 8 1 17 0.19
Theridion opolon Levi, 1963 2 1 3 0.03
Theridion plaumanni Levi, 1963 11 3 56 17 3 20 3 3 18 2 20 22 178 2.01
Theridion positivum Chamberlin, 1924 30 41 4 3 11 7 7 3 106 1.20
Theridion quadripartitum Keyserling, 1891 10 7 7 4 28 0.32
Theridion striatum Keyserling, 1884 1 1 6 8 0.09
Theridion teresae Levi, 1963 16 36 12 5 16 3 88 0.99
Theridion tinctorium Keyserling, 1891 9 7 1 17 0.19
Theridion sp. 1 2 1 2 15 2 2 2 26 0.29
Theridion sp. 2 1 1 0.01
Theridion sp. 3 1 1 0.01
Theridula gonygaster (Simon, 1873) 1 1 0.01
Thwaitesia affinis O.P.-Cambridge, 1882 2 20 31 4 57 0.64
Thymoites promatensis Lise & Silva, 2009 2 2 9 5 112 18 10 272 6 436 4.93
Thymoites sp. 1 14 1 26 4 1 46 0.52
Thymoites sp. 2 1 1 0.01
Thymoites sp. 3 18 3 1 11 33 0.37
Thymoites sp. 4 13 2 8 23 0.26
Thymoites sp. 5 2 1 2 5 0.06
Thymoites cristal Rodrigues & Brescovit, 2015 1 1 2 0.02
Thymoites camaqua Rodrigues & Brescovit, 2015 2 2 0.02
Tidarrem haemorrhoidale (Bertkau, 1880) 3 5 6 3 8 1 1 4 1 32 0.36
Wamba congener O.P.-Cambridge, 1896 14 7 15 7 2 5 1 4 55 0.62
Wamba crispulus (Simon, 1895) 13 45 71 46 27 26 18 8 4 6 4 268 3.03
Wirada sp. 1 2 1 1 4 0.05
Wirada sp. 2 2 3 1 6 0.07
Theridiosomatidae
Chthonos sp. 1 6 1 4 11 0.12
Chthonos sp. 2 1 1 0.01
Chthonos sp. 3 1 1 0.01
Naatlo sp. 1 9 2 2 13 0.15
Naatlo sp. 2 1 1 0.01
Naatlo sp. 3 1 1 0.01
Theridiosoma chiripa Rodrigues & Ott, 2005 1 1 2 0.02
Theridiosoma sp. 1 2 2 0.02
Theridiosoma sp. 2 1 1 0.01
Theridiosoma sp. 3 1 1 0.01
Theridiosomatidae undet. 3 3 0.03
Wendilgarda sp. 1 4 2 37 12 1 10 1 7 2 76 0.86
Wendilgarda sp. 2 13 13 0.15
Thomisidae
Epicadinus sp. 1 1 1 2 0.02
Epicadinus sp. 2 1 1 0.01
Epicadus heterogaster (Guérin, 1829) 1 1 0.01
Misumenoides sp. 1 1 0.01
Misumenops maculissparsus Keyserling, 1891 1 1 0.01
Misumenops pallens (Keyserling, 1880) 2 1 1 1 1 6 0.07
Misumenops sp. 1 1 1 0.01
Misumenops sp. 2 3 1 4 0.05
Appendix 1. Continued.
Taxa
Riparian forests/microhabitats
Total %
Piratini Camaquã Sinos Maquiné
RE FI GE RE FI GE RE FI GE RE FI GE
Misumenops sp. 3 1 1 4 1 1 8 0.09
Misumenops sp. 4 1 1 0.01
Misumenops sp. 5 1 1 0.01
Onocolus infelix Mello-Leitão, 1941 6 7 13 0.15
Onocolus intermedius (Mello-Leitão, 1929) 1 2 1 3 5 1 3 16 0.18
Onocolus sp. 1 1 1 3 5 0.06
Onocolus sp. 2 1 1 3 1 1 1 8 0.09
Runcinioides argenteus Mello-Leitão, 1929 2 2 0.02
Sidymella longispina (Mello-Leitão, 1943) 2 1 3 0.03
Sidymella lucida (Keyserling, 1880) 1 1 0.01
Sidymella multispinulosa (Mello-Leitão, 1944) 1 1 1 3 0.03
Stephanopis colatinae Soares & Soares, 1946 1 2 3 0.03
Synema nigrianum Mello-Leitão, 1929 1 1 0.01
Thomisidae undet. 1 2 1 3 0.03
Thomisidae undet. 2 6 1 1 8 0.09
Thomisidae undet. 3 1 1 0.01
Thomisinae undet. 1 8 1 10 0.11
Tmarus elongatus Mello-Leitão, 1929 1 1 0.01
Tmarus polyandrus Mello-Leitão, 1929 9 7 7 4 16 3 2 1 1 1 51 0.58
Tmarus pugnax Mello-Leitão, 1929 7 6 4 4 1 2 2 26 0.29
Tmarus striolatus Mello-Leitão, 1929 1 1 1 1 4 0.05
Tmarus sp. 1 1 1 2 0.02
Tmarus sp. 2 1 1 4 2 2 3 5 18 0.20
Tmarus sp. 3 4 4 0.05
Tmarus sp. 4 4 1 5 0.06
Tmarus sp. 5 1 1 0.01
Tmarus sp. 6 8 2 7 5 2 5 29 0.33
Tmarus sp. 7 1 1 0.01
Tmarus sp. 8 1 1 0.01
Tmarus sp. 9 1 1 2 0.02
Tmarus sp. 10 2 1 3 0.03
Tmarus sp. 11 1 1 0.01
Tmarus sp. 12 1 1 0.01
Tmarus sp. 13 1 1 0.01
Tmarus sp. 14 1 1 0.01
Tmarus sp. 15 1 1 0.01
Tmarus sp. 16 1 1 1 3 1 1 8 0.09
Uloboridae
Conifaber yasi Grismado, 2004 1 18 7 12 5 43 0.49
Miagrammopes sp. 1 6 45 7 22 12 23 2 9 12 2 140 1.58
Miagrammopes sp. 2 1 1 0.01
Miagrammopes sp. 3 1 1 0.01
Miagrammopes sp. 4 1 1 0.01
Philoponella gr. fasciata 3 9 12 0.14
Uloborus sp. 1 1 2 6 2 11 0.12
Uloborus sp. 2 1 1 2 0.02
Uloborus sp. 3 1 2 1 4 0.05
Total individuals 536 720 760 540 961 642 457 846 328 885 1467 709 8851 100
Total species 116 97 118 113 126 139 105 88 101 115 112 120