HOW TO IMPROVE SONAE’S PROCESSES OF SUPPLIERS OF SERVICES’
MANAGEMENT?
JOÃO AMARO RODRIGUES COELHO GIRÃO NR. 1429
A project carried out on the Master in Management course, under the supervision of Professor José Crespo de Carvalho
HOW TO IMPROVE SONAE’S PROCESSES OF SUPPLIERS OF SERVICES MANAGEMENT?
Abstract:
Sonae is one of the greatest retailers in Portugal. As the business got bigger, it centralized operations. Direcção de Servicços Administrativos processes all invoices sent by suppliers. However, there are many which deliver errors and are not processed automatically. As a result, there are lost invoices and suppliers who are not paid, while
Index
Introduction ... 1
Literature Review ... 5
Methodology ... 7
Results and discussion ... 9
Process’s map and its explanation ... 9
Cause and effect analysis ... 12
Interviews analysis ... 13
Stagings’ data analysis ... 15
Recommendations ... 17
Supplier Relationship Management ... 18
Internal Player Relationship Management ... 20
Potential Gains ... 22
Conclusion ... 24
1
Introduction
SONAE is one of the biggest Portuguese retailers operating in more than 66 countries and with more than 45 thousand collaborators spread through each one of its sub-brands. It is organized as shown in Appendix 4.
Its core business is in retailing with its SONAE MC holding managing brands such as
Continente MC, Well’s or Book.it and the SONAE SR holding managing brands on the specialized retail such as SportZone, Zippy or Worten, to mention a few. It has two strategic partnerships: one on telecommunications (SONAE COM) and the other on
shopping’s (SONAE SIERRA). Moreover, it has set two more partnerships in two
different areas: Retail real estate (SONAE ERP) and active investment management. It has crossed countries and developed businesses driven by the mission of creating economic and social value, to an ever increasing number of people. The company’s
values are trust, people in their success, ambition and efficiency. (Sonae, 2014)
Last financial year, it reached €4,8 billion of gross sales and €1,9 billion of equity and €5,5 billion worth of assets, according to Sonae’s financial reports. As the business got bigger and bigger, two things happened: firstly, support operations started to become overwhelmingly big and secondly it was able to centralize operations benefitting from synergies and in some cases gaining bargaining power. It is because these two factors that Direcção de Serviços Administrativos (DSA) (freely translated to Administration
Services’ Office) was created, on which this study will focus.
2 must come. Then, the office would process and let them available for payment. This office can be divided into two major groups: the first dealing with invoices having to do with retail goods and the second dealing with non-supply purchases, often called purchases of maintenance, repair and operating (MRO) goods1.
The first group, being strongly related to Sonae’s core business, is very much efficient and studied. As for the second there is plenty of room for improvement.
“Compared to the direct purchasing spend, the product variety and hence logistics complexity related to managing indirect purchasing spend is enormous” (Weele, 2010, p. 85). In a try to make the process, both to stores and to the office, even more efficient, Sonae implemented a new way of issuing purchase orders (PO’s) of MRO goods. That would influence how invoices would be processed, as well. Since 2010, SAP SRM is one other way stores have to ask for services. Hopefully, until the end of 2014 it will be the only one. From its implementation to our days, there have been inefficiencies on the process having important consequences on the business, specifically on the accountability. There are two different events that influence accountability: 1) invoice’s
registration and 2) its payment. The former registers a cost on the account and the latter represents a cash outflow. It is important that for each cash outflow and for each cost acknowledged there is an invoice that compensates it. When one of these things does not happen, there is an open item. Also, there could be a case when an invoice arrives but there is no PO on the system or the invoice’s data do not match its data, generating another type of open item. When there are open items, it means not all accountable
events are registered, which turns the company’s data outdated and the company itself less transparent. On the other hand, for each open item, it is generated a process of
1“These products, sometimes referred to as indirect materials or consumable items, represent materials, which are
3 correction. There are whole teams responsible for such processes. It is an inefficiency that makes the company incur in more costs than would be optimal.
On 31st of March 2014, the number of services’ invoices that needed manual treatment
was 66.788, corresponding to 18,2% of the total number of service´s invoices received last year2, although it has been decreasing. This number corresponded to almost 3M€, or 8,5% of the total value charged in the same period. Despite being sufficiently high to be studied, this number must be analysed carefully as for each invoice without PO there can be a different one without its invoice counterbalancing and biasing the final value. Although it would be interesting to compare these numbers with retail goods’ numbers, such is not possible since for MRO goods there are teams organized just to correct the inefficiencies, while for the former the same does not happen.
Moreover, whenever a supplier is not paid for a long time, it naturally gets upset and tries to communicate the situation. Officially, they would use the proper platform to do it. However, be it because the problem takes long to get solved or because they do not know the official way, more often than hoped they use other means such as email or phone. Due to that, many complaints are not registered and do not count or appear in
complaints’ analysis. Yet, last year on average there were 804 complaints per month that were registered in the system’s database.
Assessing process performance provides the opportunity of recognizing problems and taking corrective action before these problems escalate (Kueng, 2000, p. 67). Accordingly, it will be studied ways of improving Sonae’s processes regarding suppliers of services. SRM involves much more than reducing prices. It is about lowering the total cost of ownership (TOC) of the end-to-end value-chain. (…) Some of
4 the non-price costs associated to the buying transaction can be significant, in some cases even exceeding the nominal price (Chenoweth, Moore, Cox, Mele, & Sollinger, 2012, p. 8), which emphasizes the project’s importance and potential. It will be studied the process of accounting invoices regarding suppliers of MRO goods. The goal is for the number of automatically processed invoices to increase, decreasing the number of open items. Ultimately, that will lead to the decrease of total cost of ownership since the work related to the manual processing of invoices would lower, as well. In the end, the company will benefit from the accrued value.
Firstly, it will be given a literature review in which all terms used will be explained. Also in that chapter, it will be explained the methods utilized throughout the study, as
well as it will be provided an overview of various authors’ opinion regarding the theme. Then, it will be presented the results and will be done a discussion on the data collected. The chapter is divided into four: map of the process and its explanation, cause and effect analysis, interview analysis and data on stagings.
In the recommendations chapter, before conclusion, it will be suggested some measures to implement. It is divided into three sub chapters as follows: Supplier Relationship Management, which will deal with recommendations that have to do with external players; Internal Player Relationship Management that will present measures to positively influence internal player’s behaviours and outputs; and finally, in order for
this study to make sense, it must add value for which an analysis on the potential gains will be provided.
5
Literature Review
Much has been said about processes, although (at least comparatively) little about business process reengineering. In the next lines, it will be summarized what of most important has been read from many authors about this theme. It will also be explained the main terms and methods applied and how they should be analysed.
First of all, since it has been studied Sonae’s processes, it is necessary to define what a
process is. Oakland defines it as “the transformation of a set of inputs (…) into outputs
that satisfy customer needs and expectations, in the form of products information services or results” (Oakland, 1994, p. 14). Aytulun and Guneri describe “business
process simply by a flow of business activities” (Aytulun & Guneri, 2008, p. 2744), and
Davenport and Short just as “a set of logically related tasks performed to achieve a
defined business outcome” (Davenport & Short, 1990). Processes can be classified as management processes, key (or operational processes) or support processes. Processes are also defined given the nature of their client: external or internal (Sharp & McDermott, 2009). Process’s client is not necessarily a company’s client. It even may be in the company, in the case for example of materials’ purchases (Hammer & Champy, Reengineering the corporation, 1993, p. 50). “In a general way, processes that serve external clients are key processes, while the ones that serve internal clients are
6 Processes must be redesign and reengineered taking that into account and bringing them into the future. Reengineering is the fundamental rethinking and radical redesign of business processes to achieve dramatic improvements in critical, contemporary measures of performance (Hammer & Champy, Reengineering the corporation, 1993, p. 44). It requires more than just using computers to speed up processes while leaving their designs the same. At the heart of reengineering is the notion of discontinuous thinking; of recognizing and breaking away from the outdated. We must challenge old assumptions and shed the old rules that made the business underperform in the first place. (Hammer, Reengineering Work: Don't Automate, Obliterate, 1990, p. 4).
In order to know the process from end to end, and to assess chances of reengineering, the process was mapped. There are several possible choices when a process is to be mapped. It was used a swimlane diagram, to make clear that different teams were
involved in different responsibilities. “Such diagrams have become very popular because they highlight the relevant variables—who, what, and when—in a simple
notation” (Sharp & McDermott, 2009, p. 93). Its rules are presented in the Appendix 11. Then, a cause effect diagram was drawn. The diagram chosen is often called “fish bone”
diagram for its appearance. It is drawn starting from an effect to be studied. From the horizontal line (main bone) come out different lines representing different causes. From those, sub causes may appear, ending up with a design close to a fishbone. Such diagrams may also be drawn with a positive effect (to be achieved) instead of a problem. In our case, different thicknesses for the bones were used: the thicker a bone is the more important that cause is, as well.
7 the organization a process redesign effort driven by a single business function or unit
will probably encounter resistance from other parts of the organization” (Davenport & Short, 1990). No one in an organization wants reengineering. It is confusing and disruptive and affects everything people have grown accustomed to. Only if top-level managers back the effort and outlast the company cynics will people take reengineering seriously. (Hammer, Reengineering Work: Don't Automate, Obliterate, 1990, p. 9). Also, employee engagement is essential for such an effort. Employee engagement is the emotional commitment the employee has to the organization and its goals (Kruse, 2012). All this will be taken into account at the time of recommendations.
Methodology
Next, it will be presented the methodology followed: the rationale for the approach chosen, its scope and a small comment on the trustworthiness of the results (Bloomberg, 2012). Briefly, although with a high focus on quantitative data, it was not always possible to be completely separate from the issue, which has led to a hybrid approach to the problem, using both positivist and interpretative methodologies.
8 Firstly, by observation, it was studied which teams do what work and the path each invoice can follow. As a result, the process was mapped and it was understood that stores and suppliers might greatly influence how the processes flows. As a result, the next phase consisted in interviewing players in earlier steps of the process whose attitudes could be most influenced by Sonae, i.e. stores’ responsible for PO’s. A semi
structured interview was performed. The plan was to use the exhaustion method, by which interviews would be conducted until no new information was delivered. However, due to some bureaucracy existent, it was only possible to perform one, which jeopardizes the conclusions. One of interview’s major goals was to be able to compare
users’ satisfaction with the importance they attribute to some features. The other was to assess users’ difficulties. The interviews would have as much heterogeneity as possible,
considering: Sonae’s enterprises, locations, store’s turnovers, people’s ages, their genders, years working at Sonae, education, and experience.
Simultaneously, historical data on the invoices arrival was studied. Invoice’s flows between stagings were analysed to check if and where there were bottlenecks. Process times had to be measured for there was no such data recorded. It is recognized people may be influenced if they know their productivity is being measured, for which such fact was tried to be kept unknown.
Regarding study’s scope, the project’s results would affect service’s suppliers’ management team’s operations; hence it was an immediate choice to study it. Also,
almost the whole office’s work should be included in the study since from the arrival of an invoice until it is unblocked for payment, it passes through many teams and many things can influence the final outcome (for more detailed information on the office’s
9 totally dependent on other people’s actions - stores and suppliers - those were also included.
Finally, for this kind of studies, usually an 80–20 philosophy is appropriate (Davenport & Short, 1990); and thus Pareto analyses were done.
This hybrid approach may lead to a biased conclusion since part of it was taken from
researcher’s point of view. Still, in the end, “all research depends on interpretation, but with standard quantitative designs there is an effort to limit the role of personal
interpretation” (Stake, 1995, p. 41). Ultimately, it does not matter what specific analytic strategy is chosen, if one does everything to make sure that his analysis is of high quality (Yin, 1994).
Results and discussion
“But the knowledge of causes also has wide-ranging practical implications, for in many
instances to know causes is to be able to control them, and to control causes is to control effects.” (McInerny, 2004, p. 32)
Because this process’s clients are internal and it involves DSA’s office, stores and suppliers, this is a support, internal and inter-organizational process.
In order to have an idea of how the office works and how teams are organized for an easier understanding of the process, a view of the office’s plant and a small explanation are provided in the Appendix 10.
Process’s map and its explanation
10 either processed by a Sonae’s central service or by the store’s responsible
himself/herself, respectively. It must be approved by the person hierarchically above the requestor and only then is the PO sent to the supplier. After providing the service two things happen: 1) the requestor must officialise the reception on the system; 2) the
supplier sends the invoice to DSA’s office. If it is an electronic one, it goes immediately
to the Document Handler (DH) to be automatically processed. If it is on paper, its data must be introduced on the system3. There, the process goes as follows: a team separates the invoices by enterprise (for example, Modelo Continente or Sportzone), other team, puts a label with a code on the invoice (which will identify it on the system) and screens it to become electronic. The physical invoice is archived. The now digital invoice goes through the registration team who validates the data the system has read. After all this, the once physical invoices meet the electronic ones at the DH to follow, from then on, the same path.
The process is divided by stagings (as they are called), to where bills go depending on their status. There are five (plus one) stagings that matter for the purposes of this study:
SIP: it is the first staging and performs an automatic job that tries to account each invoice. When they do not comply with the specifications required, they deliver an error and are not accounted. They are, then, sent to the corresponding staging, manually, depending on the error;
SP and IP: depending on the error (which are mentioned in the map), invoices go to these stagings to be processed. SP is for invoices that have to do with services and IP for goods and costs;
SDP: it receives every invoices with wrong or missing PO code;
3 The team responsible won the Kofax Tranform Awards 2013, a worldwide prize which awards efficiency. This was
11
SSN: it receives invoices coming from SDP that have problems related to PO code and have information about the store that requested it.
S: this is a staging that belongs to the old process and should be out of this
study’s scope. However, when invoices do not have a PO code mentioned, it is
assumed that they are processed as they were before. After analysis, the person responsible discovers it should be processed through the new system and sends them to SDP to follow the normal procedure.
Moreover, it is worthy to note the process for which DSA is responsible depends on stores and suppliers. Even if it is highly efficient and with nothing to improve, if stores or suppliers do not perform their jobs well, there will be implications on DSA and its work. Specifically, if stores call directly to a supplier instead of processing the PO on the system, besides the fact that no PO will be generated and sent to the supplier, no item will be open so that the invoice matches it, hence not being processed automatically. Also, if they do not process PO’s correctly, certainly there will be an error when the invoice is to be processed (for example, wrong store’s code). As for the supplier, all he/she has to do is send the invoice with the (correct) PO code mentioned and charge the values agreed, or there will be a price divergence. Still, there are way too many who do not perform such simple tasks correctly.
Invoices “stay” in each staging until they are corrected and may be sent to SIP. As a result of this way of thinking the process - by staging - the data collected was incomplete. What has been considered as one stage (the processing of an invoice in one staging) is, actually, composed by more than one activity. Because what now matters is
the time an invoice “is kept” in a staging, there is only available data for the time it gets
12 Cause and effect analysis
“Only if the causes of problems are known can they be removed or controlled or can the process or product be made robust to disturbances” (Schippers, 1999, p. 1). Thus, after drawing the map, it was drawn a cause-effect diagram. The goal was to understand which causes stores, suppliers and others not to perform their tasks correctly and to be aware of what may influence the main problem being studied
For ill balances to happen there may be various causes. Sometimes, a relationship with a supplier gets deteriorated and eventually his/her account is blocked. Hence, each open item that corresponds to that supplier is not unblocked for payment. The same happens with invoices that – for many other reasons that are out of this study’s scope – are processed but not unblocked for payment. These are justified causes, which nevertheless causes open items not to be closed. One other cause there may be, although in this case
completely out of Sonae’s control, is when invoices get lost during dispatch and never
get into the process. The two most influential causes to this problem are “manual
13 what, after all, is there that do not allow invoices to be processed automatically? Appendix 2 shows the answer(s).
Essentially, this tries to find what are the causes of the mistakes being corrected on the process, for which may be interesting to follow the rationale with the process map on the back of the mind (Appendix 3). The vast majority of them are self-explanatory. Yet, it will be explained some that either are harder to understand or are noteworthy.
It is easily noticeable that one cause that appears many times is “supplier’s mistake”.
Out of the nine main causes, “supplier’s mistake” appears five. This poses an extra difficulty since it is an actor on whose actions Sonae has little power.
Then, there are a few which are controllable by Sonae. In the end, they all have to do
with Sonae’s employees’ behaviours. Causes such as “reception missing”, “PO not
processed” or “purchasing department delay” are a few of the most critical. Interviews analysis
To understand what prevents these people from complying with the process and subsequently try to apply corrective measures, interviews were done. Amongst many, it was found three important things. On the one hand, stores’ priority is to run the
business, and not especially its bureaucracy. Thus, if their directors have to choose between helping the sales on a busy day, or to register a reception, there will be little doubt on what to do. Probably more serious than that, is the fact that stores’ directors know that the cost of a purchase will only be represented in the accounts of the month in
which the purchase’s reception is registered. As a result, there may be months in which
not only do directors not have any special incentives to register the receptions, but also have incentives to not register it! As Levitt & Dubner put it “Incentives are the
14 any riddle” (Levitt & Dubner, 2005, p. 23). Such behaviour happens for two other reasons (which are basically the lack of incentives). 1) Stores are not penalised for a missing reception 2) they do not feel the consequences of such behaviour for is the DSA office that deals with them. Furthermore, the system is not user-friendly and the workflow of approval is sometimes long. Purchases out of catalogue pose yet another difficulty.
Since this is a rather new process, and because “no one likes reengineering”, it has also been considered the chance of there being some resistance to change, which “is a characteristic of humans and may waste the best projects or intentions” (Norton & Kaplan, 2004, p. 397).
15 need a request of any sort, the service will be provided and charged regardless of whether there is a PO. Therefore, it is essential whoever is responsible for these PO’s does them correctly and on time. It was realized that delays on this requests occur many, many times, forcing suppliers to send invoices without codes or with the last year’s.
It is important to recall that, although only these causes were worthy of note in here, there are many other that deserve thought and analysis to achieve excellence.
Stagings’ data analysis
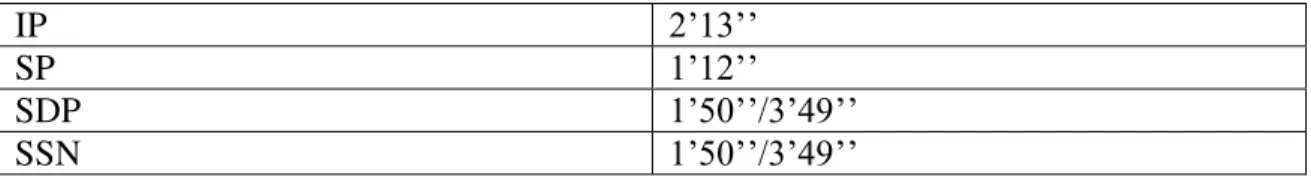
The last step of the analysis consisted in the study of the data available in each staging, and of the number of invoices that entered the process (i.e. that were sent to DSA and registered). Due to resources constraints, it was analysed only the data for the eight companies that generate most invoices which corresponds to more than 80% of the total invoices processed (Appendix 15- Companies which send most invoices). Appendix 16- Example on the data available on stagings shows the available data in the staging (in this case) SDP. As it may be seen, there is only data on the creation date and on the last modification. Consequently, there is no historical data on the time and numbers of processing each activity. Some measurements were done to mitigate such flaw. Nevertheless, it is advisable to take some more. While there are invoices that take thirty seconds to process, there are others that take more than ten minutes! Plus, with more measurements the data would be more robust. And, because it was not possible to measure, it is assumed invoices in staging SSN take as long to process as invoices in SDP. It is so, since SSN’s tasks are similar to SDP’s. Hereafter are presented the times related to performing each activity.
TABLE 1- PROCESSING TIMES IN STAGINGS
16
IP 2’13’’
SP 1’12’’
SDP 1’50’’/3’49’’
SSN 1’50’’/3’49’’
Also, it does exist detailed data on the invoice. Using it, it is possible to know which suppliers (or stores) send most invoices that do not meet the specifications, using a Pareto analysis. On Table 2- Percentage of invoices in SDP by supplier is provided an example. It provides numbers on the count of invoices in staging SDP, in the first three months of 2014. The numbers are presented as a percentage of the total count. Here are just presented the first ten suppliers.
TABLE 2- PERCENTAGE OF INVOICES IN SDP BY SUPPLIER
Supplier code Number of invoices (in
percentage of total)
Cumulative
number
Cumulative percentage
of suppliers
2004228 8,57% 8,57% 0,09%
2016723 4,60% 13,17% 0,19%
2001163 4,28% 17,44% 0,28%
2000957 3,10% 20,54% 0,38%
2003902 2,34% 22,89% 0,47%
2001171 2,15% 25,04% 0,56%
2022240 1,79% 26,83% 0,66%
2021660 1,73% 28,56% 0,75%
2028368 1,42% 29,97% 0,85%
2005013 1,35% 31,32% 0,94%
17 correct the balances, the value must be the decision variable to analyse. It is available on the appendixes (28 to 35) the lists resulting from the Pareto analysis of each staging. Plus, to check if the reasons for the invoices being sent without PO’s code were stores’
mistake, SDP was analysed and two things were concluded: 1) yes, there was a difference (in percentage terms) amongst different companies; 2) that difference corresponded very much to the difference of the number of invoices sent by each company. Appendix 20 shows the results.
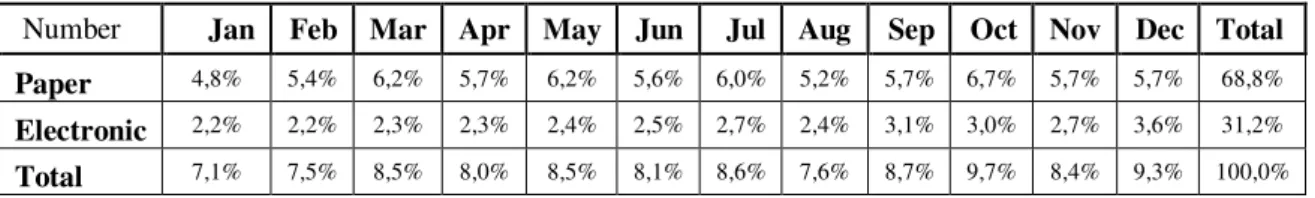
It was also analysed the type of invoice got during the year of 2013: electronic or physical. It was found that in the last month the number of invoices sent by paper still represented 61% of the total number of invoices – Appendix 18- in contrast with the 15% in the retail goods in the first eight months of 2012. As an electronic invoice only costs 0,036€ to process, against the 0,33€ for physical ones (Cardoso, 2012)4, this represents a major potential for cost cutting. On Appendix 19- Pareto analysis on the paper invoices by supplier is presented another Pareto analysis, this time on the number of physical invoices by supplier.
Next chapter will focus on the recommendations of measures to implement so that the problems discussed until now can be tackled.
Recommendations
“Knowing what to measure and how to measure it, makes a complicated world much less so” (Levitt & Dubner, 2005, p. 11)
The first and simplest recommendation it may be offered is to know what to measure so that it is possible to tackle the right problems with the right tools. As H. Davenport and E. Short put it, accurate measurement can serve as a baseline for future improvements
4Costs are presented until invoices are available to the Document Handler (see map’s process for more information
18 (Davenport & Short, 1990). Also, as explained by Hammer giving the example of
Ford’s reengineering of purchases’ process, one way to improve things might have been to help the accounts payable clerk investigate more efficiently, but a better choice was to prevent the mismatches in the first place (Hammer, Reengineering Work: Don't Automate, Obliterate, 1990, p. 2). In the next lines, it will be written about how to work with suppliers and control their performance. Then, a note on how to relate with internal players – stores and purchasing department – will be provided. The main goal is to tackle mismatches happening in the first place. Lastly, for these recommendations to make sense, they must add value, for which a scenario analysis will be offered.
Supplier Relationship Management
The next step towards procurement excellence is to adopt a value-driven orientation with external/supplier collaboration as a key cornerstone. Companies are now aware that they must integrate and collaborate with suppliers to remain competitive and achieve procurement excellence (PriceWaterCooper's House, 2013). Aligned with
PWC’s view, the first measure to be proposed is to present suppliers with an “on boarding” toolkit (Appendix 21). For the top auditing firm, to a SRM issue like “Lack
of formal business process resulting in inefficiencies”, corresponds the best practice:
“develop accompanying toolkit and templates to make SRM explicit”. Its main goal is to provide suppliers with a quick tool to know what they must comply with, regarding
19 day, key indicators5regarding supplier’s performance are analysed and 15 days later, a
second call is made. That is meant to assess supplier’s satisfaction, list his/her difficulties and listen to his suggestions. These days were thought to give suppliers time to have sufficient contacts with Sonae to enable a robust analysis. Since this is the first time the toolkit is implemented, these marks must be revised after six months.
Also, in order to tackle inefficiencies, it is suggested one more proactive attitude: an (Pareto) analysis on the type of error in each staging, by supplier. Such list has yet to be created since it currently does not exist. Also, it would be interesting to understand if there are suppliers who repeatedly charge above the agreed – the so called over billings.
“The lack of appropriate financial controls can contribute to substantial leakage of savings because services purchases are historically known for over-billing (…). Stradford and Tiura suggest in some service categories, over-billings are found on as many as 60 percent of invoices” (Institute for supply management, 2004, p. 3). Therefore, there may be opportunity for cost savings.
The measure, afterwards, is to contact the suppliers who send most invoices with errors and speak with them to prevent it from happening again. For example, in staging SDP into which go around 7806 invoices per month, convincing the first 1 % of suppliers could represent a decrease of 33% of invoices going to that staging. So, for these suppliers, the first and the second call of the “on boarding” toolkit would be made at the same time. The same modus operandi is suggested to convince suppliers who send physical invoices to start sending electronic ones. Such measure would also fit Sonae’s
5 Indicators would be presented in percentage of the number of invoices sent by the supplier and would be the
following: a) number of complaints, b) number of debits, c) number of log ins (absolute number) and d) number of invoices in the stagings and its reasons.
6 Exactly 779,92, which is the average of the number of invoices that went into that
20 Corporate Social Responsibility (CSR) strategy for it wants to be a reference in environmental terms (Azevedo, 2011).
Finally, it is suggested that at the time of the Master Services Agreement (Contracto Geral de Fornecimento), Service-Level Agreements (SLA’s7) are signed. For each mistake attributable to the supplier, an “administrative cost” would be charged. It would serve as a sufficient incentive for him/her to comply with the process requirements. It has the additional advantage of having been agreed by him/her. One other possible measure would be to assess the costs related to each error and check if for each supplier there was another who despite having higher nominal prices, would have a lower TOC. The reason why Sonae discourages this is for it deals with many internal suppliers. In the end, it is as Hammer says: attitudes toward vendors have to change. They can no longer be seen as adversaries. Instead, they have to become partners in a shared business process (Hammer, Reengineering Work: Don't Automate, Obliterate, 1990, p. 9).
Internal Player Relationship Management Customer:
As this process exists to lift administrative load off of stores it is important that stores’
responsible are satisfied and the process does not fail. “Managers cannot know how good their services are until they ask the customers” (Kueng, 2000, p. 74). Thus, and assuming that this process serves internal customers, it is suggested to regularly perform surveys to assess their satisfaction, difficulties and suggestions. It is important to keep feedback and communication open. A simple measure to implement, for instance, would be to identify the most common urgent purchases and turn their approval automatic or unnecessary. Basically, if a requestor calls directly to a supplier, he/she has
7 A service level agreement describes the performance which needs to be delivered by the supplier. Key performance
21 an implicit approval of his/her superior. Also, there are some services that by their nature will always deliver a price divergence (for example, water or energy supply). For them, an automatic acceptance of the price divergence would lower store’s work and
fasten the process. Many other small measures may be implemented if the fish bone diagram is deeply analysed and Kaizen philosophy followed. Appendix 24- Kaizen table has some simple measures that could be undertaken.
From the interviews, it was found that people do not understand the importance of some tasks and the consequences of not processing them. Also, people in the office sometimes do not get how hard it is to manage a store, its bureaucracy and its tightened schedules. Therefore it is suggested to offer employees swapped visits. Office personnel would visit a store, while stores’ workforce would get in touch with DSA’s work. Such
measure might also add novelty and help to engage the workforce, hopefully increasing motivation and productivity.
Garcia and Barroso say “little doubt is left about the necessity of creating engagement in organizations8 and the increase in productivity depends on that commitment” (Garcia &
Barroso, 2014). To have the project’s importance emphasized by the board of directors, to share success stories and to poll employees are three of the top ten ways to keep employees engaged according to Kristin Caplice from Corporate Responsibility Magazine (Caplice, 2011). The latter was already suggested. The former two must follow it. It is argued that by sharing how Sonae has been able to save x money by decreasing missing receptions, people will feel their work is valuable and important, consequently performing it better. Actually, as put by José Corte-Real, Sonae’s HR
manager, “Sonae tries and continuously reinforces the engagement of their people,
8Felipa Oliveira Serrão, Hay Group’s director says “engagement involves more than a mere contractual relation; it
involves more and goes beyond what is expected, and in that sense it works as the basis of the increase in
22 celebrating, communicating and sharing their success and results” (Garcia & Barroso, 2014). They must apply the same principle to this process’s main successes. Another technique that may be applied is positive competition or ‘gaming’, which has been having greater and greater acceptance9. “Companies are more and more using it as a technique to increase the engagement amongst employees and their work. Even Deloitte uses it in its Leadership Academy” (Neves de Almeida | HR Consulting, 2014, p. 2). The suggestion is then, to create lists of the stores which comply best with the process
and turn them public (to Sonae’s collaborators). In the end, the best store would be awarded a symbolic (or not so much) prize. Moreover, it could be agreed with stores a penalty for each mistake (like missing reception) which would work as an incentive not to fail, much like SLA’s. Such revenues could be applied into Sonae’s CSR strategy.
Purchasing departments:
Although it is not this office’s responsibility and it is rather out of its sphere of power, there must be control measures towards purchasing departments. Since they have so much responsibility, they cannot fail. A measure at DSA’s reach is to get the right data on the invoices that deliver errors and that are purchasing departments’ responsibility. As a result, it would be able to communicate how important it is that those departments perform well with supporting data and ask for better delivered work.
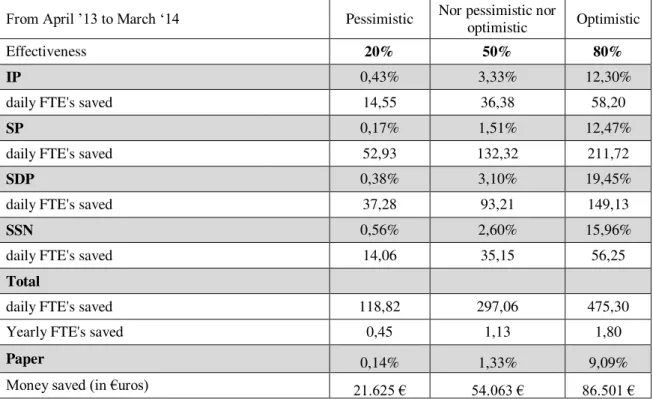
Potential Gains
On page 23 is presented a table with three scenarios presenting the potential savings which could be achieved with the aforementioned measures. The effectiveness is measured in terms of the number of invoices with errors reduced. So, a 20% effectiveness would mean that stagings would receive less 20% of invoices. The
9“According to Freebase, gaming is the implementation of a game design thinking, in non-game contexts, in order to
make them funnier and more captivating. Is has been gradually more used to motivate teams, encourage friendly
23 number on each grey row represents the percentage of the total number of suppliers whose invoices represent the effectiveness. So, for the staging IP the top 20% of suppliers who send most invoices represent just 0,43% of the total number of suppliers. TABLE 3- POTENTIAL GAINS
From April ’13 to March ‘14 Pessimistic Nor pessimistic nor optimistic Optimistic
Effectiveness 20% 50% 80%
IP 0,43% 3,33% 12,30%
daily FTE's saved 14,55 36,38 58,20
SP 0,17% 1,51% 12,47%
daily FTE's saved 52,93 132,32 211,72
SDP 0,38% 3,10% 19,45%
daily FTE's saved 37,28 93,21 149,13
SSN 0,56% 2,60% 15,96%
daily FTE's saved 14,06 35,15 56,25
Total
daily FTE's saved 118,82 297,06 475,30
Yearly FTE's saved 0,45 1,13 1,80
Paper 0,14% 1,33% 9,09%
Money saved (in €uros) 21.625 € 54.063 € 86.501 €
It is important to note that each measure must be implemented independently and at different times so that its efficacy may be measured with as less things as possible interfering in it. It may be argued because not all solutions are implemented at the same time there will be an opportunity cost. Yet, while it may be true, such approach delivers robustness to each measure and allows assessing whether there are ineffective ones. The cause effect diagram should be followed and drawn frequently so that new or more causes are known and can be tackled. Also, it must be drawn one that assesses a positive (desirable) effect to know which measures may lead to what we want to achieve.
24 systems processes and so on, through more subtle, ongoing changes and continuous improvements (MEP Profitability in Manufacturing). That is what kaizen10 represents. Sonae has been awarded with the Kaizen Lean 2013 prize which is attributed to companies who are able to implement continuous improvement systems (2014). Nevertheless, it is reinforced Kaizen’s importance and how Sonae’s teams must
continue to apply such philosophy, since many small changes are not worthy of a research project but can actually add much value. Also, often in companies are processes not clearly designed such as organizational lines are. Processes are invisible and nameless because people think in individual departments and not in the process as a whole. Processes also tend not to be managed since people respond to departments but no one is accountable for the whole process (Hammer & Champy, Reengineering the corporation, 1993). As a result, there is margin for global goals to be set so that an absolute maximum may be achieved. Otherwise, each team will optimize its processes and achieve local maximum which may lead to sub-optimization. “In one manufacturing
company studied, for example, no one had ever analysed the elapsed time from a
customer’s order to delivery. Each department felt that it had optimized its own performance, but in fact the overall process was quite lengthy and unwieldy”
(Davenport & Short, 1990). "A business process needs to have a manager who has end-to-end responsibility of the process" (Kohlbacher, 2010). Therefore, it is recommended that DSA delegates such responsibility to a specific one.
Conclusion
The main findings were that this process’s results, not only depended on other people, but also existed to correct inefficiencies that might appear. The most influential causes
25 for ill balances to happen, are payments that are done manually - and so out of the normal process - and invoices that take long to be processed, since they do not follow automatically for payment. “Reception missing”, “PO not processed” or “purchasing department delay” are a few of the most critical causes. All of which are related to some
extent to people’s behaviour. Supplier’s mistake is also a relevant cause. Plus, it was found that the data on the stagings had been ill assessed. Yet, by tackling problems upstream, the workload in the process would lower significantly. Hence, it is suggested Sonae provides suppliers with a toolkit and contact the ones most responsible for invoices with errors in the stagings, assuming a more proactive attitude. SLA’s should
also be agreed with them, so that for each supplier’s mistake an administrative cost is
charged. In a more internal perspective, Sonae should foster positive competition and engage its co-workers. It should communicate successes related to this process and turn public a list of the stores which comply best with the process. Also, the control over the purchasing departments should be tightened. Finally, there “is always room to make
small improvements, (…) through more subtle, ongoing changes and continuous improvements” (MEP Profitability in Manufacturing, p. 1). Teams should meet regularly to assess inefficiencies and its causes and to brainstorm possible subtle yet impactful solutions. For this, and to set goals for the whole process instead of setting them locally, an end-to-end responsible for the process should be assigned.
If executed effectively, Sonae could benefit well from these measures. In a pessimistic scenario, where only 20% of effectiveness is reached, it could save 0,45 yearly FTE’s
26
References
Aytulun, S., & Guneri, A. F. (2008). Business process modelling with stochastic networks. International Journal of Production Research.
Azevedo, P. (2011). Sonae's CEO. A responsabilidade Social na Sonae.
Bloomberg, L. D. (2012). Completing Your Qualitative Dissertation: A Road Map From Beginning to End. SAGE Publications, Inc.
Caplice, K. (2011). Top 10 Ways to Keep Your Employees Engaged in Your Training Programs. Recuperado el 2014, de http://www.thecro.com/.
Cardoso, B. M. (2012). EDI e a Fatura Eletrónica Redes Colaborativas e Desmaterialização. Porto.
Chenoweth, M. E., Moore, N. Y., Cox, A. G., Mele, J. D., & Sollinger, J. M. (2012). Best practices in Supplier Relationship Management and their early implementation in the Air Force Materiel Command.
Constant Contact. (1996). Sample Survey Questions, Answers and Tips.
Costa, E. G. (2013). Desenvolvimento de processos de negócio em empresas industriais. Davenport, T. H., & Short, J. E. (1990). The New Industrial Engineering: Information
Technology and Business Process Redesign.
Garcia, P. C., & Barroso, T. A. (April de 2014). A força do Engagement. Human Resources Portugal, págs. 22-31.
Hammer, M. (1990). Reengineering Work: Don't Automate, Obliterate. Harvard Business Review, 104-112.
27 Iarossi, G. (2006). The Power of Survey Design: A User's Guide for Managing Surveys,
Interpreting Results, and Influencing Respondents. World Bank Publications.
Institute for supply management. (2004). Reducing the costs of purchased services. Khan, I. A. (2011). Kaizen: The Japanese Strategy for Continuous Improvement. VSRD
International Journal of Business & Management Research, 177-184.
Kohlbacher, M. (2010). The effects of process orientation: a literature review. Business Process Management Journal, 136-152.
Kruse, K. (Jun de 2012). What Is Employee Engagement. Forbes.
Kueng, P. (2000). Process performance measurement system: A tool to support process-based organizations. Total Quality Management, 67-85.
Levitt, S. D., & Dubner, S. J. (2005). Freakonomics. Penguin.
McInerny, D. Q. (2004). Being Logical, A guide to good thinking. Random House. MEP Profitability in Manufacturing. (s.f.). Kaizen - Gaining the full benefits of
continuous improvement.
Neves de Almeida | HR Consulting. (March de 2014). A gamificação do engagement. HR Buzz.
Nigel Hill, J. A. (2006). Handbook of Customer Satisfaction And Loyalty Measurement. Gower Pub Co.
Norton, R., & Kaplan, D. (2004). Balanced scorecard : mapas estratégicos. Harvard Business Scholl Press.
28 Prémios Kaizen Lean 2013 distinguem empresas em Lisboa. (15th de April de 2014).
Logística Moderna.
PriceWaterCooper's House. (2013). Supplier Relationship Management. How key suppliers drive your company's competitive advantage.
Qualtrics. (January de 2013). Survey Questions 101: Do You Make any of These 7 Question Writing Mistakes? Recuperado el March de 2014, de www.qualtrics.com.
Remenyi, D. (1998). Doing research business and management: an introduction to process and method. SAGE.
Schippers, W. (1999). The Process Matrix, a Simple Tool to Analyse and Describe Production Processes. quality and Reliability Engineering international, 469-473.
Sharp, A., & McDermott, P. (2009). Workflow modeling: tools for process improvement and application development. Artech House Publishers.
Sonae. (February de 2014). Obtenido de www.sonae.pt.
Sonae inova na gestão documental. (4th de April de 2014). iPress Journal i. Stake, R. E. (1995). The art of Case Study Research. SAGE Publications. Survmonkey. (2014). Obtenido de www.survemonkey.com.
Weele, A. J. (2010). Purchasing and Supply Chain Management. Cengage Learning. White, S. A. (2004). Introduction to BPMN. BPTrends.
29
Appendixes I
30
31
32
Appendixes II
Introduction
APPENDIX 4- SONAE'S HOLDINGS
APPENDIX 5-SONAE'S HISTORY
Some important dates in Sonae’s history:
1959: Sonae’s year of birth
1978: Sonae’s employees went on a strike in favour of the patronage against the
Government will to nationalize it
1983: IPO in an operation worth of 2.493M €.
1985: Opening of the first of its kind hyper market in Portugal – the Continente in Matosinhos. As said by Sonae, this moment marks the beginning of Sonae distribuição (distribution), the result of a joint-venture between Sonae and Promodès. So that on understands better the reach of this moment, people would take pictures in front of this store and would even pick-nick on its parking lot. This clearly shows the relevance this
opening has in Sonae and Portugal’s history as well as on how disruptive it was in relation with how things had been done, until then.
33
Investment on the specialized retail (MaxMat, Max Office, Inventory, Sportzone, etc)
Opening of Health Clubs Solinca 1997:
Opening Colombo Shopping, the biggest in Iberian Peninsula
Entry in specialized retail in Spain
1998: Launch of its telecommunication brand Optimus – third mobile operator in Portugal. Although a small market, Optimus reaches a 15% market share in its first year.11
2005: Sonae Distribuição Brasil sold to Wall-Mart. 2010: Launch of the new corporative image.
Figure 1- Sonae’s new corporative image12
2014: Partnership with ZON in the telecommunication sector
11 Sonaecircle
34
Problem definition
Organogram
APPENDIX 6- ORGANOGRAM
Open items
APPENDIX 7- NUMBER OF OPEN ITEMS
Date Count of open items % in relation to the total of invoices processed in 2013
31-03-2013 89762 24,4%
30-04-2013 91452 24,9%
31-05-2013 92161 25,1%
30-06-2013 82360 22,4%
31-07-2013 82188 22,3%
31-08-2013 80949 22,0%
30-09-2013 82649 22,5%
31-10-2013 71662 19,5%
30-11-2013 61067 16,6%
35
31-01-2014 67667 18,4%
28-02-2014 64197 17,5%
31-03-2014 66788 18,16%
APPENDIX 8- VALUE OF OPEN ITEMS
Date Sum of open items % in relation to the total of invoices processed in 2013
31-03-2013 -124.069.964,24 € 4,40%
30-04-2013 -133.336.104,22 € 4,73%
31-05-2013 -139.399.083,60 € 4,94%
30-06-2013 -251.009.661,54 € 8,90%
31-07-2013 -266.673.480,41 € 9,46%
31-08-2013 -264.659.176,09 € 9,39%
30-09-2013 -261.237.797,19 € 9,26%
31-10-2013 -236.440.819,25 € 8,38%
30-11-2013 -230.265.890,00 € 8,17%
31-12-2013 -306.320.393,51 € 10,86%
31-01-2014 -253.729.949,61 € 9,00%
28-02-2014 -236.316.965,11 € 8,38%
31-03-2014 -240.582.924,52 € 8,53%
36
Results and discussion
APPENDIX 10- MAP OF THE OFFICE
Painted are the teams who have to do with the process of invoices of service’s suppliers.
In pink is the team who separates the invoices by company. Next to it, in green, are the people who digitalize all the invoices. The process of inserting the data on the system is completed on the team in yellow validates the data it has read. These three teams are
shared with retail goods’ suppliers. In purple are all the 12 people who correct the errors
37 more team whose office is not this that deals with the invoices in staging SSN. In grey
are all the team who either deal with retail goods’ suppliers or are out of this study’s
scope.
APPENDIX 11- MAP'S RULES
Pools are designed to make clear which processes depend on whom. So, for each pool, there is a person or a team responsible for the activities. Moreover, it was used the Business Process Modelling Notation (BMPN) to design the process. Based on such notation, it may be defined three groups of elements: flow objects, connecting objects and artefacts, which are all presented hereafter.
Flow objects:
Event: it is symbolized by a circumference and it is meant to describe something that either triggers the process or finishes it. Below are explained the three different types of events and the figures that correspond to each other.
Activity: It is symbolized by a rectangle and describes what task or work the company performs at that stage. A set of activities is what makes a process.
Gateway: when a decision needs to be made, or there is either a divergence or convergence of paths, a diamond shape is drawn, as shown below.
FIGURE 2 - FROM LEFT TO RIGHT: "START EVENT", "INTERMEDIAT EVENT" AND "END
EVENT" AND ACTIVITY AND GATEWAY
38 Sequence flow: it is probably the most used connecting object as it is used to represent the flow that objects follow as well as the order which each activity in the process will be performed
Message flow: it is represented as a dashed arrow and as the name explains, represents a message flow.
FIGURE 3 - SEQUENCE FLOW AND MESSAGE FLOW OBJECTS
Artefacts:
Data objects: Data may be produced, sent or received within an activity. This object is meant to represent such occasions.
Group: Sometimes it is useful to group activities to make an annotation or simply for analysis purposes.
Annotation: This object is used to provide additional information on any activity
FIGURE 4- FROM LEFT TO RIGHT: DATA OBJECT, GROUP AND ANNOTATION
Then, as this is a swimlane diagram there are two other objects. “BPMN supports
swimlanes with two main constructs: pools and lanes
”
(White, 2004, p. 4).
Each one39 FIGURE 5- A POOL WITH TWO LANES
Finally, the horizontal scale is time. However, a note must be made: although if two activities are placed on top of each other means that they are performed at the same time, the scale is not constant, consequently the length of a flow object does not represent time, i.e. a greater arrow does not mean a bigger wait until an activity is to be performed; nor can it be concluded that if a square’s activity is bigger (or smaller) than
other square, its activity takes longer (or less time) to perform.
APPENDIX 12- PROCESS CHARACTERIZATION (SHARP & MCDERMOTT, 2009)
General process characteristics Sonae’s process characteristics
Process name in verb-noun format Process invoices
Event that triggers the business process Need for a MRO good
Result achieved by the process Invoice accountability
Customer that receives the result Store’s responsible
Other stakeholders and the result(s) they expect Suppliers who expect the invoice to be accounted quickly so that they are paid efficiently
About five to seven major activities or milestones
within the process Processes on each staging, registration, PO
Actors with a role in the process Requestors, Approvers, Suppliers, DSA.
Mechanisms (systems, forms, equipment, etc.) that
support the process SAP SRM, computers, Portal, Kofax
Process timing and frequency …
Related (but out-of-scope) processes depicted on an
40 APPENDIX 13- INTERVIEW’S STRUCTURE
Objectivos:
Medir a diferença entre importância e satisfação.
Melhorar a experiência de SRM para que lojas e DSA se sintam mais satisfeitos Perceber dificuldades
E ouvir sugestões
Apresentação
Idade Género
Nº de anos na empresa e função Identificação da loja: Código da loja
Caracterização do perfil de utilizador do SRM:
Qual é a sua responsabilidade no uso do SRM: [requisitante, aprovador, comprador, outra]. Qual?
Há quanto tempo está responsável por usar o SRM? Quantas vezes usa o SRM por semana?
Quanto tempo costuma passar no SRM por semana?
Como é que aprendeu a usar o SRM? Formações específicas, auto-aprendizagem, o antigo responsável ensinou-me; ainda não sinto que saiba usar; outro
Já teve formações de SRM? Quantas? Seria útil ter tido mais?
Já alguma vez se enganou a preencher o PO? Qual foi a razão?
Satisfação e importância:
41 no SRM; Facilidade com que faz um Pedido de compra; rapidez com que é aprovado; Poder comprar dentro de catálogo; seleccionar a categoria do artigo em compras fora do catálogo. Há alguma característica à qual atribuísse uma importância maior que 5 e que não esteja mencionada? Se sim, Qual?
Quão fácil ou difícil é a navegação no SRM?
Com que frequência é que o SRM pára de funcionar ou fica indisponível?
Sente que os serviços administrativos percebem as suas necessidades quanto ao processo de PO?
O SRM veio ajudar nos processos de Pedido de Compra? De forma geral quão satisfeito ou insatisfeito está com o SRM?
No geral, prefiro a maneira como se processa um Pedido de Compra agora em vez de como se processava antes do SRM?
Classifique agora em termos de satisfação as seguintes características: Diminuição de carga administrativa; tempo no SRM; nº de vezes que tem que aceder ao SRM; nº de operações no SRM; Facilidade com que faz um PC; rapidez com que é aprovado; Poder comprar dentro de catálogo; seleccionar a categoria do artigo em compras fora do catálogo;
Classifique agora em termos de satisfação a característica que mencionou acima como tendo importância maior que 5 mas que não estava mencionada na lista (por favor ignore esta pergunta se não considerou nenhuma característica)
Dificuldades:
Classificar de pouca dificuldade a muita dificuldade, cada um dos itens: Pouco intuitivo; lento; falta de tempo; pouco prioritário; dificuldade em saber o que fazer; não vejo interesse em usar SRM; Fazer compras fora do catálogo; seleccionar a categoria do artigo em compras fora do catálogo
Sente outras dificuldades que não estavam listadas acima? Quais?
Qual a percentagem de Pedidos de compra que tem que fazer fora do catálogo? Sabe para que serve o texto descritivo quando faço um PO?
O texto descritivo é-lhe útil quando faz um PO?
42 Gostaria de acrescentar alguma coisa que ache importante e que ainda não tenha sido mencionado?
Gostaria de partilhar alguma sugestão que tenha em relação ao SAP SRM?
Agradecimento:
Muito obrigado pelo seu tempo.
Note: For the interview’s structure, it was used resources from: a) Iarossi, 2006; b) Hill, 2006; c) Qualtrics, 2013; d) Constant Contact, 1996 and e) survemonkey’s website.
APPENDIX 14 - SUMMARY OF INTERVIEWS
Formal interview Informal feedback
Variables Employee 1 Employee (s) 2
Importance
Decrease of administrative tasks Time spent on SRM
Number of accesses to SRM Number of operations Ease to issue a purchase order Quickness of approval Option to buy from catalogue
Select the correct category in the catalogue
Satisfaction
Decrease of administrative tasks Time spent on SRM
Number of accesses to SRM Number of operations Ease to issue a purchase order Quickness of approval Option to buy from catalogue
Select the correct category in the catalogue
Difficulties
SRM is little intuitive SRM is slow
lack of avilable time SRM's tasks are less priority
issue a pruchase order outside the catalogue
Select the correct category in purchases outside the catalogue Issuing urgent requests
43 APPENDIX 15- COMPANIES WHICH SEND MOST INVOICES
Company's code Number of invoices (in percentage of total) Cumulative number
Cumulative percentage
companies
D143 40,0% 40,0% 1,2%
C500 13,1% 53,2% 2,5%
S744 6,0% 59,1% 3,7%
C397 5,6% 64,8% 4,9%
C330 4,7% 69,4% 6,2%
D383 4,0% 73,5% 7,4%
C380 3,8% 77,3% 8,6%
C324 3,4% 80,7% 9,9%
APPENDIX 16- EXAMPLE ON THE DATA AVAILABLE ON STAGINGS
Dt criação Nome
usuário Ult. actua
Estado msg
Estado
msg Rejeitada Usuário
Referê ncia
02-01-2013 LMAMARAL 23-05-2013 A E X CSILVA 303231790
Data da Factura Cod.For nec Nome do Fornecedor NºContri b Contr
Cli Empresa
Dt Entrega Merc Tot Linhas
2012-10-14T00:00 2008451
PÚBLICO - COMUNIC AÇÃO SOCIAL, SA PT50226
5094 PT503246468 C324
2012-12-24T00:0
0 120
MOnt Trib Tot
Impost Ret. Fonte Imp.Sele Tot Fact Notas Barcode
Centr o cst
120 27.60 0.00 0.00 147.60 324E00097 CC 20120132400302
40
-
Comparison between electronic and paper invoices APPENDIX 17- NUMBER OF INVOICES
Number Jan Feb Mar Apr May Jun Jul Aug Sep Oct Nov Dec Total
Paper 23514 26232 30243 27979 30154 27380 29014 25376 27602 32659 27614 27723 335490 Electronic 10914 10526 11292 11072 11514 12077 12963 11529 15056 14577 13164 17382 152066
44 APPENDIX 18- PERCENTAGE OF TOTAL INVOICES
Number Jan Feb Mar Apr May Jun Jul Aug Sep Oct Nov Dec Total
Paper 4,8% 5,4% 6,2% 5,7% 6,2% 5,6% 6,0% 5,2% 5,7% 6,7% 5,7% 5,7% 68,8% Electronic 2,2% 2,2% 2,3% 2,3% 2,4% 2,5% 2,7% 2,4% 3,1% 3,0% 2,7% 3,6% 31,2% Total 7,1% 7,5% 8,5% 8,0% 8,5% 8,1% 8,6% 7,6% 8,7% 9,7% 8,4% 9,3% 100,0%
APPENDIX 19- PARETO ANALYSIS ON THE PAPER INVOICES BY SUPPLIER
Supplier's name
Number of invoices (in percentage of
total) Cumulative number Cumulative percentage companies MODELO CONTINENTE HIPERMCERCADOS,
S.A 5,22% 5,22% 0,02%
OPTIMUS COMUNICAÇÕES, SA 3,68% 8,90% 0,03%
ENDESA ENERGIA SA (PORTUGAL) 2,67% 11,57% 0,05%
LINCE TELECOMUNICACIONES, S.A 2,00% 13,57% 0,07%
S.P.A.S.T. - SOC. PORT. ALUGUER E SERV.
TÊXTEIS 2,00% 15,57% 0,09%
EUROPCAR INT.ALUGUER AUTOMOVEIS,LDA 1,98% 17,54% 0,10%
TELEFONICA DE ESPANA, SA 1,83% 19,37% 0,12%
PT COMUNICAÇÕES, SA 1,63% 21,00% 0,14%
ENDESA ENERGIA, S.A. 1,54% 22,54% 0,15%
NESTLE WATERS DIRECT
PORT.-COM.DIST.PROD.ALIM., SA 1,37% 23,91% 0,17%
APPENDIX 20- ANALYSIS ON THE INVOICES IN SDP BY STORE
Ano 2013
Company Invoices in SDP Total invoices processed
D143 55,43% 50,3%
C500 13,73% 16,0%
S744 8,48% 7,3%
C397 7,29% 7,0%
C330 6,44% 5,7%
D383 4,55% 5,0%
C324 2,44% 4,1%
D380 1,63% 4,6%
Total 100,00% 100,00%
TABLE 4 STAGING SDP - ANALYSIS BY STORE Recommendations
54 APPENDIX 24- KAIZEN TABLE
Problem Possible solution
EDP invoices: the last page may be a credit note instead
which cannot go to trash workshop to the Separation team Many times, an invoice is not automatically processed since a
PO has many lines and the system cannot know to which line the invoice corresponds. It often happens with monthly agreements
Allow the system to read the number of the line in each PO
Supplier's code is wrong "Close" the old supplier's code so that it is not na option
invoices from water suppliers do not mention PO's code but the counter's number
Uniformize the way the purchase order is issued, so that in the description text comes mentioned the counter's number. Ideally, each store would associate the PO's code with the counter's number Receptions made with dates ahead of today's Do not allow on the system
There are small errors that are identified by the employees. However, since there's no end-to-end responsible for the process, there is no one they identify as someone they could communicate such errors and so they keep happening
Assign an end-to-end responsible
When a supplier has a problem (the same problem but for different stores), stores are called to call the supplier and call
us afterwards. Call directly to the supplier
Budgets are asked with VAT included. workshop to requestors - Budgets must be aske without VAT included PO's issued for old supplier's fiscal number Close the old fiscal number
Monthly agreements being charged a higher value than what
is agreed Since it is a monthly agreement, it is important to contact suppliers to correct the situation
PO for suppliers who are not created on the system When a PO is sent to a new supplier, a message must be sent to the responsible to create the supplier on the system
Suppliers call directly to employees instead of using the
official channel Understand why this happens and correct the situation Water or energy supply invoices always deliver a price
divergence Turn them automatically accpeted
Too many missing reception Make a list of reception that are predicted to occur soon and contact the store to assure they make them, in a more proactive attitude
Communication between teams is little clear Create norms for communication In the staging SSN, people make the same analysis as the
people in staging SDP
Create a norm so that only one team performs that task
Sometimes na invoice is cancelled and when months later na
employee wants to know why, he can not Make mandatory na explanatory note on the reason of such cancellation Employees must resend many times the same email for stores'
responsible who have not replied to a correction request Create a tool which automatic sends na email to people who have not replied yet the catalogue has outdated prices Outdate prices
Purchasing departments do not mention the store's code workshop to purchasing departments to mention store's code
Energy supply invoice does not have the PO's code mentioned Ask the supplier to send the invoice to the store who would add the PO's code and send it to this office