A Work Project, presented as part of the requirements for the Award of a Masters Degree in
Finance from the NOVA – School of Business and Economics.
Portuguese Commercial Banking: An Assessment of
Competition in the 1960-2013 Period.
Filipa Santos Machado
Student Number 641
A project carried out on the Finance course, under the supervision of:
Professor Luciano Amaral
Portuguese Commercial Banking: An Assessment of Competition in the 1960-2013 Period.
Abstract
Strong consolidation is one of the most evident developments of banking markets around the world
in recent decades. This change is raising questions on how and to what an extent competition is
affected by the expansion of the largest banks. The aim of the present study is to measure the degree
of competition in the Portuguese commercial banking market in the long-run, during the period
ranging from1960 to 2013, by using the non-structural model developed by Panzar and Rosse.
The main findings are that the Portuguese banking system, despite the legal restrictions in place,
operated mostly in a market with some degree of competition and, at some points in time, presented
some interesting competitive features. More recently, it has evolved into functioning as a cartel.
Keywords:Commercial Banking; Portugal; Competition; Panzar-Rosse.
Introduction
The last thirty years saw an unprecedented process of liberalisation and deregulation in the European
banking industry. But one of the most prominent developments has been the change in market
structure as a result of strong consolidation. This has been characterised by a sharp fall in the number
of banks, increased concentration, and the grown size of the largest banks.
Portugal has not been an exception. After a long period of tight rules designed to hinder competition,
the Portuguese banking system has finally undergone a period of liberalisation. However, the
Portuguese banking system is a unique case in Europe for two main reasons: because it evolved
from being Government-owned to market-driven, and because this change has been accompanied
under analysis: from 1960 to 1975, a period that, according to the literature, is expected to have had
some degree of competition; from 1975 to the mid-1980s, corresponding to the nationalised
banking system period, in which no significant competition in the market is expected; and the last
period, from mid-1980s to 2013, when a high degree of competition in the market is expected, as it
corresponds to the liberalisation period. The latest period has also seen a significant decrease in the
number of banks, especially at the beginning of the twenty-first century, as a result of an intensive
activity of mergers and acquisitions. How has competition evolved during these different periods?
Are the institutional shocks a reason for the changes on the competitive environment or have they
had no impact on competition? Is the increase in concentration a sign of a decrease in competition?
The purpose of the present study is to measure the degree of competition in the Portuguese banking
market in the period from 1960 until 2013 by using a common method – the Panzar-Rosse (P-R)
model. This model has many advantages when compared with the traditional
structure-conduct-performance (SCP) measures of concentration, such as the Herfindahl-Hirschman index and the 𝑘
Bank Concentration Ratios. The Panzar-Rosse model is the most suitable model in this case
because it uses bank-level data; has relatively low data requirements, which is an advantage when
data constraints are a problem, especially in long-term studies; and is easy to estimate by means of
regression. An additional advantage is that it is relatively easy to replicate in other cases, something
that is important for international comparisons.
This paper intends to be a contribution to the literature on Portuguese banking competition by
covering a long-term period and by providing evidence on how competition has evolved during
these years according to different types of regulation. It constitutes a guide for decision-makers,
regulators and Government authorities, and is an innovative contribution to the general debate on
competitive issues not only in Portugal but also in other countries. Several authors applied the P-R
approach to study the competitive environment in the banking sector but only a few studies are
Boucinha and Ribeiro (2009) have contributed to the literature on Portuguese banking competition
but did not cover such an extensive period. Amaral (2015) focused on the analysis of commercial
banks between 1960 and 1973 and found evidence of monopolistic competition in the market
without excluding perfect competition. Boucinha and Ribeiro (2009) studied the competitive
environment of the largest Portuguese banking groups in the 1991-2004 period and also arrived at
the same conclusions. Due to the size of the time period under scrutiny, it is only possible to focus on
the commercial banking activity. Conscious of the implications that it can bring to the final
interpretation of the results, especially in the 1990s when dozens of new and specialized institutions
started to arise, the current paper finishes with a note for a further and a more complete investigation
on the topic.
The remainder of the paper is organized as follows. Section I presents the literature review on the
main features of Portuguese banking legislation between 1960 and 2013, with special attention to the
degree of concentration in the market. Section II presents the empirical methodology employed and
data. Results are shown in section III and section IV concludes.
I. Literature on Portuguese Banking Regulation
The Portuguese banking system constitutes an interesting case to analyse because it has experienced
remarkable transformations in the past fifty years and because it was given an almost complete fresh
start during the 1990s and the early twenty-first century. This was the result of a vast privatisation
process that took place in that period and which, in turn, was the result of a nationalisation period,
starting in the mid-1970s. Consequently, the Portuguese banking system was subject to two great
institutional shocks: nationalisation, first, and privatisation afterwards. Therefore, it is possible to
divide the period under analysis into three obvious sub-periods with different implications for the
At the beginning of the first sub-period, from 1960 until the mid-1970s, there were twenty-two
commercial banks operating in Portugal, without taking into account Caixa Geral de Depósitos,
which was a bank of the state (Valério, 2010). The banking sector was very heavily regulated and
the central legal piece was Decree-Law 42461 of 12th November 1959. As can be seen from Table I,
and according to this institutional setting, banks had a very limited freedom to act (Amaral, 2013).
Despite the legal boundaries in place, Amaral (2013) defends that Portuguese commercial banks
found various ways to circumvent the law and to compete with each other through the growth of
time deposits and geographical expansion. The value of the Hirschman-Herfindahl Index (HHI), a
measure of market concentration, for assets and deposits in the Portuguese commercial banking
market in 1960 was 14% and 15%, respectively (Figure I). The meaning of this value in terms of
market concentration has no direct interpretation but the guidelines of the US Department of Justice
(2010) created a benchmark, defending that an HHI between 15% and 25% corresponds to a
moderately concentrated market. The degree of concentration fell in 1973 to 9% in the case of assets
and to10% in the case of deposits, representing the lower value of concentration in the Portuguese
banking market.
The second sub-period, from the mid-1970s until the mid-1980s, is marked by the nationalisation
process previously referred, in the sequence of a revolution that took place in 1974. The most radical
transformation of this process occurred in 14th March 1975 when Decree-Law 132-A/75 ordered the
nationalisation of all credit institutions based in Portugal1. The constitutional rule of irreversibility of
nationalisation and of prohibiting the formation of private credit institutions by Law 46/77 of 8th July,
also known as Law of Delimitation of the Public and Private Sectors, has maintained during the
following years the majority of the Portuguese banking system under the direct control of the state.
Entry in the market was also banned by the 1976 Constitution which prohibited the private
1
Exceptions: three branches of foreign commercial banks –Banco do Brasil, Bank of London & South America and
Crédit Franco-Portugais–, nineteen savings banks, and the system of mutual agricultural credit banks (Valério,
ownership of banks2, as shown in Table I. In principle, these institutional factors should lead to a
situation of almost no competition in the market, an opinion defended by Pinho (2000).
In the third sub-period, starting in mid-1980s, the system was opened to private property, and
barriers to entry were gradually dismantled, culminating in a complete integration into the fully
liberalised European Internal Market in 1993. The Law 11/83 of 16th August 1983 granted the
Government legislative authorisation to review the Law of Delimitation of the Public and Private
Sectors, in order to end with the restriction of private initiative. The formation of private commercial
banks was governed by Decree-Law 51/84 of 11th February, presented in detail in Table I. However,
the privatisation process was only formalised with the 1989 constitutional revision, which ended
with the irreversibility of the 1975 nationalisations, and allowed for the reprivatisation of banks that
were previously nationalised (Valério, 2010). This period was also accompanied by the entry of new
private banks in the market, as referred in Table II. After the privatisation process, two banking
institutions remained under state control: Caixa Geral de Depósitos and Banco Nacional
Ultramarino.
The current sub-period is described by Pinho (2000), who studied the evolution of market power and
non-price competition during the deregulation process, as a period of increased competition.
Because of the interest rate restrictions still in place, the new banks opted to use non-price
instruments to gain market share. Consequently, branching expansion became the main source of
competition and advertising expenditures turned out to be increasingly important, something that did
not happen in former periods. Barros and Modesto (1999) present a similar view by defending that
there was strong competition for market share based on services quality and creation of new
products, which was only intensified by the price competition initiated after liberalisation of the
interest rates, occurred in the mid-1990s. With its entry into the EC, Portugal undertook a series of
2
liberalisation policies as a result of the new political commitment towards the creation of an
economic system free from all remaining controls. Therefore, in the mid-1990s banks started to
carry out their business in a full market environment where interest rate setting was free and credit
ceilings3, a system of credit quotas that was in effect during the 1980s, were eliminated (Boucinha
and Ribeiro, 2009).
Despite the legislative drive towards the integration of banking markets, Mexia and Leite (1991)
defend that important barriers to entry remained in effect in Portugal as the minimum capital
requirements were very high and the opening of new branches as well as entry in the market were
still dependent on the Government’s authorisation. Therefore, the authors argue that the banking
sector has undergone an ambiguous process of liberalisation. On the one hand, private banks were
allowed to operate in Portugal, and the elimination of credit ceilings and other constraints have
created a more competitive market. On the other hand, banking authorities delayed the
implementation of a complete liberalisation process through the maintenance of discretionary
barriers to entry, mainly at a national level, which has allowed the persistence of monopolistic
behaviour, limiting the extent of the price effects of liberalisation.
The evolution of concentration in the Portuguese banking market according to the HHI shows that
concentration has increased over the deregulation period as it was followed by a consolidation trend
across the market. Despite the entry of new banks, in the 1990s there was an intense activity of
mergers and acquisitions. Consequently, at the beginning of the twenty-first century there were only
six commercial banks operating in Portugal, with the three largest banks dominating the majority of
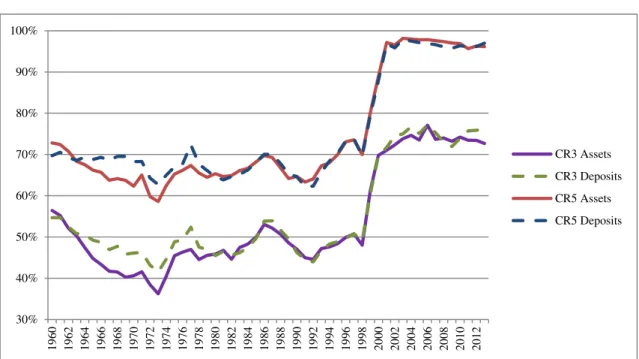
the market. Figures I and II show an exponential increase in concentration at the beginning of the
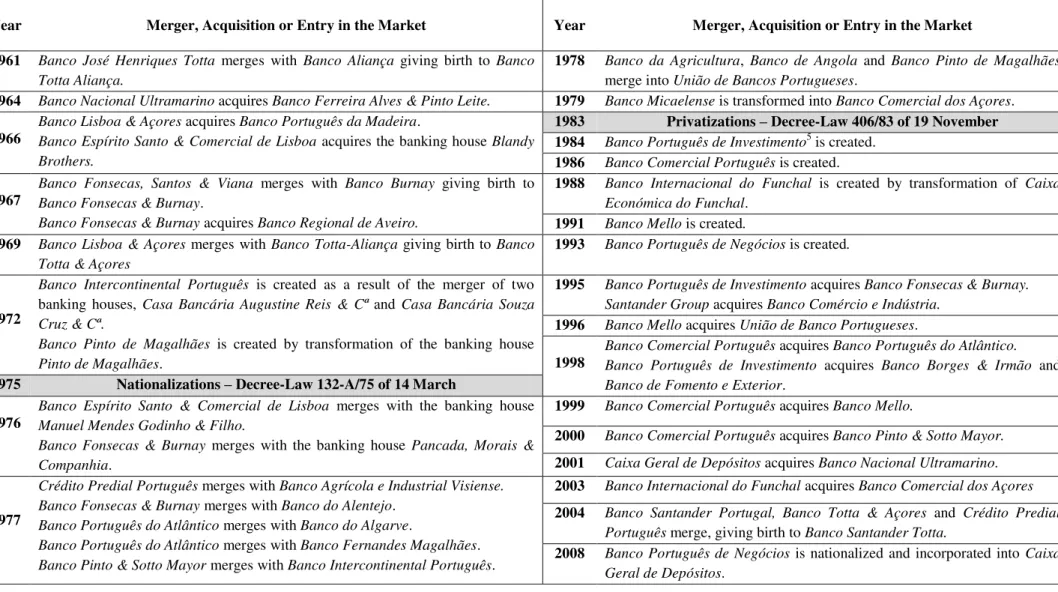
twenty-first century, which is consistent with the mergers and acquisitions represented in Table II.
The HHI for assets and deposits reached the higher value in 2003 (23% for assets and 24% for
deposits).
Although often used, the measures of concentration referred above cannot be used as the only
confirmation of the existence or lack of competition, but they constitute an important preliminary
indicator to take into account. In order to evaluate how the competitive position of the Portuguese
banking market has evolved, the Panzar-Rosse test will be performed. The next sections discuss the
empirical specification of the model and main results.
II. The Panzar and Rosse Model – Empirical Methodology and Data
In this section the theory underlying the Panzar-Rosse approach is explained only briefly. A more
detailed explanation is provided in articles by Rosse and Panzar (1977), Panzar and Rosse (1987),
Bikker and Groeneveld (2000) or Bikker and Haaf (2002).
Rosse and Panzar (1977) and Panzar and Rosse (1987) developed a test based on properties of a
reduced-form revenue equation at the firm level and use a test statistic 𝐻, which can be seen as a
measure of competitive behaviour of banks under certain assumptions4.
The first assumption is that firms in a certain market operate in long-run equilibrium. Any firm is
described by a production function, in which its outputs are 𝑦𝑖, and 𝑦𝑖 = 𝑓(𝑥1, … , 𝑥𝑛) where 𝑥𝑖
are 𝑛 inputs. To the last function corresponds a revenue function 𝑅(𝑦𝑖, 𝑧𝑖), where 𝑧𝑖 is a vector of
exogenous variables that affects the firm’s revenues, and a cost function 𝐶(𝑦𝑖, 𝑤𝑖, 𝑡𝑖), where 𝑤𝑖 are
the input prices and 𝑡𝑖 is a vector of exogenous variables affecting the firm’s costs. Thus, the firm’s
profits can be written as 𝜋 = 𝑅 − 𝐶 = 𝑅(𝑦𝑖, 𝑧𝑖) − 𝐶(𝑦𝑖, 𝑤𝑖, 𝑡𝑖). The second assumption is that
firm 𝑖 maximises its profits, where marginal revenue equals marginal cost. At the market level, it
means that, in equilibrium, the zero profit constraint holds:
4
(I)
Variables marked with an asterisk (∗) represent marginal values. The type of behaviour in the
market is measured by the extent to which a change in input prices 𝑑𝑤𝑖 is reflected in the
equilibrium revenues earned by bank 𝑖 (𝑑𝑅𝑖∗). In words, this asks the question: What will be the
percentage change in equilibrium revenue resulting from a 1% change in all input prices of bank 𝑖?
More specifically, Rosse and Panzar (1977) and Panzar and Rosse (1987) define a measure of
competition, corresponding to the sum of the elasticity of the reduce-form revenues with respect to
the input prices:
(II)
Panzar and Rosse (1987) proved that an increase in input prices will increase marginal costs,
affecting revenue and output negatively. In order to accommodate the loss of revenue the
monopolist simply reduces output and increases its price. In the case of perfect competition and
under certain conditions, an increase in input prices raises both marginal and average costs without
changing the optimal output of any firm. Exit of some firms from the market increases the demand
faced by each of the surviving ones, which leads to an increase in prices and revenues equivalent to
the increase in costs. In the case of oligopoly, an intermediate behaviour results. Therefore,
according to Panzar and Rosse (1987), an 𝐻 that is 0 or negative (𝐻 ≤ 0) corresponds to a
monopoly or a perfectly colluding oligopoly, an 𝐻 that is 1 (𝐻 = 1) corresponds to perfect
competition, and an 𝐻 between 0 and 1(0 < 𝐻 < 1) corresponds to monopolistic competition,
which is a form of oligopoly having competitive features similar to perfect competition in the
long-run. In the empirical analysis, the following specification of the model was set up:
(III)
,
*
, ,
0* i i i i i i
i y z C y w t
Where 𝛼 is a constant term, 𝜂𝑖 is an unobserved variable which captures idiosyncratic features of
each bank that are constant over time and 𝜀𝑖𝑡 is an error term. The subscript 𝑖 denotes bank 𝑖 and the
subscript 𝑡 denotes year 𝑡. Equation (III) is similar to what is commonly used in the literature but the
choice of dependent and independent variables is reliant on data availability. The dependent variable
is the natural logarithm of interest revenue divided by total assets (𝐼𝑅/𝐴). As the bank’s accounts
did not separate interest from commissions in many years, this variable includes the two items
together as an approximation to the true variable. In order to increase the range of the approach, the
same tests were performed using total revenue divided by total assets as the dependent variable.
Total revenue includes not only revenue coming from interest and commissions, but also from other
sources, such as the return on stock, return on foreign exchange operations, and some other types of
operations. However, the choice of the dependent variable raises some issues. According to Bikker,
Spierdijk and Finnie (2007) and Bikker, Shaffer and Spierdijk (2010), the use of revenues divided by
total assets (scaled dependent variable) will change the nature of the model, since it transforms the
revenue equation into a price equation, distorting the measurement of competition in favour of high
values of 𝐻 and, thus, perfect competition. Most versions of the Panzar-Rosse test use the
specification presented above, in which the dependent variable is scaled by total assets. Using the
specification proposed by Bikker, Spierdijk and Finnie (2007) and Bikker, Shaffer and Spierdijk
(2010) will mean to ignore several previous banking studies that apply the Panzar-Rosse test such as
Nathan and Neave (1989), De Bandt and Davis (2000) and Claessens and Laeven (2004). Since
economic theory does not give clear guidance as to which modelling approach best describes the
behaviour of the banking firm, the four specifications presented in the literature will be estimated.
As referred above, the Panzar and Rosse methodology follows an intermediation approach which
means that banks are modelled as firms that use labour, physical capital and funds to produce loans.
Thus, for the independent variables, we have first the input prices that are presented as proxies. The
assets. The ratio of annual personnel expenses to the number of fulltime employees would be a
better measure (Bikker, Spierdijk and Finnie, 2007) but due to the lack of data regarding the
employee numbers, the total assets configuration was used instead. The price of capital (𝑤𝑘) was
proxied by the ratio of bank’s capital expenditures to fixed assets. As there is no straight information
on the capital expenditures, this variable was proxied by the banks’ expenditures excluding interest
and wages to fixed assets. The average funding cost (𝑤𝐹) was proxied using the ratio of interest
paid to interest bearing debt. The Panzar and Rosse’s H-statistic is equal to the sum of the
coefficients of the three input prices (𝛽1+ 𝛽2+ 𝛽3).
Besides input prices, most studies include a wide range of explanatory variables to account for
differences between banks in terms of cost, risk and structure. The ratio of demand deposits to total
debt (𝐷𝐷/𝑇𝐷) captures features of the funding mix. The credit risk is measured by the ratio of
loans to total assets (𝐿/𝐴) and the credit mix by the ratio of interbank deposits to loans (𝐼𝐵/𝐿). In
order to capture the banks’ activities beyond financial intermediation, the ratio of off-balance sheet
activity to total assets (𝑂𝐵𝑆/𝐴) was included. Branching strategy is defined as the ratio of total
assets to total branches (𝐴/𝐵) and intends to capture systematic differences in branch density. The
capital-assets ratio (𝐸/𝐴), or leverage, is used as a measure of risk across banks. The ratio of other
revenue to interest revenue (𝑂𝑅/𝐼𝑅) was also included in the model to account for changes in
income structure. The problem of separation between interest and commissions repeats again and,
hence, this variable corresponds to the difference between income from interest and commissions
lumped together and other types of income that are reported in the banks’ accounts.
To implement the above methodology, data were extracted from the bank’s annual reports, listed on
the bibliography. However, Banco da Madeira, Banco Ferreira Alves e Pinto Leite, Banco
Fonsecas, Santos e Viana, Banco Regional de Aveiro and Banco Aliança were excluded due to lack
of observations, such as Banco José Henriques Totta, were also removed from the sample. The data
from individual accounts were used instead of data from consolidated accounts since consolidated
accounting data is available only in the most recent period. The dataset used in this study has not
been adjusted for bank mergers, i.e. two merging banks are treated as two separate banks until the
year of merger from where on only the “take over” bank is accounted for (Hempell, 2002).
All money variables were translated to euros at the 1999 irrevocable exchange rate and deflated
using a GDP deflator with 2011 as the base year. Finally, we arrive at an unbalanced panel of yearly
data with 628 observations. An OLS regression with fixed-effects was used to estimate the model
that takes into account different specifications of the dependent variable to accommodate for doubts
concerning the suitable variables, as discussed below. Descriptive statistics are presented in Table III.
III. Results
Table IV presents the results for the different specifications employed. In each specification of the
model are shown results for tests where the estimation of the variance-covariance matrix of the error
is not robust to heteroscedasticity. Tests where the variance-covariance matrix of the error is robust
to heteroscedasticity were performed but produced no difference in the results. Therefore, for
reasons of space we present only the first set of results in Table IV. The interpretation of the P-R
approach depends on whether or not banks are in long-run equilibrium. Consequently, the P-R
equation was estimated using Return on Assets (ROA) as the dependent variable and a test for 𝐻 = 0 (equilibrium) against 𝐻 < 0 (disequilibrium) was performed, where 𝐻 is the sum of factor
price elasticities with respect to profitability measures. As shown in column (1), the null hypothesis
was not rejected, so that it is possible to assume long-run equilibrium in the market. As for the actual
competition test, monopoly or perfectly colluding oligopoly was tested using a one-sided test in
which the null hypothesis was 𝐻 ≤ 0 and the alternative hypothesis was 𝐻 > 0. Perfect
Column (2) reports the results for the specification in which the interest revenue is scaled by total
assets (𝐼𝑅/𝐴). The H-statistic is 0.896. In this specification, the null hypothesis of monopoly or
perfectly colluding oligopoly was clearly rejected, meaning that the Portuguese commercial banking
system between 1960 and 2013 did not function as a monopoly or a perfectly colluding oligopoly.
The null hypothesis for perfect competition was also rejected. The conclusion is that the Portuguese
banking market functioned under monopolistic competition. The same procedures were followed in
the results presented in column (3) but for a specification in which the dependent variable is total
revenue, still scaled by total assets (𝑇𝑅/𝐴). The H-statistic is now 0.877, but the test produced the
same results as with (𝐼𝑅/𝐴). Looking at coefficients, input prices are generally significant in both
specifications, with the exception of the price of capital. This may be the result of the proxy used to
construct the variable. Results for the control variables are also significant, except for the credit mix (𝐼𝐵 𝐿⁄ ), which is not significant in both specifications.
Columns (4) and (5) show the results on non-scaled dependent variables. The H-statistic is 0.929 in
the case of interest revenue and 0.909 in the case of total revenue. The same tests as above were
performed and the null hypothesis of monopoly or perfectly colluding oligopoly was again clearly
rejected, confirming the results of the first tests. But the same did not happen with the null hypothesis
of perfect competition, as in both specifications it was not rejected. With non-scaled variables the
price of capital and the average funding cost are not significant. Credit risk (𝐿 𝐴⁄ ) is not significant,
which means that this variable was irrelevant in the specification in which the dependent variables
are not scaled by total assets. Results on the variable corresponding to other income to interest
income (𝑂𝑅 𝐼𝑅⁄ ) are not significant in the case in which the dependent variable is the interest
revenue, meaning that is not possible to decide what the true effect of this variable was.
The tests provide a different message but all lead in the direction of refusing lack of competition in
the market throughout the entire period. The uncertainty resides in which specification is more
interesting because the results that are favourable to perfect competition occur in the cases where the
dependent variables should have biased the result to a smaller degree of competition. However, this
is, of course, too long a period so we need to investigate the behaviour of the market in the three
sub-periods defined above: 1960-1975, 1975-1989 and 1989-2013. This division allows for an
assessment of the institutional shocks over the competitive behaviour of banks.
Table V presents the various tests that were done. In the case of the specification with interest
revenue scaled by total assets, both the null hypothesis for monopoly and for perfect competition
were rejected in the 1960-1975 period, meaning that during these years the Portuguese banking
market functioned under monopolistic competition, as defended by Amaral (2015). The results for
the followings periods, from 1975 to 1989 and from 1989 to 2013, displayed the same results. As it
was seen in section II, the concentration in the market increased exponentially at the beginning of the
twenty-first century. In order to see if competition has maintained the same path in the last two
decades or if the increase in concentration has had some impact on competition, tests on the periods
from 1989 to 2000 and from 2000 to 2013 were performed. In the period from 1989-2000, it was
not possible to reject the null hypothesis for perfect competition, and in the period from 2000-2013 it
was not possible to reject the null hypothesis for monopoly or perfectly colluding oligopoly. This
shows that competition did increase after reprivatisation but that it evolved into the other extreme, by
presenting a perfectly colluding oligopoly situation after 2000, so the intensive concentration in the
Portuguese banking market, as can be seen in Figures I and II, did result in lack of competition. The
results for total revenue scaled by total assets (rows 6 to 10) provide the same conclusions.
When the specification in which the dependent variables are not scaled, the results are slightly
different but still convey a similar message. In the case of interest revenue it is not possible to reject
perfect competition for the 1960-1975 years. The same happens again with the 1975-1989 period,
which is surprising since banks were under the state ownership. The main difference from the
operating under a perfectly colluding oligopoly. In order to see if the type of competition was the
same throughout the entire length of the last period, the same kind of tests as above were performed.
It was found that from 1990 to 1997 the market operated under perfect competition but from 1997
until 2013 it became a colluding oligopoly market. When the dependent variable is total revenue, the
results are identical, as shown in rows 16 to 20.
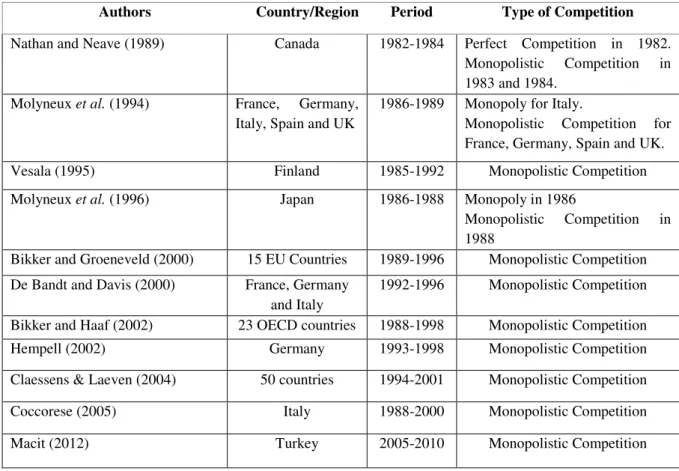
Table VI summarizes the main studies that are about Portugal or that include Portugal in their
sample. The comparison is interesting as most of the studies suggest that there is some degree of
competition in the Portuguese banking market, with the exception of the work developed by Bikker
et al. (2007) which shows that in the 1988-2004 period, with a scaled dependent variable, the
Portuguese banking market functioned as a perfectly colluding oligopoly. Table VII displays the
results for different countries, revealing that the Portuguese commercial banking systemhad features
of competition that were similar around the world.
As the periods are shortened and the number of observations declines, these tests are less reliable
than those including the full sample, but they still provide a consistent message, namely that at some
point at the beginning of 2000 there was a change in the direction of decreased competition in the
Portuguese commercial banking market. One possibility is related to greater activity of mergers and
acquisitions. Table I does indeed show that such type of episodes increased from the 1990s onwards
and became particularly sizeable at the beginning of twenty-first century. This led to a reduction in
the number of commercial banks operating in Portugal.
IV. Conclusion
In this paper a statistical approach of the Panzar-Rosse model was used in order to assess the degree
of competition in the Portuguese commercial banking market in the period ranging from 1960 to
reasonable degree of competition when the whole period is considered. Some tests point to
monopolistic competition, others to perfect competition, dependent on the type of specification used.
When the whole period is divided into smaller sub-periods the message is refined. Even if they are
less powerful and reliable, due to the reduction in the number of observations, the tests on shorter
periods point to some degree of competition until mid-1990’s, approximately, with the 1990s decade
presenting a higher level of competition in all specifications of the model. This conclusion raises
some questions, namely, why a system so heavily regulated was able to generate a high degree of
competition. This question reinforces Amaral’s (2013) view that some degree of contestability may
have existed in the Portuguese banking market. Other interesting issue is that the period
corresponding to the nationalised banking system was also characterised by some degree of
competition. One possible explanation is the fact that, even under the state ownership, banks had
some autonomy and were able to compete through other means, such as the geographic expansion
or the growth of total deposits. However, this is an issue that requires further investigation.
Regardless of the choice of the appropriate specification, one result is clear: the market functioned as
a collusive cartel from the beginning of the twenty-first century onwards, as a result of an intensive
concentration activity, which led to a reduction in the number of commercial banks to six at the
beginning of the century. However, in this study it was only possible to consider the commercial
banking sector. We cannot forget that during the 1990s there were dozens of other specialised
institutions that started to arise, also providing financial services, which have been changing the
sector. These new and specialised institutions were not considered due to the length of the study. But
this is a line of research that should be followed in the future.
References
Amaral, L. (2013). “Imperfect but true competition: innovation and profitability in the Portuguese banking during the
golden age (1950-1973)”, Financial History Review, vol. 20, nº3, 305-333.
Amaral, L. (2015). “Measuring competition in the Portuguese commercial banking during the Golden Age
(1960-1973)”, Business History, 1.
Banco da Agricultura (1960-1977). Relatório e Contas. Lisbon: Banco da Agricultura.
Banco do Alentejo (1960-1976). Relatório e Contas. Lisbon: Banco do Alentejo.
Banco do Algarve (1960-1976). Relatório e Contas. Faro: Banco do Algarve.
Banco Aliança (1960). Relatório e Contas. Porto: Banco Aliança.
Banco de Angola (1960-1976). Relatório e Contas. Luanda: Banco de Angola.
Banco Borges & Irmão (1960-1995). Relatório e Contas. Lisbon: Banco Borges & Irmão.
Banco Burnay (1960-1966). Relatório e Contas. Lisbon: Banco Burnay.
Banco Comercial dos Açores (1979-2002). Relatório e Contas. Ponta Delgada: Banco Comercial dos Açores.
Banco Comercial Português (1986-2013). Relatório e Contas. Lisbon: Banco Comercial Português.
Banco Comércio e Indústria (1986-1994). Relatório e Contas. Porto: Banco Comércio e Indústria.
Banco Espírito Santo & Comercial de Lisboa (1960-2013). Relatório e Contas. Lisbon: Banco Espírito Santo &
Comercial de Lisboa.
Banco Fernandes de Magalhães (1960-1976). Relatório e Contas. Porto: Banco Fernandes de Magalhães.
Banco Ferreira Alves & Pinto Leite (1960-1963). Relatório e Contas. Porto: Banco Ferreira Alves & Pinto Leite.
Banco Fonsecas & Burnay (1967-1994). Relatório e Contas. Lisbon: Banco Fonsecas & Burnay.
Banco Fonsecas, Santos & Viana (1960-1966). Relatório e Contas. Lisbon: Banco Fonsecas, Santos & Viana.
Banco Intercontinental Português (1972-1974). Relatório e Contas. Lisbon: Banco Intercontinental Português.
Banco Internacional do Funchal (1988-2013). Relatório e Contas. Funchal: Banco Internacional do Funchal.
Banco José Henriques Totta (1960). Relatório e Contas. Lisbon: Banco José Henriques Totta, 1960.
Banco Lisboa & Açores (1960-1969). Relatório e Contas. Lisbon: Banco Lisboa & Açores.
Banco da Madeira (1960-1965). Relatório e Contas. Funchal: Banco da Madeira.
Banco Mello (1991-1998). Relatório e Contas. Lisbon: Banco Mello.
Banco Micaelense (1960-1978). Relatório e Contas. Ponta Delgada: Banco Micaelense.
Banco Nacional Ultramarino (1960-2000). Relatório e Contas. Lisbon: Banco Nacional Ultramarino.
Banco de Portugal - BPstat (2015). Estatísticas cambiais, taxas de conversão irrevogáveis. https://www.bportugal.pt/pt-PT/Estatisticas/Dominios%20Estatisticos/EstatisticasCambiais/Paginas/default.aspx (acesssed March 5, 2015)
Banco Pinto de Magalhães (1972-1976). Relatório e Contas. Porto: Banco Pinto de Magalhães.
Banco Pinto & Sotto Mayor (1960-1998). Relatório e Contas. Lisbon: Banco Pinto & Sotto Mayor.
Banco Português de Negócios (1993-1998). Relatório e Contas. Porto: Banco Português de Negócios
Banco Português do Atlântico (1960-1998). Relatório e Contas. Porto: Banco Português do Atlântico.
Banco Português de Investimento (1998-2013). Relatório e Contas. Porto: Banco Português de Investimento.
Banco Raposo de Magalhães (1960-1964). Relatório e Contas. Alcobaça: Banco Raposo de Magalhães.
Banco Regional de Aveiro (1960-1966). Relatório e Contas. Aveiro: Banco Regional de Aveiro.
Banco Santander Totta (2002-2013). Relatório e Contas. Lisbon: Banco Santander Totta.
Banco Totta-Aliança (1961-1969). Relatório e Contas. Lisbon: Banco Totta-Aliança.
Banco Totta & Açores (1970-2001). Relatório e Contas. Lisbon: Banco Totta & Açores.
Barros, F, and Modesto, L. (1999). “Portuguese banking sector: A mixed oligopoly”. International Journal of
IndustrialOrganization, 17(6), 869–886.
Bikker, J. A. and Groeneveld, J.M. (2000). “Competition and Concentration in the EU Banking Industry”, Kredit
undKapital, 30(1), 62-98.
Bikker, J.A. and Haaf, K. (2002). “Competition, concentration and their relationship: An Empirical Analysis of the
Banking Industry”, Journal of Banking and Finance, 26, 2191-2214.
Bikker, J. A., Shaffer, S., and Spierdijk, L. (2010). “Assessing Competition with the Panzar-Rosse model: The role of
Bikker, J.A., Spierdijk, L. and Finnie, P. (2007), “Misspecification of the Panzar-Rosse Model: Assessing
Competition in the Banking Industry”, DNB Working Papers 114, Netherlands Central Bank, Research Department.
Boucinha, M. and Ribeiro, N. (2009). “An Assessment of competition in the Portuguese banking system in the 1991
-2004 period”, Banco de Portugal, Working Papers 1.
Caixa Geral de Depósitos, Crédito e Previdência (1960-2013). Relatório e Contas. Lisbon: Caixa Geral de
Depósitos, Crédito e Previdência.
Crédito Predial Português (1960-1999). Relatório e Contas. Lisbon: Crédito Predial Português.
Claessens, S., and Laeven, L. (2004). “What drives bank competition? Some International Evidence”. Journal of
Money, Credit and Banking, Vol. 36, nº 3, 563-583.
Coccorese, P. (2005). “Competition in markets with dominant firms: A note on the evidence from the Italian banking
industry”, Journal of Banking & Finance, nº 29, 1083-1093.
De Bandt, O., and Davis, E. P. (2000). “Competition, contestability and market structure in European banking
sectors on the eve of EMU”, Journal of Banking & Finance, Vol. 24, nº 5, 1045-1066.
Decree-Law 42641, 12th November 1959. Diário da República, Série I, nº 261, 1437-1447.
Decree-Law 46492, 18th August 1965. Diário da República, Série I, nº 185, 1121-1125.
Decree-Law 47912, 7th September 1967. Diário da República, Série I, nº 209, 1611-1613.
Decree-Law 218/74, 27th May 1974. Diário da República, Série I, nº 123, 657.
Decree-Law 362/80, 9th September 1980. Diário da República, Série I, nº 208, 2582-2583.
Decree-Law 51/84, 11th February 1984. Diário da República, Série I, nº 36, 469-476.
Decree-Law 161/88, 13th May 1988. Diário da República, Série I, nº 111, 2014.
Decree-Law 298/92, 31st December 1992. Diário da República, Série I-A, nº 301, 6056(24)–6056(51).
Decree-Law 201/2002, 26th September 2002. Diário da República, Série I-A, nº 223, 6550-6602.
Hempell, H. (2002). “Testing for Competition among German Banks”. Deutsche Bundesbank Economic Research
Centre, Discussion Paper 04/02.
PorData, Instituto Nacional de Esatística, and Banco de Portugal (2015). Deflatores em Portugal. http://www.pordata.pt/Portugal/Deflatores+%28base+2011%29-2413 (accessed April 6, 2015).
Macit, Fatih (2012). “Recent evidence on concentration and competition in Turkish banking sector”, Suleyman Sah
University, Theoretical and Applied Economics, Vol. XIX, nº 8(573), 19-28.
Mexia, A., and Leite , A. N. (1992). “The Pattern of Banking Liberalisation in Portugal: 1984-1990. Ambiguity
Revisited”, Working Paper nº 187.
Molyneux, P., Lloyd-Williams, D.M. and Thornton, J. (1994). “Competitive Conditions in European Banking”,
Journal ofBanking and Finance, 18, 445-459.
Molyneux, P., Thornton, J. and Llyod-Williams, D.M. (1996). “Competition and market contestability in Japanese
Commercial Banking”, Journal of Economics and Business, 48, 33-45.
Nathan, A., and Neave, E. H. (1989). “Competition and Contestability in Canada's Financial System: Empirical
Results”, The Canadian Journal of Economics, Vol. 22, nº 3, 576-594.
Panzar, J. C. and Rosse, J. N. (1987). “Testing for ‘monopoly’ equilibrium”, Journal of Industrial Economics, 35,
443-456.
Pinho, P. S. (2000). “The impact of deregulation on price and non-price competition in the Portuguese deposits
market”. Journal of Banking & Finance, 24, 1515–1533.
Rosse, J. N. and Panzar, J.C. (1977), “Chamberlin vs. Robinson: an Empirical Study for Monopoly Rents”, Bell Laboratories Economic Discussion Paper.
União de Bancos Portugueses (1978-1995). Relatório e Contas. Lisbon: União de Bancos Portugueses.
US Department of Justice and Federal Trade Commission (2010). “Horizontal MergersGuidelines”, Washington, D.C., Department of Justice and Federal Trade Commission.
Valério, Nuno (2010). História do Sistema Bancário Português, vol. II: Da Assunção pelo Banco de Portugal das
Funções de Banco Central à União Monetária Europeia, 1931-1998, Lisbon, Banco de Portugal.
Vesala, J. (1995). “Testing for Competition in Banking: Behavioral Evidence from Finland”, Bank of Finland
Figure I – Market Concentration in Portuguese Commercial Banking (Hirschman-Herfindahl Index, Assets and Deposits), 1960-2013, (%)
Sources: author’s calculations based on: Banco Agrícola e Industrial Visiense (1960-1976), Banco da Agricultura (1960-1977), Banco do Alentejo (1960-1976), Banco do Algarve (1960-1976), Banco Aliança (1960), Banco de Angola (1960-1976), Banco Borges & Irmão (1960-1995), Banco Burnay (1960-1966), Banco Comercial dos Açores (1979-2002), Banco Comercial Português (1986,2013), Banco Comércio & Indústria (1986-1994), Banco Espírito Santo & Comercial de Lisboa (1960-2013), Banco Fernandes de Magalhães 1976), Banco Ferreira Alves & Pinto Leite 1963), Banco Fonsecas, Santos e Viana (1960-1966), Banco Fonsecas & Burnay (1967-1994), Banco Intercontinental Português (1972-1974), Banco Internacional do Funchal (1988-2013), Banco José Henriques Totta (1960), Banco Lisboa & Açores (1960-1969), Banco da Madeira (1960-1965), Banco Mello (1991-1998), Banco Micaelense (1960-1978), Banco Nacional Ultramarino (1960-2000), Banco Pinto de Magalhães (1972-1976), Banco Pinto & Sotto Mayor (1960-1998), Banco Português do Atlântico (1960- 1998), Banco Português de Investimento (1998-2013), Banco Português de Negócios (1993-1998), Banco Raposo de Magalhães (1960-1964), Banco Regional de Aveiro (1960-1966), Banco Santander Totta (2002-2013), Banco Totta-Aliança (1961-1969), Banco Totta & Açores (1970- 2001), Caixa Geral de Depósitos (1960-2013), Companhia Geral do Crédito Predial Português (1960-1999), União de Bancos Portugueses (1978-1995).
Figure II – Concentration Ratios in Portuguese Commercial Banking (Assets and Deposits), 1960-2013, (%)
CR3: Assets/Deposits of the three largest banks in the market; CR5: Assets/Deposits of the five largest banks in the market.
Table I – Main Elements of the Portuguese Banking Legislation.
Capital Requirements Interest Rates Reserves Credit Stock/Bonds
holdings
Entry in market Mergers & Acquisitions
Branches
Decree-Law 42,641, 12th November 1959
For a bank to settle in Lisbon or Porto, the minimum capital is 50 million escudos. Outside Lisbon and Porto, the minimum capital is 20 million escudos. For banks already functioning in Lisbon and Porto, the minimum capital is 30 million escudos and 10 million escudos for those outside the two cities. (Article 48th)
Interest on demand deposits: 50% of the Banco de Portugal’s rediscount rate.
Interest on loans: not more than 1.5% above that same rediscount rate.
No limits on time deposits. (Article 23rd)
Cash Reserves: Equal to at least 15% of demand deposits and of time deposits of less than one month (Article 57th); and 5% of time deposits of more than one month (Article 58th). Legal Reserve Fund: Cannot exceed 10% of net profits (Article 72nd).
Forbidden to grant credit above 10% of the bank’s capital plus the reserve fund to one single firm or individual. This limit is raised to 30% if the collateral was constituted of public bonds; and to 20% if it had the form of bank guarantees. (Article 65th)
Forbidden to acquire stock of other firm in more than the reserve fund plus 20% of the capital of the bank; and could not exceed 20% of the capital of the firm. (Article 67th)
Dependent on the authorisation by the Minister of Finance. (Article 6th)
Dependent on the authorisation by the Minister of Finance. (Article 9th)
Opening dependent on the authorisation by the Minister of Finance (Article 10th)
Decree-Law 46,492, 18th August 1965
For the first time limits on rates for time deposits: 0.5% for demand deposits; 1.25% for time deposits of less than one month; 2.5% for time deposits between 30 days and 90 days; 3.5% for deposits between 90 days and one year. (Article 8th)
No change in relation to Decree-Law 42,641, 12th November 1959.
No change in relation to Decree-Law 42,641, 12th November 1959.
No change in relation to Decree-Law 42,641, 12th November 1959.
Decree-Law 47,912, 7th September 1967
The Minister of Finance may, after consulting
Banco de Portugal, set up, the interest rates of credit institutions, by ordinance (Article 1st)
No change in relation to Decree-Law 42,641, 12th November 1959.
No change in relation to Decree-Law 42,641, 12th November 1959.
No change in relation to Decree-Law 42,641, 12th November 1959.
Decree-Law 218/74, 27th May 1974
0.5% for deposits with maturities of over one hundred and eighty days (Article 3rd).
No change in relation to Decree-Law 42,641, 12th November 1959.
No change in relation to Decree-Law 42,641, 12th November 1959.
No change in relation to Decree-Law 42,641, 12th November 1959.
Decree-Law 362/80, 9th September 1980
Forbidden to grant credit above 10% of the bank’s capital plus reserve fund and above 1% of deposits in national currency to one single firm or individual. The Minister of Finance may, by ordinance, set up new limits (Article 1st)
The Constitution forbade entries in the market.
Became an
administrative issue, dependent on government decision.
Table I – Main Elements of the Portuguese Banking Legislation (Continuation).
Capital Requirements Interest Rates Reserves Credit Stock/Bonds
holdings
Entry in market Mergers & Acquisitions
Branches
Decree-Law 51/84, 11th February 1984
Commercial banks must have a minimum capital of 1,5 millions of contos
(Article 25th).
The legal reserve fund must correspond to a fraction not exceeding 10% of net profits (Article 27th).
Forbidden to acquire stock of other firm in more than 20% of the capital (Article 26th).
Dependent on the authorisation by the Prime Minister and Minister of Finance, after consulting Banco de Portugal (Article 3rd)
Dependent on the authorisation by
Banco de Portugal
and Minister of Finance (Article 18th).
Dependent on the authorisation by
Banco de Portugal
and Minister of Finance (Article 20th).
Decree-Law 161/88, 13th May 1988
Assigns to banks the power to set up freely the price of their own services.
No change in relation to Decree-Law 51/84, 11th February1984.
No change in relation to Decree-Law 51/84, 11th February 1984.
No change in relation to Decree-Law 51/84, 11th February 1984.
Decree-Law 298/92, 31st December 1992
The Minister of Finance is responsible to set up the minimum capital requirements for credit institutions, by ordinance (Article 95th). Banco de
Portugal determines the elements that integrate the funds of credit institutions, which cannot fall below the minimum capital (Article 96th).
The legal reserve fund must correspond to a fraction not exceeding 10% of net profits (Article 97th).
Forbidden to grant credit above 0.5% of the bank’s capital to one single individual, without obtaining adequate information on their financial and economic situation (Article 98th).The amount of loans granted to qualifying holdings holders cannot exceed 10% of bank’s own funds (Article 109th).
Forbidden to acquire stock of more than 15% of the own funds of the subsidiary (Article 100th). Forbidden to acquire stock of other firm in more than 25% of the voting rights corresponding to the capital of the subsidiary (Article 101st).
Dependent on the authorisation of Banco de Portugal. The authorisation must be communicated to the European Commission (Article 16th).
Dependent on the authorisation by
Banco de Portugal
(Article 35th).
Dependent on the authorisation by the Minister Finance and Banco de Portugal (Article 58th).
Decree-Law 201/2002, 26th September 2002
The Minister of Finance is responsible, after consulting Banco de Portugal, to set up the minimum capital requirements for credit institutions, by ordinance (Article 95th).
The legal reserve fund must correspond to a fraction not exceeding 10% of profits, up to a limit equal to the value of the share capital or up to the sum of the reserves and retained earnings. (Article 97th).
No change in relation to Decree 298/92, 31st December 1992. The acquisition of shares which exceed 10% of the capital of the investee or more than 2% of the capital of the investor, must be reported to Banco de Portugal (Article 43rd- A).
No change in relation to Decree-Law 298/92, 31st December1992.
No change in relation to Decree-Law 298/92, 31st December 1992.
Table II - Mergers, Acquisitions and Entries in the Portuguese Commercial Banking Market.
5
Banco Português de Investimento (BPI)was created in 1984 but as an investment bank. The bank only started in the commercial banking activity when acquired Banco Fonsecas & Burnay, Banco Fomento e Exterior and Banco Borges & Irmão. Therefore, BPI will only be considered in this study from 1998, year when the bank entered in the commercial segment. (BPI, 1998)
Year Merger, Acquisition or Entry in the Market Year Merger, Acquisition or Entry in the Market
1961 Banco José Henriques Totta merges with Banco Aliança giving birth to Banco Totta Aliança.
1978 Banco da Agricultura, Banco de Angola and Banco Pinto de Magalhães
merge into União de Bancos Portugueses.
1964 Banco Nacional Ultramarino acquires Banco Ferreira Alves & Pinto Leite. 1979 Banco Micaelense is transformed into Banco Comercial dos Açores.
1966
Banco Lisboa & Açores acquires Banco Português da Madeira.
Banco Espírito Santo & Comercial de Lisboa acquires the banking house Blandy Brothers.
1983 Privatizations – Decree-Law 406/83 of 19 November 1984 Banco Português de Investimento5 is created.
1986 Banco Comercial Português is created.
1967
Banco Fonsecas, Santos & Viana merges with Banco Burnay giving birth to
Banco Fonsecas & Burnay.
Banco Fonsecas & Burnay acquires Banco Regional de Aveiro.
1988 Banco Internacional do Funchal is created by transformation of Caixa Económica do Funchal.
1991 Banco Mello is created. 1969 Banco Lisboa & Açores mergeswith Banco Totta-Aliança giving birth to Banco
Totta & Açores
1993 Banco Português de Negócios is created.
1972
Banco Intercontinental Português is created as a result of the merger of two banking houses, Casa Bancária Augustine Reis & Cª and Casa Bancária Souza Cruz & Cª.
Banco Pinto de Magalhães is created by transformation of the banking house
Pinto de Magalhães.
1995 Banco Português de Investimento acquires Banco Fonsecas & Burnay. Santander Group acquires Banco Comércio e Indústria.
1996 Banco Mello acquires União de Banco Portugueses.
1998
Banco Comercial Português acquires Banco Português do Atlântico. Banco Português de Investimento acquires Banco Borges & Irmão and
Banco de Fomento e Exterior.
1975 Nationalizations – Decree-Law 132-A/75 of 14 March
1976
Banco Espírito Santo & Comercial de Lisboa merges with the banking house
Manuel Mendes Godinho & Filho.
Banco Fonsecas & Burnay merges with the banking house Pancada, Morais & Companhia.
1999 Banco Comercial Português acquires Banco Mello.
2000 Banco Comercial Português acquires Banco Pinto & Sotto Mayor.
2001 Caixa Geral de Depósitos acquires Banco Nacional Ultramarino.
1977
Crédito Predial Português merges with Banco Agrícola e Industrial Visiense. Banco Fonsecas & Burnay merges with Banco do Alentejo.
Banco Português do Atlântico merges with Banco do Algarve.
Banco Português do Atlântico merges with Banco Fernandes Magalhães.
Banco Pinto & Sotto Mayor merges with Banco Intercontinental Português.
2003 Banco Internacional do Funchal acquires Banco Comercial dos Açores
2004 Banco Santander Portugal, Banco Totta & Açores and Crédito Predial Português merge, giving birth to Banco Santander Totta.
Table III – Descriptive Statistics
Variable Obs. Mean Std. Dev. Min. Max.
IR/A: Interest revenue/Total assets 628 6.93 3.94 0.66 18.39
TR/A: Total revenue/Total assets 628 8.56 4.63 2.27 20.49
IR: Interest revenue 628 479.65 982.05 0.0096 8,052.37
TR: Total revenue 628 667.81 1,435.99 0.0099 9,614.62
WL: Wages/Total assets 628 1.29 0.46 0.36 3.17
WK: Capital Expenditures/Fixed capital 628 161.12 192.83 5.02 1,823.01 WF: Interest paid/Interest-bearing debt 628 86.17 117.91 0.61 1,584.12
DD/TD: Demand Deposits/Total debt 628 41.32 21.30 0.15 98.86
L/A: Loans/Total assets 628 51.49 14.24 14.21 83.34
IB/L: Interbank deposits/Loans 628 25.29 35.69 0.12 308.82
OBS/A: Off-balance sheet/Total assets 628 74.75 73.54 4.30 576.15
A/B: Total assets/branches 628 2,098.44 3,067.86 13.52 28,866.30
E/A: Equity/Total assets 628 7.27 6.89 0.10 75.56
OR/IR: Other Revenue/Total revenue 628 18.96 11.76 2.32 77.94
ROA: Net Income/Total Assets 628 0.55 0.92 -4.63 15.95 NOTE: Money variables are valued in millions of 1999 Euros and ratios are defined in percentage form.
Table IV - Results for H-statistic and competition tests in the 1960-2013 period, by taking into account the different specifications of the dependent variable.
(1)
𝒍𝒏(𝑹𝑶𝑨)
(2)
𝒍𝒏(𝑰𝑹 𝑨⁄ )
(3)
𝒍𝒏(𝑻𝑹 𝑨⁄ )
(4)
𝒍𝒏(𝑰𝑹)
(5)
𝒍𝒏(𝑻𝑹) 𝑙𝑛𝑤𝐿 -0.001 (-0.69) 0.825 (20.45)* 0.805 (18.95)* 0.901 (9.20)* 0.881 (8.86)*
𝑙𝑛𝑤𝐾 0.0004 (1.47) 0.004 (0.50) 0.003 (0.42) -0.024 (-1.32) -0.025 (-1.32)
𝑙𝑛𝑤𝐹 -0.001 (-1.77)*** 0.067 (4.42)* 0.068 (4.22)* 0.053 (1.42) 0.053 (1.41)
𝑙𝑛 (𝐷𝐷 𝑇𝐷)⁄ -0.001 (-1.10) -0.079 (-3.59)* -0.075 (-3.19)* -0.247 (-4.59)* -0.242 (-4.43)*
𝑙𝑛 (𝐿 𝐴)⁄ -0.0001 (-0.07) -0.109 (-2.17)** -0.124 (-2.32)** 0.044 (0.36) 0.03 (0.24)
𝑙𝑛(𝐼𝐵 𝐿)⁄ 0.001 (2.26)** -0.005 (-0.38) -0.006 (-0.47) -0.062 (-2.01)** -0.063 (-2.02)**
𝑙𝑛(𝑂𝐵𝑆 𝐴)⁄ -0.002 (-3.49)* -0.034 (-1.90)*** -0.048 (-2.53)** -0.094 (-2.17)** -0.108 (-2.45)**
𝑙𝑛(𝐴 𝐵)⁄ -0.001 (3.28)* 0.072 (11.09)* 0.073 (10.67)* 1.267 (80.31)* 1.268 (79.14)*
𝑙𝑛(𝐸 𝐴⁄ ) 0.002 (3.24)* -0.151 (-6.75)* -0.143 (-6.05)* -0.43 (-7.92)* -0.422 (-7.65)*
𝑙𝑛(𝑂𝑅 𝐼𝑅)⁄ -0.002 (-3.17)* -0.199 (-9.31)* 0.071 (3.15)* -0.046 (-0.88) 0.225 (4.26)*
𝛼 0.013 (1.62) -1.104 (-4.56)* -0.478 (-1.88)*** -0.195 (-0.33) 0.43 (0.72)
H-Statistic
(𝜷𝟏+ 𝜷𝟐+ 𝜷𝟑)
0.896 0.877 0.929 0.909
Equilibrium (p-value) 0.2601
p-value (𝑯 ≤ 𝟎) 0.0000 0.0000 0.0000 0.0000
p-value (𝑯 = 𝟏) 0.0076 0.0027 0.4533 0.3454
𝐑𝟐 0.3533 0.7238 0.6787 0.9184 0.9184
N 593 628 628 628 628
NOTE: The coefficients of each variable are presented in the table and t-statistics are represented in parentheses. *The variable is significant at 1% significance level.
𝒍𝒏𝒘𝑳 𝒍𝒏𝒘𝑲 𝒍𝒏𝒘𝑭 𝒍𝒏(𝑫𝑫 𝑻𝑫⁄ ) 𝒍𝒏(𝑳 𝑨⁄ ) 𝒍𝒏(𝑰𝑩 𝑳⁄ ) 𝒍𝒏(𝑶𝑩𝑺 𝑨⁄ ) 𝒍𝒏(𝑨 𝑩⁄ ) 𝒍𝒏(𝑬 𝑨⁄ ) 𝒍𝒏(𝑶𝑹 𝑰𝑹)⁄ ⍺
H
Statistic
P
Value (H≤0)
P
Value (H=1)
R2 N
(1) 𝒍𝒏(𝑰𝑹 𝑨⁄ )
(1960-1975) 0.459 (8.44)* 0.019 (4.35)* 0.03 (1.98)*** -0.234 (-4.61)* 0.062 (0.99) -0.03 (-2.84)* 0.138 (4.25)* 0.013 (1.13) -0.022 (-0.81) -0.192 (-8.94)* -1.957
(-8.11)* 0.508 0.000 0.000 0.611 251 (2) 𝒍𝒏(𝑰𝑹 𝑨⁄ )
(1975-1989) 0.27 (2.80)* 0.027 (1.25) 0.056 (2.70)* -0.654 (-7.30)* 0.201 (2.44)** -0.021 (-1.50) 0.039 (1.01) 0.089 (5.29)* -0.138 (-3.85)* -0.245 (-6.84)* -3.959
(-8.89)* 0.353 0.001 0.000 0.736 148 (3) 𝒍𝒏(𝑰𝑹 𝑨⁄ )
(1989-2013) 0.354 (4.66)* 0.139 (4.93)* 0.171 (6.68)* 0.005 (0.27) 0.005 (0.06) -0.018 (-0.68) -0.015 (-0.55) -0.135 (-3.21)* 0.13 (3.84)* -0.292 (-9.28)* 1.207
(1.96)*** 0.665 0.000 0.000 0.687 196 (4) 𝒍𝒏(𝑰𝑹 𝑨⁄ )
(1989-2000) 0.619 (5.66)* 0.146 (3.20)* 0.124 (3.47)* 0.001 (0.01) 0.039 (0.34) -0.047 (-1.35) -0.061 (-1.56) -0.065 (-1.24) 0.152 (1.97)*** -0.316 (-8.46)* 1.07
(1.32) 0.889 0.000 0.349 0.483 123 (5) 𝒍𝒏(𝑰𝑹 𝑨⁄ )
(2000-2013) -0.021 (-0.14) 0.087 (1.60) 0.257 (4.26)* -0.021 (-0.80) 0.844 (2.24)** 0.125 (1.62) 0.015 (0.36) 0.003 (0.02) 0.039 (0.84) -0.131 (-1.65) -2.229
(-0.88) 0.323 0.076 0.000 0.230 68 (6) 𝒍𝒏(𝑻𝑹 𝑨⁄ )
(1960-1975) 0.398 (7.63)* 0.014 (3.36)* 0.029 (1.97)*** -0.359 (-7.37)* -0.02 (-0.33) -0.03 (-2.90)* 0.135 (4.33)* -0.015 (-1.28) 0.014 (0.53) 0.027 (1.30) -1.361
(-5.88)* 0.440 0.000 0.000 0.516 251 (7) 𝒍𝒏(𝑻𝑹 𝑨⁄ )
(1975-1989) 0.299 (3.12)* 0.011 (0.49) 0.063 (3.05)* -0.642 (-7.20)* 0.155 (1.88)*** -0.016 (-1.12) 0.067 (1.72)*** 0.073 (4.37)* -0.157 (-4.38)* -0.004 (-0.12) -3.031
(-6.82)* 0.373 0.001 0.000 0.696 148 (8) 𝒍𝒏(𝑻𝑹 𝑨⁄ )
(1989-2013) 0.297 (3.25)* 0.228 (6.73)* 0.161 (5.23)* 0.031 (1.44) -0.031 (-0.28) -0.015 (-0.49) -0.015 (-0.48) -0.197 (-3.92)* 0.173 (4.25)* -0.002 (-0.06) 2.869
(3.87)* 0.685 0.000 0.002 0.548 196 (9) 𝒍𝒏(𝑻𝑹 𝑨⁄ )
(1989-2000) 0.536 (4.54)* 0.196 (3.98)* 0.108 (2.78)* 0.024 (0.45) -0.032 (-0.26) -0.068 (-1.80)*** -0.051 (-1.19) -0.074 (-1.32) 0.149 (1.79)*** -0.088 (-2.17)** 1,449
(1.65) 0.839 0.000 0.209 0.295 123 (10) 𝒍𝒏(𝑻𝑹 𝑨⁄ )
(2000-2013) -0.171 (-0.98) 0.103 (1.62) 0.257 (3.65)* -0.033 (-1.08) 0.389 (0.88) 0.009 (0.10) -0.008 (-0.17) -0.379 (-2.05)** 0.076 (1.39) 0.268 (2.90)* 4.483
(1.51) 0.189 0.366 0.000 0.313 68 (11) 𝒍𝒏(𝑰𝑹) (1960-1975) 0.816 (3.75)* -0.027 (-1.34) 0.081 (1.24) -0.933 (-4.10)* 0.199 (0.76) -0.123 (-2.64)* -0.189 (-1.34) 1.011 (18.99)* -0.577 (-4.74)* -0.012 (-0.13) 0.64
(0.62) 0.870 0.000 0.568 0.383 251 (12) 𝒍𝒏(𝑰𝑹) (1975-1989) 0.688 (3.12)* -0.054 (-1.16) -0.005 (-0.11) -0.603 (-2.41)** 0.299 (1.46) -0.029 (-1.00) 0.042 (0.51) 1.201 (17.91)* -0.408 (-3.64)* -0.336 (-4.33)* -0.464
(-0.42) 0.629 0.008 0.115 0.864 148 (13) 𝒍𝒏(𝑰𝑹) (1989-2013) -0.178 (-0.90) -0.108 (-1.48) -0.021 (-0.32) -0.088 (-1.91)*** 0.153 (0.63) -0.119 (-1.75)*** 0.047 (0.68) 0.541 (4.97)* -0.398 (-4.53)* 0.178 (2.18)** 8.940
(5.57)* -0.307 0.159 0.000 0.388 196 (14) 𝒍𝒏(𝑰𝑹) (1989-1997) 0.129 (0.46) 0.372 (2.90)* 0.428 (4.01)* -0.303 (-2.17)** -0.226 (-0.69) 0.052 (0.60) 0.029 (0.27) -0.088 (-0.54) -1.148 (-4.57)* -0.154 (-1.40) 17.091
(7.02)* 0.929 0.003 0.816 0.496 94 (15) 𝒍𝒏(𝑰𝑹) (1997-2013) -0.077 (-0.39) 0.029 (0.40) 0.223 (2.77)* -0.135 (-3.84)* 0.857 (1.71)** 0.063 (0.61) 0.038 (0.70) 1.111 (5.25)* -0.024 (-0.39) -0.111 (-1.05) 1.409
(0.42) 0.175 0.464 0.001 0.669 93 (16) 𝒍𝒏(𝑻𝑹) (1960-1975) 0.778 (3.64)* -0.032 (-1.62) 0.085 (1.31) -1.051 (-4.69)* 0.105 (0.40) -0.127 (-2.78)* -0.194 (-1.40) 0.988 (18.84)* -0.544 (-4.54)* 0.209 (2.34)** 1.283
(1.27) 0.831 0.000 0.449 0.362 251 (17) 𝒍𝒏(𝑻𝑹) (1975-1989) 0.731 (3.30)* -0.074 (-1.60) 0.0004 (0.01) -0.555 (-2.21)** 0.293 (1.42) -0.022 (-0.75) 0.086 (1.05) 1.196 (17.74)* -0.428 (-3.80)* -0.06 (-0.77) 0.512
(0.46) 0.657 0.006 0.147 0.854 148 (18) 𝒍𝒏(𝑻𝑹) (1989-2013) -0.235 (-1.19) -0.019 (-0.27) -0.032 (-0.48) -0.062 (-1.35) 0.116 (0.48) -0.117 (-1.72)*** 0.047 (0.67) 0.478 (4.39)* -0.356 (-4.04)* 0.468 (5.71)* 10.606
(6.61)* -0.287 0.189 0.000 0.436 196 (19) 𝒍𝒏(𝑻𝑹) (1989-1997) 0.177 (0.62) 0.395 (3.00)* 0.409 (3.73)* -0.289 (-2.02)** -0.265 (-0.79) 0.058 (0.64) 0.022 (0.20) -0.072 (-0.43) -1.165 (-4.52)* 0.025 (0.22) 17.493
(7.00)* 0.981 0.003 0.952 0.509 94 (20) 𝒍𝒏(𝑻𝑹) (1997-2013) -0.225 (-1.02) 0.045 (0.55) 0.223 (2.48)** -0.148 (-3.74)* 0.399 (0.71) -0.053 (-0.46) 0.015 (0.25) 0.726 (3.07)* 0.013 (0.18) 0.288 (2.43)** 8.144
(2.15)** 0.042 0.875 0.001 0.701 93
Table V– Results for H-statistic and competition tests, shorts periods
Table VI – H-statistic and type of competition results, Portugal, various periods.
Authors Period Focus Group H-Statistic Type of Competition
Bikker and Groeneveld (2000)
1989-1996 38 Portuguese banks
0.73-0.76 Monopolistic Competition
Bikker and Haaf (2002)
1991-1998 41 Portuguese banks
0.83 Monopolistic Competition
Bikker et al. (2007) 1988-2004 33 Portuguese banks
-0.153 (scaled dependent variable) 0.842 (with a non- scaled dependent variable)
Monopoly (scaled dependent variable) Monopolistic Competition (with a non-scale dependent variable)
Boucinha and
Ribeiro (2009) 1991-2004
25 main banking groups
(Commercial, investment and universal banks)
0.691 Monopolistic Competition
Amaral (2015) 1960-1973 Commercial Banks
0.46-0.49 (with scaled dependent variables)
1.12-1.16 (with non-scaled
dependent variables)
Monopolistic Competition (with a scaled dependent variable).
Perfect Competition (with a non-scale dependent variable).
Table VII – Type of competition results, various countries, various periods.
Authors Country/Region Period Type of Competition
Nathan and Neave (1989) Canada 1982-1984 Perfect Competition in 1982. Monopolistic Competition in 1983 and 1984.
Molyneux et al. (1994) France, Germany, Italy, Spain and UK
1986-1989 Monopoly for Italy.
Monopolistic Competition for France, Germany, Spain and UK.
Vesala (1995) Finland 1985-1992 Monopolistic Competition
Molyneux et al. (1996) Japan 1986-1988 Monopoly in 1986
Monopolistic Competition in 1988
Bikker and Groeneveld (2000) 15 EU Countries 1989-1996 Monopolistic Competition
De Bandt and Davis (2000) France, Germany and Italy
1992-1996 Monopolistic Competition
Bikker and Haaf (2002) 23 OECD countries 1988-1998 Monopolistic Competition
Hempell (2002) Germany 1993-1998 Monopolistic Competition
Claessens & Laeven (2004) 50 countries 1994-2001 Monopolistic Competition
Coccorese (2005) Italy 1988-2000 Monopolistic Competition