AN ANALYSIS OF THE USE OF BUSINESS INTELLIGENCE
TECHNOLOGIES AS FACILITATORS
OF UNIVERSITY MANAGEMENT
Liége Franken Ciupak Universidade Estadual do Oeste do Paraná (UNIOESTE) Brazil
Clodis Boscarioli Universidade Estadual do Oeste do Paraná (UNIOESTE) Brazil
Maria Elisabete Catarino Universidade Estadual de Londrina (UEL) Brazil
ABSTRACT
The concept of Business Intelligence (BI) approaches several technologies that aim at arranging the extraction and visualization of information, and just like in a competitive company the university management must also update itself, therefore adopting the use of processes that aid and speed decision making. Information Systems (IS) are indispensable elements and should mean more than the processing of routine activities, thereby starting to contribute to a strategic vision. The Western State University of Paraná (UNIOESTE) has many IS, but its users still face difficulties in extracting information in the desired format. Thus, this paper reports the outcomes of a research developed during the dissertation of a Master's Degree on Information Technology Management which is aimed at researching BI technologies. More specifically the Online Analytical Processing (OLAP), as well as implementing an operation prototype that could facilitate the retrieval of information from the dean’s office for planning, whose sources are many UNIOESTE information systems. In order to reach that goal, an exploratory/descriptive research of the qualitative type was developed by means of a documentary and bibliographical research. A prototype with the Business Intelligence Development Studio (BIDS) tool, which is a component of Microsoft SQL Server 2008, here integrated with Excel 2010 spreadsheet editor for end-user interface, was developed and evaluated. As part of the evaluation system, the SUS questionnaire was used to measure user satisfaction, where the average score given by participants was 91.5 on a 0 to 100 scale, which means quite a positive evaluation.
1 INTRODUCTION
Inside the information and knowledge society, data collection and storage are bigger than the existing capacity to analyze and transform them into useful information, and the use of software systems do require some technical knowledge.
It is necessary to provide greater independence to Information Systems (IS) users at the moment of information extraction, by means of techniques guided by usability1 principles. Besides, it is essential to speed data analysis, given that the amount of data becomes increasingly greater and the demand for useful information gets more urgent when the current competitive market is taken into account and, as Singh (2001, p.1) reinforces. "The tendency has switched from inserting to withdrawing data from databases (DB)".
This same author also claims that "[...] an efficient information management represents as of today, one of the greatest challenges faced by companies" (SINGH, 2001, p.10). Goldschmidt and Passos (2005, p.1) share the same idea and add,
[...] it has become indispensable to develop tools that aid men in an intelligent and automatic way in the task of analyzing, interpreting and relating data, thus enabling the development and further selection of action strategies in each operation context.
The solutions presented here are intended to be adopted at the Universidade Estadual do Oeste do Paraná (UNIOESTE), which has five campuses (units) placed in the cities of Cascavel, Foz do Iguaçu, Francisco Beltrão, Marechal Cândido
Rondon and Toledo. Besides housing a campus, Cascavel is home to the Rector’s
Office building and to the university hospital.
UNIOESTE has many IS, most of which were developed in the institution itself by the Information Technology Nucleus [Núcleo de Tecnologia da Informação (NTI)]. Since 2000, the systems have been developed at UNIOESTE in a way as to integrate them, looking forward to eliminating data redundancy, maintaining data homogeneity, and enabling system interoperability. Data storage is carried by Microsoft SQL Server 2008's Database Management System (DBMS), where data is structured in many but integrated DB.
difficulties in generating reports according to their needs. In this regard, Bernardes and Abreu (2004) declare that universities should adopt great technology and management practices that aid them in bringing satisfaction to their 'consumer', which is the very society that benefits from academic teaching and from research outcomes. To achieve so, universities must adequately use their new technological resources when it comes to managing information from its branches, for instance by adopting Management Information Systems (MIS) that are satisfactory to their specifications.
This paper presents the outcomes of a research developed during the dissertation of a Master's Degree on Information Management, in accordance with Ciupak (2011), the general goal of which was to investigate Business Intelligence (BI) technologies and to implement an operation prototype that could facilitate the retrieval
of information from the Dean’s Office for Planning [Pró-Reitoria de Planejamento (PROPLAN)], whose sources are many UNIOESTE IS.
Next follows the themes that guided the research, the description of the methods used as well as the showing and analysis of outcomes and conclusions.
2 INFORMATION MANAGEMENT
Rodriguez y Rodriguez (2001) understands that the transformation of Industrial Society into a new society that is based on information and knowledge is motivated by information and knowledge themselves. He asserts that "[...] the main components of an organization that tends to the Information Society are hardware and software systems and people, whereas the Knowledge Society is based on people and on intangible values" (RODRIGUEZ Y RODRIGUEZ, 2001, p.91). As of Schlesinger et al. (2008, p.10), "Information Society is focused on information as a product or raw material itself" and "Knowledge Society ought to be focused on the users' utilization of information as a process", in such a way that information begins to function as a medium for knowledge production.
providing people with the necessary feedstock - raw material - for the development of their activities.
Information Management (IM) can be defined as all actions relative to "[...] obtaining adequate information, in the right format/shape, for the correct person, at an adequate cost, in due course, at the appropriate place, in order to make the correct decision" (WOODMAN, 1985 apud VALENTIM, 2002).
From that perspective, Ponjuán Dante (1998 apud MARCHIORI 2002, p.74) states that:
Information Management must include, in operational and strategical senses, the mechanisms for obtaining and utilizing human, technological, financial, material and physical resources for the governing of information, so that, out of it, information itself can be offered as a useful and strategical feedstock for individuals, groups and organizations.
According to Choo (2002), IM is a continuous loop of six intertwined activities - identification of informational needs, acquisition of information, organization, and storage of information, development of informational products and services, distribution of information and use of information.
Technologies boosted access to information, but those who best manage it will certainly be more successful in the information and knowledge society.
Considering how necessary it is to support IM, the concept of IS is hereafter approached in the context of this paper.
3 INFORMATION SYSTEMS
One of the ways to manage a great amount of data is to use IS, which can provide managers with the information they need to administer organizations.
resources into products of information".
Rezende and Abreu (2000) state that there is no a rigid classification for an IS. And, with emphasis to the hierarchical levels of companies - which similarly extends to decision levels -, in a generical classification, there can be operational, managerial and strategic IS.
Just as an organization possesses several informational interests, corporations likewise have different IS. Laudon and Laudon (2007) describe them according to both a functional perspective and to a user group perspective.
Functional IS specifically meet the needs of a determined department or area of an organization, like Accounting and Finance teams, Human Resources, etc.
When it comes to the user group perspective, an IS classification considers all three management levels (operational, tactical/managerial and strategic) and the types of decision they support:
Transaction Processing Systems (TPS): The TPS provide information to operational managers who require information relative to transactions and basic activities of an organization. Human resources systems, clients' debts and account are TPS examples.
Management Information Systems (MIS) and Decision Support Systems (DSS): these systems aid average managers in monitoring and controlling activities, as well as in decision-making and managerial activities. MIS condense and report the basic corporate operations by using data obtained from TPS, not only to monitor and control the corporation, but also to predict its future performance. Meanwhile, DSS are used in making unusual decisions that focus on unique problems, e.g. verifying the effects of some action in order to make the best decision. DSS uses TPS and MIS as information sources, as well as information from external sources, like share values and competitor prices.
information derived from several internal (MIS and DSS) and external sources.
By pondering the diverse demand for information is how IS evolved. They initially aimed at computerizing daily routines in order to foster agility and to provide detailed information on corporate activities, but they soon began to supply top managers with more summarized information, with a view to contribute to strategical management. Among several computational techniques that contribute to management, there is a set of techniques named BI, which is of interest to this study and is presented next.
4 BUSINESS INTELLIGENCE
According to Turban et al. (2009), the term BI has its roots in the 1970's MIS and in the 1980's EIS. Afterwards the very same resources, plus a few new ones showed up with the name BI, replacing the original EIS concept. In 2005, BI systems incorporated Artificial Intelligence2 (AI) resources, and "powerful resources" of
analysis.
Barbieri (2001), just like Turban et al. (2009), understands BI as a conceptual umbrella from the new age of Information Economics, a society dedicated to capturing data, information and knowledge. BI approaches Competitive Intelligence3 (CI), Knowledge Management Systems4 (KMS), Internet Business Intelligence5 (IBI), market research and analysis, etc., which can promote the right information structuring to historical and retrospective deposits, thus enabling manipulation of information through analytical and inferential tools, in order to define competitiveness strategies to corporate businesses.
The main goal of BI techniques is to provide an adequate formatting of enormous data amounts with rules and techniques, aiming at transforming them into structured information deposits, independent of their origins, keeping in mind that such data is vital for strategical decision making (BARBIERI, 2001).
The high rate of competitiveness, triggered by the information age aroused the appearance of new technologies and terms, which are intended to advise executives in managing their organizations.
In the view of Turban et al. (2009), BI is composed of four great components: Data Warehouse (DW), business analysis, BPM and a user interface, all of which are succinctly presented next.
A DW is the physical separation of an organization's operational data systems from their decision support systems. A DW is an information repository that is organized by subjects rather than by operations, in order to keep all but the information needed for the processing of decision support systems. Besides, DW end users are business executives who make decisions based on existing data, and who are not part of the transaction process team (SINGH, 2001).
Under the creation of DW lies the Extract, Transform and Load (ETL) process. Extraction refers to the reading of one or more DB. Transformation is the conversion of extracted data, from its previous format into the one that is needed, so it can be placed in a DW or simply in another DB. Loading, at last, approaches DW data entry (TURBAN et al., 2009).
Since DW is a query-oriented DB, a simpler, expressive data modeling becomes necessary, one that is more easily understood than the Entity-Relationship (ER) model (MACHADO, 2000). It was thus that dimensional - or multidimensional - model arose.
Machado (2000) shows the basic three elements of the dimensional model:
Facts: data items collection composed of measures and of context.
Measures (variables): numerical attributes that represent a fact. They represent a business indicator's performance in regard to the dimensions that take part in the fact.
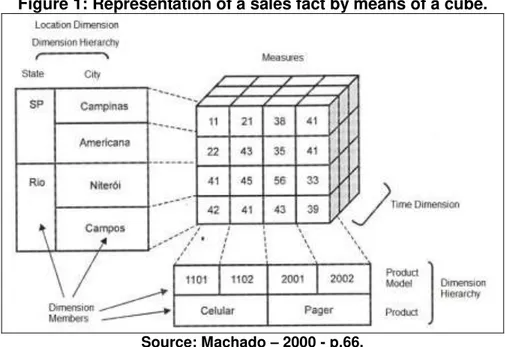
Designing a cube is a simple way to visualize dimensional models. The example of Figure 1 represents a sales fact, where measure means the amount of sales, which is determined by the combination of three dimensions: Location, Product and Time. Location and Product possess two hierarchy levels -State and City as for the Location dimension, and Product and Model as for the Product dimension.
Figure 1: Representation of a sales fact by means of a cube.
Source: Machado – 2000 - p.66.
Another component of BI is Business Analytics (BA), which is the act of permitting analysis decisions by giving access to all relevant data and information. BA includes Online Analytical Processing (OLAP), multidimensionality, data visualization, MIS, data mining and advanced analysis techniques. BA data sources can stay in a DW, can be operational data or can be filed on the Internet (TURBAN et al., 2009). OLAP is a technology that tends to decision and, according to Singh (2001) it brings out multidimensional visualization of corporate data. In order to reach our goal, the solution was to adopt OLAP. The next section presents OLAP technology concepts.
strategies is a granted requirement for the survival of an organization in hypercompetitive markets. In this field, BPM allows organizations to effectively monitor, control and execute strategy implementations.
As stated by Turban et al. (2009), BPM is more than a technological tool; it depicts a new phase of evolution for DSS, for executive information systems and for BI. He defines it this way:
An integrated set of processes, methodologies, metrics and operations, all projected to drive the general financial and operational performance of corporations. In fact, BI helps corporations with converting their strategies and goals into plans, monitoring performance regarding these plans, analyzing variations between real and planned results and adapting their goals and actions according to such analysis (TURBAN et al., 2009, p.191).
User interface (the last BI component) encompasses tools that enable users to access and analyze data stored in repositories. Several visualization tools, from multidimensional presentations to virtual reality, compose a whole parcel of BI systems. Dashboards provide a broad vision of measures, tendencies and exceptions of the corporate performance relative to multiple business areas. Corporate portals, digital cockpits and other visualization tools also "broadcast" information (TURBAN et al., 2009).
If the users find it difficult to handle the technologies made available for corporate management, it is quite likely that it will take them longer to obtain the expected outcomes. Thereby, tools must be easy to learn and have functions that permit users to get what they need safely and effectively, thus helping them feel satisfied.
Next, the main concepts of OLAP are introduced.
5 OLAP
Singh (2001, p.176) says that "[...] OLAP tools provide technological means for complex business analysis, enabling users to analyze and browse through data in order to detect tendencies and exceptions and to obtain details to better understand the highs and lows of business activities".
managerial use and has a friendly interface, that is, "[...] it is not necessary to indulge in technicism to handle it, and the associated technology, in terms of databases, is transparent to end-users".
OLAP tools permit navigation through the data cube - a dimensional data model - in order to carry out analysis. In doing so, OLAP operations are utilized, and they comprise four common operation types: drill down (or roll down), drill up (or roll up), slice and dice (MACHADO, 2000).
Drill down and up are utilized to deal with hierarchical levels of a dimension, where drill down increases detail levels and drill up decreases them. Slice and dice, however, are utilized to perform the navigation of data. By slicing the cube the same visualization perspective is maintained. It resembles the use of filters to visualize only specific data under the same previous layout. And by dicing, only one part of the cube can be visualized, which means there is a change of visual perspective. This last operation lays data in a different angle, in addition to enabling the removal or inclusion of new data for visualization (MACHADO, 2000).
The next section presents the methodological procedures adopted.
6 METHODOLOGY
This paper aimed at identifying BI technologies in order to aid PROPLAN in composing friendlier reports, by extracting information from several UNIOESTE IS. There was no intention to utilize statistical treatment to evaluate the problem and, thus, this is a qualitative research that used exploratory and descriptive methods by making bibliographical and documental analyses.
Considering that BI encompasses several technologies, this paper narrowed its attention down to how OLAP can be used to carry out business analyses. Nevertheless, before giving the end-user an interface, many technical tasks were performed, e.g. dimensional modeling for DW organization and for the mapping of information sources in the IS, looking forward to extracting, transforming and loading data into DW.
design of data cubes, inside of which information was organized for managers' further use. It had a friendly interface where manipulations took place.
Next follows the specific goals of this paper, in addition to achieved outcomes.
7 PRESENTATION AND ANALYSIS OF OUTCOMES
In order to identify the main documents/reports manually composed by PROPLAN, starting from data whose source were UNIOESTE IS, and to assess informational needs, a documental search and a meeting at PROPLAN occurred. In such meeting, many reports were collected and thereafter analyzed and organized in spreadsheets, in an attempt to identify the frequency by which reports were made, data sources, and to summarize all information contained in each report. Besides carrying out an analysis on information availability on UNIOESTE IS, this research also studied the possibility to implement them into the prototype.
Not all documental information belonged to UNIOESTE IS, and data amounts were too wide, which hampered implementation considering the available time. Hence, only what is considered to be the main three aspects of college was regarded: teaching, research and extension. As a complement, information from a part of the functional board was regarded. In short, there was available information in the fields of college workers, professorial staff, undergraduates, extension activities, research projects and research teams.
In an attempt to identify BI tools that could aid in attaining information from many UNIOESTE IS, by means of an interactive and friendly interface focused on the use of OLAP, a bibliographical search was performed, where many BI tools were found to exist, and showed varied analysis outcomes.
therefore the indicated pattern for any new software development that it may undertake.
Based on bibliographic search survey on UNIOESTE technology profile, the solution given by Microsoft was chosen. Another influencing fact for it was that the university already possesses Microsoft tools, which further boosts the possibility to implement BI systems in the campuses.
Microsoft's BI solution belongs to DBMS Microsoft Server 2008. The latter contains a BI tool called Business Intelligence Development Studio (BIDS). In regards to a user interface tool, Excel 2010 spreadsheet was chosen, which is part of the Microsoft Office 2010 pack. This software permits interaction with Microsoft SQL Server 2008 OLAP cubes.
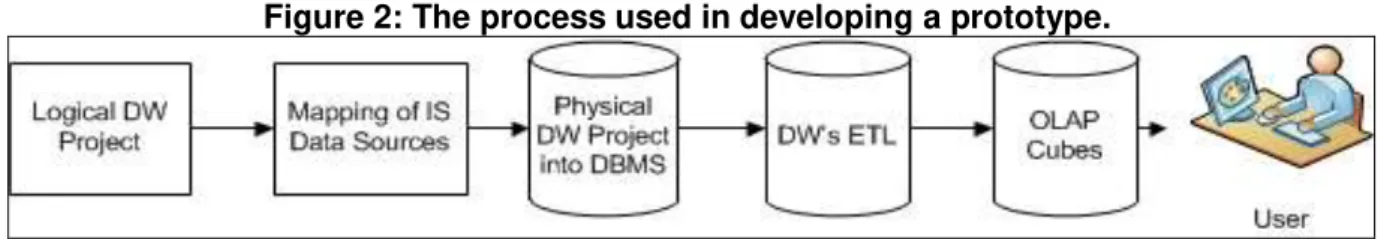
The stages used in building the prototype followed the procedure flowchart represented in Figure 2 below.
Figure 2: The process used in developing a prototype.
Source: Research data.
The first phase in the process was called logical DW project, which involved defining a dimensional model - table facts and their dimensions - as from the data identified in PROPLAN documents/reports.
Still in the view of PROPLAN documents/reports, the mapping of IS data sources was performed to verify their whereabouts among the IS of UNIOESTE. And with basis on the model designed in the logical DW project process, DBMS physical DW project was generated inside the DBMS, which means a database was created.
The BIDS tool enabled the creation of OLAP cubes with DW data:
undergraduates (acadêmico), staff (funcionário), research team (grupo de pesquisa)
and extension activity and research project.
User (Usuário) interaction began after the previous phases were over, where PROPLAN users tested the prototype following instructions and assigned tasks, aiming to verify whether the solution improved information extraction processes in the making of documents/reports.
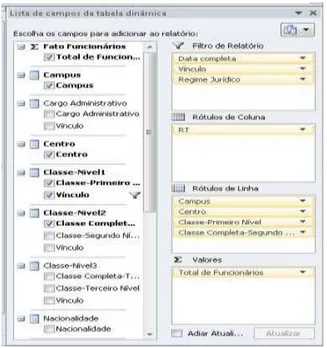
Considering the integration with Microsoft's tools, OLAP data cubes were used as data sources in the Office Excel 2010 spreadsheet editor to assemble pivot table7 reports. Excel provides a drag and drop functionality for the OLAP cube fields, a feature that further facilitates user interaction. Such data can be arranged in many different ways in pivot tables - they can be used in columns as in rows, as well as in the function of filters. In a pivot table that interacts with OLAP cubes, the dimension table data of the cube may be used in rows and/or columns and may be filtered, and the summarized value of the facts table (marked as the ∑ summation symbol) can
only be used in the values (Valores) area. Figure 3 shows the pivot table field list with data whose source is the staff (Funcionários) cube.
Figure 3: Pivot table field list with staff cube data.
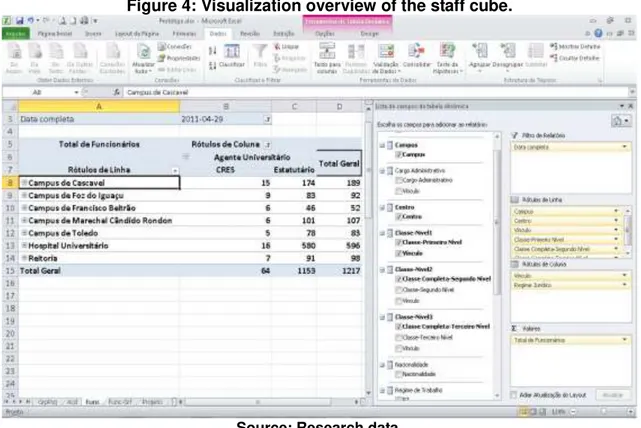
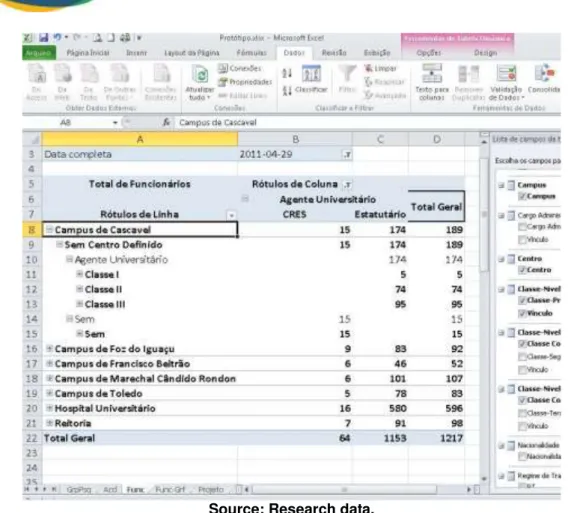
After data was appended to the spreadsheet, several visualizations could be made. Figure 4 shows a visualization overview as assigned per campus.
Figure 4: Visualization overview of the staff cube.
Source: Research data.
Starting from the overview, it is possible to increase granularity (detail) levels by clicking the plus (+) button, that is, by drilling down, as Figure 5 shows. Decreasing data levels requires a click on the minus (-) symbol, that is, drilling up.
Source: Research data.
The slice operation is also represented in Figure 5, where a filter was used in the Time dimension by means of the complete date (data completa) field, in which April 29 2011 was chosen. Even should such filter be altered, data visualization perspective remains the same.
Figure 6 shows the dice operation, where visualization perspective was changed to bring other information forward, though the table itself was assembled with the same cube. In comparison to Figure 5, the sixth one maintained the same information in rows, but changed the legal regime (regime jurídico, with values CRES
and Estatutário) column field for labor regime (regime de trabalho with values T12,
T24, T40 and T9).
Source: Research data.
Then two questionnaires concerning the process of user interaction were applied: one before the use of the prototype, then called User Profile, to inquire into certain personal details and major, and another after the use of the prototype, called Usability Evaluation, to assess the users' satisfaction level.
Questionnaires and interviews are inquiry techniques that may be used in usability evaluation, and since subjective evaluations are an important component of usability evaluations certain general tools were developed for system users, e.g.
Questionnaire for User Interaction Satisfaction8 (QUIS), Software Usability
Measurement Inventory9 (SUMI), Website Analysis and MeasureMent Inventory10
(WAMMI) and System Usability Scale (SUS) (FILARDI; TRAINA, 2008).
Likert scale format, where levels of agreement are measured within a five-point scale. By analyzing the User Profile questionnaire it was found that most of the participants have a high degree of instruction, as well as a high computer literacy, which means they make up a special profile where knowledge is elevated and could facilitate learning and interaction with the prototype.
After the data entered in the Usability Evaluation questionnaire had been summarized, there was an average grade of 91,5 in a 0-100 scale, which means evaluators enjoyed the prototype.
Besides ten questions answered in the SUS questionnaire, participants also gave their attention to the following question: In your opinion, would the adoption of
this prototype bring benefits in conducting your daily routines, especially in writing documents/reports? Please leave a comment.
On answering the questions, all participants demonstrated that the prototype would bring them benefits, mostly because it would speed the making of documents/reports. Next follows excerpts of some answers:
“[...] current systems usually don't offer information in the format I need […] with this prototype I will be able to format my report according to my needs [...]”.
“[...] I found time information filters very valuable[...]”.
“[...] I believe this system would really speed the creation of reports, since requirements most frequently come at the last minute and there is not enough time
for us to ask the responsible branches to send us the data”.
“[...] I thought it was easy to use and quite didactic”.
“[...] I thought implantation of this system would make data extraction and totalization much faster than it actually is today [...]”.
“[...] every month we need data for many reports and it would speed the activities in our branch [...]”.
“[...] our situation today when making reports is really hardworking because
of the system we currently have”.
Users' evaluations apart, certain restrictions were verified in Excel, like the case where the filters of dimension tables displayed all of the data, independent of their real existence in the facts table or not.
Another conclusion we had was that user interface could offer online access by means of Internet browsers so that users could more flexibly access the information they need - wherever they were and since they had minimum resources, like Internet access.
Next follows the main conclusions and perspectives of this research.
8 CONCLUSIONS
UNIOESTE possesses several IS that automate the university's routine activities, storing a varied and enormous amount of information in DB. It so happens, however, that IS users complain about the lack of flexibility in the extraction of information, because they desire a different layout, other data, summarization, and other specifications related to organization - how items are grouped, separated and filtered. Although the institution's IS having many preset reports, they do not meet the existing demands. NTI develops and alters reports according to users' requests, but it does not address all of them fast enough.
This study was undertaken because UNIOESTE is an institution with units, and needs to systematize a large amount of data, be it to meet internal or external requests, especially the ones by the state government, or due to the difficulties users come across while creating documents/reports.
Our main goal was to discover whether the implementation of OLAP would facilitate the extraction of information from the institution's DB in a friendlier way, thus making the users more autonomous, which would reach out to the need for upgrading public university management, where IS would be a means to subsidy such process, aiming at providing managers with information rapidly and in the desired format.
predilection for summarized over detailed information, which is the focus of OLAP.BI preaches the same thing, but it also covers other technologies, in order to enable fast and easy data extraction at the required moment, aiming at providing managers with adequate and reliable information for analysis, thus contributing to IM.
The analysis of the prototype evaluation outcomes was positive. As a whole, participants reported the prototype - if effectively implanted - to be likely to speed the creation of documents/reports.
In light of the researched information, of the knowledge then built, and with basis on the study outcomes, it is possible to conclude that our goals were achieved. Just like many other researchers claimed, BI - approached technologies expanded IM, and our study permitted theory to be proven. It should be stressed, however, that implementing projects in this field requires human and financial resources, but when these are well managed and planned they contribute to upgrading university management.
Considering that the implemented solution was a functional prototype interconnected with real institutional data, UNIOESTE is expected to support the implementation of the first BI projects in its very campus, thereby concretely contributing to upgrading university management and meeting the demands of users, who are herein represented by PROPLAN.
REFERENCES
ASSOCIATION FOR THE ADVANCEMENT OF ARTIFICIAL INTELLIGENCE (AAAI). Available: <http://www.aaai.org/AITopics/pmwiki/pmwiki.php/AITopics/AIOverview>. Access: Jun. 26, 2012.
BARBIERI, C. BI - Business intelligence: modelagem e tecnologia. Rio de Janeiro: Axcel Books do Brasil, 2001.
BARBIERI, C. BI [mensagem pessoal]. Message received by: <[email protected]>. Access: Nov. 20, 2010.
BERNARDES, J. F.; ABREU, A. F. A contribuição dos sistemas de informações na gestão universitária. In: COLÓQUIO INTERNACIONAL SOBRE GESTÃO
CHOO, C. W. Information management for the intelligent organization: the art of scanning the environment. 3.ed. Medford: Information Today, 2002.
CIUPAK, L. F. Business intelligence na gestão universitária: um estudo de aplicabilidade na UNIOESTE. Londrina: UEL, 2011. 106f. Dissertação (Mestrado Profissional em Gestão da Informação) - Universidade Estadual de Londrina em convênio com a Escola de Governo do Paraná, Londrina, 2011.
FILARDI, A. L.; TRAINA, A. J. M. Montando questionários para medir a satisfação do usuário: avaliação de interface de um sistema que utiliza técnicas de recuperação de imagens por conteúdo. In: PROCEEDINGS OF THE VIII BRAZILIAN SYMPOSIUM ON HUMAN FACTORS IN COMPUTING SYSTEMS (IHC 2008), 8., 21 a 24 de outubro 2008. Proceedings… Porto Alegre, 2008. p.176-185
FROLICK, M. N.; ARIYACHANDRA, T. R. Business performance management: one truth. Information Systems Management Journal, London, v.23, n.1, p.41-48, 2006.
GOLDSCHMIDT, R.; PASSOS, E. Data mining um guia prático: conceitos, técnicas, ferramentas, orientações e aplicações. Rio de Janeiro: Campus, 2005.
LAUDON, K. C.; LAUDON, J. P. Sistemas de informação gerenciais:
administrando a empresa digital. 7.ed. São Paulo: Pearson Prentice Hall, 2007.
MACHADO, F. N. R. Projeto de data warehouse: uma visão multidimensional. São Paulo: Érica, 2000.
MARCHIORI, P.Z. A ciência e a gestão da informação: compatibilidades no espaço profissional. Ciência da Informação, Brasília, v.31, n.2, ago. 2002. Available: <http://www.
scielo.br/scielo.php?script=sci_arttext&pid=S0100-19652002000200008&lng=en &nrm=iso>. Access: Jun. 26, 2012.
MAYHEW, D. J. The usability engineering lifecycle: a practioner’s handbook for
user interface design. San Francisco: Morgan Kaufmann, 1999.
MCCARTHY, J. What is artificial intelligence? Stanford: Computer Science Department, Stanford University, 2007. Available:
<http://www-formal.stanford.edu/jmc/whatisai/>. Access: Jun. 26, 2012.
MICROSOFT. Portal do Microsoft Office 2010. Available: <http://office.micro soft.com/pt-br/>. Access: Jun. 26, 2012.
O’BRIEN, J. A. Sistemas de informação e as decisões gerenciais na era da internet. São Paulo: Saraiva, 2001.
informação nas empresas. São Paulo: Atlas, 2000.
RODRIGUEZ Y RODRIGUEZ, M. V. Gestão do conhecimento: reinventando a empresa para uma sociedade baseada em valores intangíveis. Rio de Janeiro: IBPI Press, 2001.
ROSINI, A. M.; PALMISANO, A. Administração de sistemas de informação e a gestão do conhecimento. São Paulo: Thomson, 2003.
SCHLESINGER, C. C. B. et al. Gestão do conhecimento na administração pública. Curitiba: Instituto Municipal de Administração Pública, 2008.
SINGH, H. S. Data warehouse: conceitos, tecnologias, implementação e gerenciamento. São Paulo: Makron Books, 2001.
TURBAN, E. et al. Business intelligence: um enfoque gerencial para a inteligência do negócio. Porto Alegre: Bookman, 2009.
VALENTIM, M. L. P.Inteligência competitiva em organizações: dado, informação e conhecimento. DataGramaZero: Revista de Ciência da Informação, Rio de Janeiro, v.3, n.4, ago. 2002. Available:<http://www.dgz.org.br>. Access: Jun. 26, 2012.
NOTES
1 Usability is a measurable characteristic of a product user interface that is present to a greater or
lesser degree. One broad dimension of usability is how easy to learn the user interface is for novice and casual users. Another is how easy to use (efficient, flexible, and powerful) the user interface is for frequent and proficient users, after they have mastered the initial learning of the interface (MAYHEW, 1999).
2 Artificial Intelligence is the scientific understanding of the mechanisms underlying thought and
intelligent behavior and their embodiment in machines (AAAI, 2012). As for McCarthy (2007), it is the science and engineering of making intelligent machines, especially intelligent computer programs, and it is related to the similar task of using computers to understand human intelligence, not having to confine itself to methods that are biologically observable.
3 Competitive Intelligence tends to the collection of detailed information concerning competitior and the
market, in a way as to win customers.
4 Knowledge Management Systems aim at establishing an integrated and collaborative approach to
capture, create, organize and use all information values belonging to a corporation, independent of their shape, structure and domain.
5 Internet Business Intelligence is oriented to the web environment, aiming at contributing to decision
making. It approaches Data Mining and analisis, as well as the analisis of user behavior while on the web. It is also related to the use of web interface tools.
6 As reported by Frolick and Ariyachandra (2006), BPM is also known as
corporate performance management and enterprise performance management.
7 A Pivot Table report is an interactive way to quickly summarize large amounts of data which can be
8 Source: <http://lap.umd.edu/QUIS>. 9 Source: <http://sumi.ucc.ie>. 10 Source: <http://www.wammi.com>.
11 #1 I guess I'd like to use this system very often. #2 I found it unnecessarily complex. #3 I thought it
was easy to use. #4 I thought I might need help to be able to use this system. #5 I though all functions in this system were well integrated. #6 I thought there were many inconsistencies in this system. #7 I guess most people would readily learn how to use this system. #8 I though this system was too complicated and uncomfortable. #9 I felt quite confident using this system. #10 I had to learn a series of things to keep on using this system.
Liége Franken Ciupak
Universidade Estadual do Oeste do Paraná (UNIOESTE) E-Mail: [email protected]
Brazil
Clodis Boscarioli
Universidade Estadual do Oeste do Paraná (UNIOESTE) E-Mail: [email protected]
Brazil
Maria Elisabete Catarino
Universidade Estadual de Londrina (UEL) E-Mail: [email protected]