recommendation systems
Jossandro Balardin SilvaMestre em Sistemas e Processos Industriais pela Universidade de Santa Cruz do Sul (UNISC), Brasil. Professor da Universidade de Santa Cruz do Sul (UNISC) - Santa Cruz do Sul, RS - Brasil .
http://lattes.cnpq.br/0951550758074600 E-mail: [email protected]
Jacques Nelson Corleta Schreiber
Doutor em Engenharia de Produção pela Universidade Federal de Santa Catarina (UFSC), Brasil. Professor da Universidade de Santa Cruz do Sul (UNISC) - Santa Cruz do Sul, RS - Brasil.
http://lattes.cnpq.br/1315509984364413 E-mail: [email protected]
Elpídio Oscar Benitez Nara
Pós-Doutorado pela Universidade Federal de Santa Maria (UFSM) - Santa Maria,RS - Brasil. Doutor em Gestão da Qualidade e Produtividade pela Universidade Federal de Santa Catarina (UFSC), Brasil. Professor da Universidade de Santa Cruz do Sul (UNISC) - Santa Cruz do Sul, RS - Brasil .
http://lattes.cnpq.br/2852386671490333 E-mail: [email protected]
Submetido em: 09/01/201. Aprovado em: 23/01/2017. Publicado em: 26/06/2017..
ABSTRACT
This research developed a method for recommending news in online newspapers. This study considers that each reader has a need and specific interests and the challenge of online newspapers is to bring personalization and individualization of information in order to meet the needs of each reader. The main objective was to resolve or minimize the problem of the new reader (the system has little or no information regarding to preferences). This descriptive study focused on the new reader of a news portal and the data collected through Web browsing occurred without the expressed willingness. It is characterized as applied because it generated knowledge for solving the problem of this type of online newspaper user. A quantitative approach was adopted because the news recommended by the system were classified and quantified the accuracy of the system by comparing the suggestions with readers’ decisions. The solution involved the adoption of three different methods. A Bayesian network was chosen as the primary method to generate news suggestions for the new reader and the excess of variables was clustered using the K-means algorithm. The missing probabilities on the network have been learned through the EM algorithm (Expectation Maximization). This algorithm uses the cases in which the variables have been observed to learn how to predict their values when they have not been observed.
Abordagem bayesiana em sistemas de recomendação de notícias
RESUMO
Esta pesquisa desenvolveu método para recomendar notícias em jornais on-line. O estudo considera que
cada leitor tem uma necessidade e interesses específicos, e o desafio de jornais on-line é personalizar e individualizar a informação, satisfazendo assim as necessidades de cada um. Resolver ou minimizar o problema do novo leitor (o sistema tem pouca ou nenhuma informação sobre preferências) foi o objetivo principal. Este estudo descritivo teve como foco o novo leitor de um portal de notícias, e a coleta de dados via navegação na Web ocorreu sem a vontade expressa. Caracteriza-se como aplicada por gerar conhecimento para resolver problemas deste tipo de usuário de jornal on-line. Foi adotada a abordagem quantitativa, pois as notícias recomendadas pelo sistema foram classificadas e quantificavam sua precisão, comparando as sugestões com as decisões dos leitores. A solução envolveu a adoção de três métodos diferentes. Uma rede bayesiana foi o método primário para gerar sugestões de notícias para o novo leitor, e o excesso de variáveis foi agrupado utilizando o algoritmo K-means. As probabilidades ausentes na rede foram apreendidas por meio do algoritmo EM (Expectation Maximization). Este algoritmo utiliza os casos em que as variáveis foram observadas para aprender a prever os seus valores quando não foram observados.
Palavras-chave: Rede bayesiana. Agrupamento. Notícias on-line. Sistema de recomendação.
Enfoque bayesiano en sistemas de recomendación de noticias
RESUMEN
Esta investigación desarrolló método para recomendar noticias en periódicos en línea. El estudio revela que
cada lector tiene una necesidad y intereses específicos, y el reto de los periódicos en línea es para personalizar e individualizar la información, respondiendo así a las necesidades de cada uno. Resolver o minimizar el problema del lector nuevo (el sistema tiene poca o ninguna información acerca de preferencias) era el objetivo principal. Este estudio descriptivo se centró en el nuevo lector de un portal de noticias, y la recogida de datos a través de la navegación Web se produjo sin voluntad expresa. Se caracteriza por ser aplicado por generar conocimiento para resolver problemas de este tipo de usuarios de periódico en línea. Se adoptó el enfoque cuantitativo porque la noticia recomendada por el sistema fueron clasificadas y se cuantificó su precisión,
comparando las sugerencias con las decisiones de los lectores. La solución consistió en la adopción de tres
métodos diferentes. Una red bayesiana fue el principal método para generar sugerencias de noticias para el nuevo lector, y el exceso de variables fueron agrupadas utilizando el algoritmo K-means. Las probabilidades faltantes en la red fueron capturadas por el algoritmo EM (Expectation Maximization). Este algoritmo utiliza los casos en las variables fueron observadas para aprender a predecir sus valores cuando no fueron bservadas.
INTRODUCTION
The internet is an essential source of entertainment, culture, information, products and services (MACQUEEN, 1967). Many people rely on information to perform properly their daily activities, whether they are professional or personal. The great difficulty is to find the desired information in the midst of all the universe of available information (CAZELLA, 2006). According Eluan et al (2008), with these developments there is a diversity of information available, which leads to a greater need of using resources to organize this information in order to manage them more effectively. Internet usage is intended to facilitate the exchange of information to users, so the importance of managing this information. (GABRIELI et al, 2007). Therefore methods of data mining are being studied in order to group them by similarities of goals (ZENG et al, 2013).
The informational support are evolving along with society, having to fit the needs of time and space of their litores. (ARAUJO et al, 2013). In the context of online newspapers, it can be observed that, even nowadays, the producers companies of newspaper follow the industrial model, where the same newspaper (containing the same information) is distributed to readers. Facing a vast universe of news, there are certainly readers interested in those contents that are not published, or even if they are published in the online version the reader finds it difficult to find it in the midst of many other information. Each reader has a specific need, has specific interests and the challenge of online newspapers is to bring personalization, individualization of information in a way to meet the specific needs of each reader. (CROSBIE et al, 2006).
The recommender systems aim to reduce information overload, performing filtering of items based on the user interests profile [18]. These systems help users to deal with this overload by providing personalized recommendations of contents and services to them (ADOMAVICIUS; TUZHILIN, 2005).
Generally the user recommendation systems are classified according to the techniques used in its implementation (BURKE, 2002):
• Collaborative filtering;
• Content based filtering;
• Demographic recommendation;
• Utility based recommendation;
• Knowledge based recommendation;
• Hybrid Approach.
Regardless of the technique used for implementation, the majority of current recommendation systems still present problems, being relevant to the context of online news the problem of the “new user”, that is the difficulty that the systems have to recommend items to unfamiliar users. It is considered as a “new user” the one who enters the system for the first time or who has not read much news or has not even signed up. This article presents the development of a recommendation system whose goal was to create a system of online news recommendation in order to alleviate the problem of the new user, as well as the implementation of this system on a regional news portal. To implement the system it was used the clustering techniques and Bayesian networks. Customization news is already a necessity for news sites and a concept widely used by traditional vehicles of news as USAToday.com and CNN.com.
CLUSTERING AND BAYESIAN NETWORKS
Thus, a similarity measure has to be defined according to which the elements are grouped. The clustering reduces the number of variables to be treated, because it clusters the users by characteristics of Web browsing (WAN et al, 2012). 3 nodes were clustered: news, words and users.
Bayesian networks are diagrams that organize knowledge in a given area by a mapping between causes and effects. Systems based on Bayesian networks are able to automatically generate predictions or decisions even in the inexistence of a few pieces of information. Bayesian networks are probabilistic models represented by directed acyclic graph where nodes (vertices) that correspond to random variables and the edges (arrows) that connect pairs of nodes which correspond to influence a random variable over another (FRED, 2005). In this paper the nodes had unknown probability values and therefore it was necessary to use an algorithm for learning. The learning addressed in this study is when the network structure is known and the data is incomplete. The EM algorithm is used for learning numerical parameters, since the structure has been defined by the author and it did not need to be learned in an automated way.
The EM algorithm (Expectation Maximization) estimates functions of maximum likelihood from incomplete data; it uses cases in which the variables were observed to learn how to predict their values when unobserved. These characteristics allow us to use this algorithm for learning the parameters of Bayesian networks from incomplete data [9]. The EM algorithm is also capable of predicting the value of variables that have never been observed as long as the general shape of the probability distribution of variables is known. (NUNES, 2010).
In a Bayesian network, the parameters tables (a priori probabilities and conditional probabilities table) describe the characteristics of a population.
The EM algorithm operationalizes its functionality in two steps:
• Step E (expectation): it is estimated the absent data, ie, there are found the expected values for the not observed data in the sample, based on the present values of each variable and on the current estimates of the parameters.
• Step M (maximization): it uses the data found in step E to update the conditional probability distributions through a maximum likelihood estimate.
The expectation and maximization steps are repeated until convergence of the process, ie, until there is no (or is less than a predefined threshold) difference between the current and previous likelihood.
In order to speed up the development of the system, it was decided to use the API of two software support, one to generate clusters using K-means algorithm, WEKA and one for generation and use of Bayesian networks and applying the EM algorithm, Netica.
CONTEXT
The news recommendation system has been developed to be applied in a news portal that has regional coverage on an average of twenty thousand (20,000) unique visitors per day. With over five thousand registered users, around 500 daily users navigate identified (they log in) through the portal, ie the vast majority is “new users”.
SYSTEM PLANNING
The recommendation system was built based on the news system existing in the company and considering the need to generate news recommendations for unregistered users and present little information.
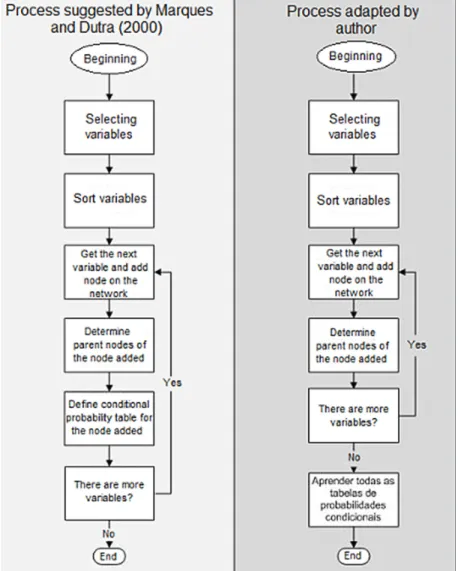
Figura 1: Comparing the process suggested by Marques and Dutra (2000) and the process adapted by the author.
Source: Prepared by the authors from the literature review.
ADAPTATION OF THE PROCESS
The adapted step in the process suggested by Marques and Dutra (2000) is the definition of conditional probability tables, which occurs every time a node is added to the Bayesian network. The original process suggests that an expert with deep knowledge of the area that is being modeled make this definition based on his knowledge, empirically. However, the process adapted by the authors of this research suggests that the definition of conditional probability tables are obtained through the analysis of past data, subjecting them to the EM algorithm, as observed in figure 1.
Such adaptation does not influence the final result the process that is the modeling of a Bayesian network, with the exception of numerical parameters (conditional and a priori probabilities) that instead of being defined by an expert, are determined by the EM algorithm for learning.
SELECTION OF VARIABLES
In this work, the Bayesian network was modeled in order to generate probabilities of recommendation for newsreaders users, so the selected variables must influence, somehow, the user’s decision by reading or not certain news.
Initially, it was made an empirical analysis of the database of the company, where it was identified the variables that possibly influence the decision of a user, with regard to the reading of a news. And then it was defined some fields and additional tables to be created in the database to meet requirements of the proposed recommendation system, such as the field that stores which user reads certain news and the field that stores how long he was reading.
The selected variables to describe the problem domain are listed below and were divided into four groups: variables related to the user, variables related to the news, words of news text and control variables that include the clusters and the indication mentioning whether a specific user read or not the news story.
The variables selected for the user are:
• Gender: indicated in the registration, it allows selecting male or female. According to the analysis of the database of the portal, this variable has great influence on the kind of news to be read, different genders usually read different news;
• Age: it is determined based on the date of birth expressed in the register which is discretized in order to place the user in an age group. At the moment it uses five age groups: under 24 years old, from 24 to 35, from 35 to 45, from 45 to 59 years and above 60 years old;
• Marital status: it allows to select only one of the civil status: single, married, widow, separated, divorced and stable union;
• Profession: it allows to select one of the pre-registered professions in the system;
• Education: it allows to select the maximum degree of education attended;
• Average time per visit / session: it is captured based on navigation, indicates the average time spent by the user on each visit to the site (browsing session), measured in minutes starting at “up to 1 minute” and ending in “more than 10 minutes”;
• Average time per news: it is captured based on navigation, indicates the average time spent by the user in reading each story, having seconds as unit of measure , starting from “up to 50 Seconds” and ending in “more than 250 seconds”.
• News read per visit / session: it is captured based on the user browsing this variable indicates the amount of news (average) read by the user for each browsing session;
• News age when it was read: this variable indicates how much life time the news had when it was read by the user (lifetime of news for a user is the time difference between the time the news was registered and when it was read by the user, for example, news registered at 1:30 p.m. in the system and read at 3h has a life time of 1:30 h). In order to account this variable it is calculated an average between the “age” of the news read by a specific user. The time of this variable is measured in hours, starting with “up to 1 hour” and ending in “more than 12 hours.”
The selected variables related to the news are:
• Source: it represents the information source that generated the news;
• Group / Cartola: it works as pooler used by the journalism team for creating special channels on the site, usually used to indicate the secondary subject of the news;
• Editorship: it defines the editorship to which the news belongs, always defined by the journalist who produces the news;
• Reading time: it is captured based on users’ navigation, indicates the average time that the users take to read specific news. Measured in seconds, ranging from “less than 50 seconds” to “more than 250 seconds”. It should not to be confused with the variable “average time per news” that presents the average time it takes a user to read news, while the variable “reading time” indicates the average time it takes for a news story to be read by any users;
• Life expectancy: it is the reading peak time of a news, captured based on navigation and measured in hours indicates the time when more users read certain news since its publication. It starts in “less than 1 hour” and goes to “more than nine hours”;
Besides these two groups, it was created a third one: the group of words from the news, which brings together all existing words in the news used as “learning” network. The news text is transformed into a vector of words, in which the words of little relevance are excluded (called stopwords) and it is generated a variable for each word. The content of all the variables of words news will be Boolean, i.e. indicating if the word exists or not in the news to be recommended.
The fourth group brings the variables created exclusively for using in the Bayesian network, calculated from the k-means algorithm that groups together the variables previously described in clusters. Grouped variables and also the variable that indicates the recommendation (read) are detailed below:
• User: it indicates the group to which the user belongs, defined by clusters of user data and taking into account the user variables described above. The clustering is given by the software WEKA API using k-means algorithm.
• Text News: it indicates the group of news words, defined by the clustering of words in the text of the news. The same way as the others, this clustering is generated by k-means algorithm implemented by WEKA software and it is used in this project through its API.
• Read: this variable is the key to the whole recommendation, it defines the probability of reading an article by a user.
ORDERING OF VARIABLES
After the selection of variables, the procedure indicates that they are ordered by a domain expert (in this article: the author himself). The ordinance set for the variables was:
1. read 2. .user 3. news 4. gender 5. age
6. marital status 7. profession 8. education
9. average time per visit / session 10. news read per visit / session 11. average time for news 12. news age when read 13. editorship
14. journalist 15. reading time 16. life expectancy 17. Source
18. group / cartola 19. news text
20. words extracted from the news
STRUCTURE OF THE BAYESIAN NETWORK
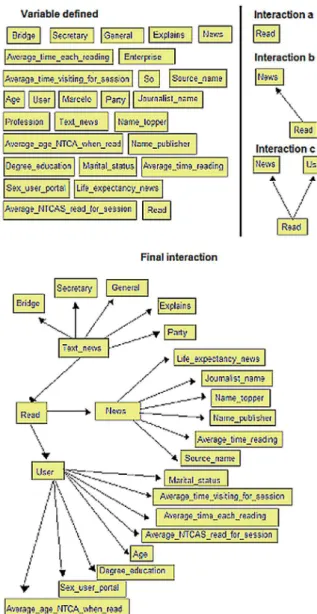
This process step is to construct a Bayesian network structure, adding the variables defined and ordered in the previous step. Each variable becomes a node of the Bayesian network. It is added nodes (a) and their parents are defined (b). An example of this process can be seen in figure 2 where the first table lists all variables selected to be part of the network, from the second frame we have the iterations of software that inserts each variable in the network, defining their parent (s), until we reached the final iteration where all variables were added and the network is modeled, missing only the definition of probability.
The variables shown were added to the Bayesian network, arranged as described, so that each variable becomes a node of the network. The possible states of the nodes are defined based on information provided by the site’s users and stored in the database. For each network node it is read all data relating to this node and grouped in order to generate the states of this node. For example, for node “gender,” states are “male” and “female.” Likewise, states for the other nodes are set with the possible data reported in each of these fields in the database.
CONDITIONAL PROBABILITIES
The last step suggested by Marques and Dutra (2000) indicates the definition of conditional probability table for each node as they are being added to the network. In this paper this definition is done automatically for the entire network through the EM algorithm, based on the log data from the database. Likewise it occurs the definition of the states of network nodes, for learning the conditional probabilities it is also necessary to read the system logs from the database that are subject to software Netica, through its API, which calculates the priori and conditional Bayesian probabilities using EM algorithm and saves the file again in the Bayesian network, now ready to be used.
A2: Binarization of texts: it consists of extracting the words of the text of the news and turn them into independent variables whose possible values are “true” and “false”. Each word will be a node in the Bayesian network generated;
A3: Data processing: This step deals with cleaning and adjusting the data by removing all sorts of remaining HTML in the variables and adapting the name and values of all variables in order to limit them to 30 characters) and remove special characters.
A4: Division into sub-tables: at this time the data are divided into sub-tables that follow the same organization of groups of variables already presented: users, news stories and words. This division is necessary to enable the collation of data, clustering.
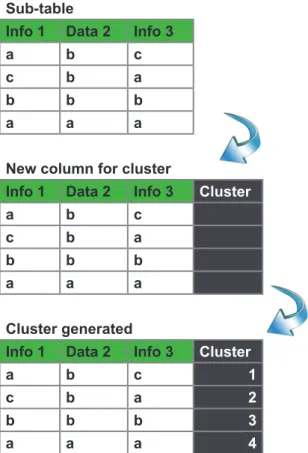
A5: Clustering: clusters are generated to group the data as Bayesian network modeling. For each sub-tables generated in the previous step it is added a column that stores the cluster to which each line belongs, as there can be seen in figure 4.
Figure 3: Step clustering
Sub-table
Info 1 Data 2 Info 3
a b c
c b a
b b b
a a a
New column for cluster
Info 1 Data 2 Info 3 Cluster
a b c
c b a
b b b
a a a
Cluster generated
Info 1 Data 2 Info 3 Cluster
a b c 1
c b a 2
b b b 3
a a a 4
USING THE SYSTEM
The implementation of the system is divided into two distinct stages, the network modeling and learning of their probabilities that we denominate of learning and generating recommendations itself, called hint.
A. NETWORK MODELING AND LEARNING OF PROBABILITIES - LEARNING
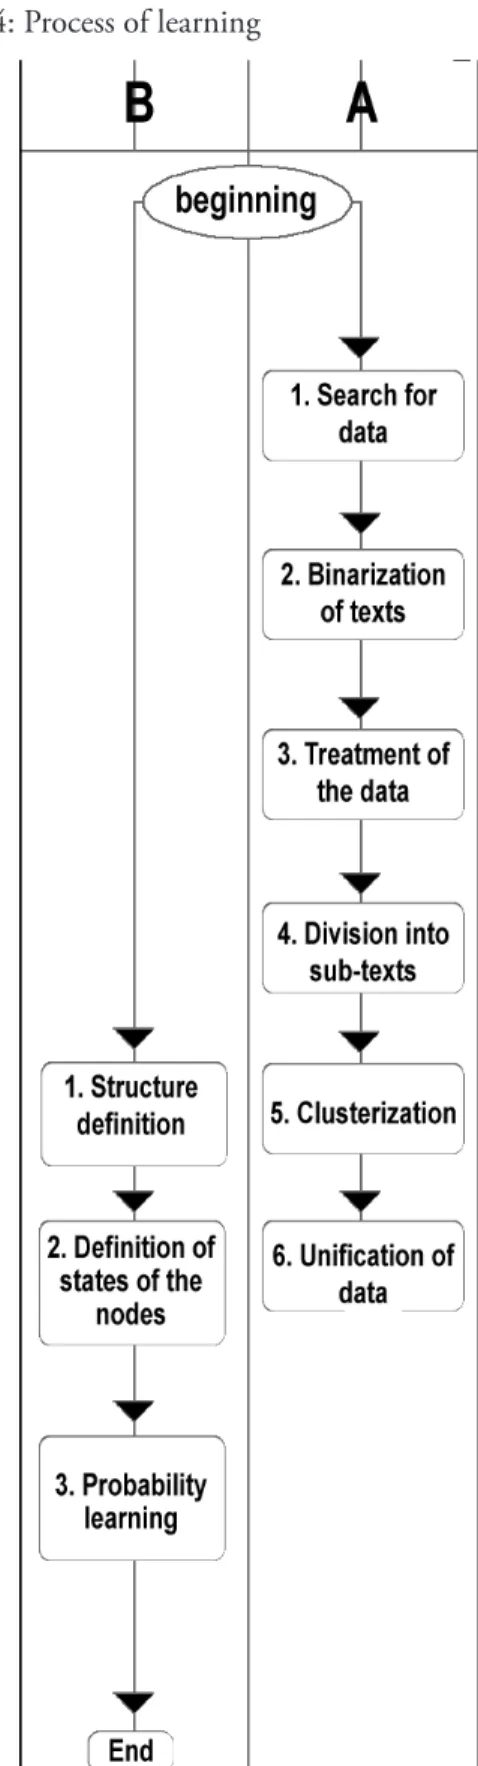
The stage of learning aims at generating a Bayesian network with the data already clustered and conditional probabilities previously defined. For this, the system searches the log data related to reading news by identified users, makes the appropriate treatments to meet the technical needs (removing spaces, character limitation, binarization of the text of the news, etc.), generates the needed clusters as described in the previous section and submits the data to the EM algorithm to effectively generate the Bayesian network. The step of learning is divided into two segments, A and B, where A relating to system data and B relating to the definition of the network structure. The process follows the steps described in the flow chart shown in figure 3. The process steps in the segment A and segment B are detailed below:
A1. Searching data: This step consists in making a search in the database, bringing all the news of the period as well as the users who read this news. In the proposed experiments during this period it was empirically determined since it is a tradeoff1 between the quality of the recommendations generated and the execution time of learning. Considering that the longer the log is used, the greater the volume of data to be processed, exponentially increasing the runtime software, but on the other hand, when more information, the better the quality of the learning of the network and hence the better the recommendations. The data provided are basically user registration data.
A6: Unified Data: After clustering the data are again united in a single table, now including the camps for the clusters. These data are reserved for future use.
B1: Definition of the structure: it consists in defining Bayesian network structure, what their nodes are and how they are related. This definition is the practical application of the previously planned structure.
B2: Definition of the states of the nodes: it consists in defining the states of each node in the Bayesian network. These states are defined based on the data reserved in step A6.
B3: Learning probabilities: it consists in learning the conditional probabilities and a priori of the Bayesian network through the EM algorithm that uses data from step A6 to calculate them.
After this process, the network is saved in a file recognized by the software Netica and is ready to be used in another phase of the system, generating recommendations - hint.
NEWS RECOMMENDATION – HINT
The news recommendation process, called hint, consists in decoding information from a user and generating a list of news, sorted in descending order by probability of reading, which this user would probably have interest. In order to generate the recommendations, the system searches all the news of a certain period (which can be parameterized) and submit one by one to the Bayesian network, along with the decoded data from the user.
EVALUATION OF THE DEVELOPED SYSTEM
An effective way to evaluate recommendation systems is through actual user reviews, subjectively (SHANI; GUNAWARDANA, 2009). The comparison of the recommendations of the system with content that was actually read by the user, the form of assessment used in this article, demonstrates to be effective and undeniable. In this article there were used three metrics for performance analysis:
the precision and recall and runtime system for generating recommendations to a user. The precision is determined by the ratio between the amount of recommended items that are of interest to the user and the total of recommended items. This metric gives us a probability of the system to recommend an item that is actually of interest to the user and can be calculated according to the equation:
precision = Recommended relevants
Recommended total items
The recall indicates the number of items of interest to the user that appear in the list of recommended items in relation to total items of interest to the user. This measure indicates how well the needs and interests of users are served by the recommendation system. The range can be calculated by:
recall = Recommended relevants
Recommended total items
The two above metrics are inter-related and can be better understood in figure 5. The (x) shows the value of recall, represents the items that are of interest to the user, which are relevant, and which were recommended by the system. When we divide this value by the total number of recommended items (y) we have the value of recall, we have the system accuracy. Now when we divide the recommended relevant items _ (x) by the total number of items that the user is interested (z) we have the value of recall, in the case of the proposed system in this work would be the total news effectively read by the user.
Figure 4: Process of learning
Source: Prepared by the authors from the literature review.
Figure 5: Relationship between precision and recall
EXPERIMENTS
To evaluate this work according to defined metrics, 3 experiments were designed with different learning parameters and news to be recommended.
The parameters set for each of the following experiments are in table 1 where the column “learning days” reports the number of days used during the selection of news for learning, “users” informs the quantity of users selected for recommendation of news and column “hours hint “indicates the number of hours that news were selected that will possibly be recommended.The script used in the experiments generates, as a result, a table with the following columns: user, amount of read and recommended news and, amount of read news, amount of recommended news, precision, recall and runtime. The steps performed by the script to generate this result are the following:
• Learning network through the EM algorithm;
• Selection of a random sample of users, following the parameter “users” that determines the number of users to be used in the experiment. This sample considers only users who have read at least one (1) news in the last few hours;
• Generation of recommendations for each of the users selected in the previous step;
Table 1- Defined Parameters for Experiments
Days learning Users hours hint
12 49 24
22 47 96
The environment used in the experiments presented in the following configuration: a virtual machine (server) with two (2) Intel Xeon 64bit CPU 2.66 GHz and 16GB of RAM using the CentOS 6.3 Linux operating system. This machine had exclusive dedication to the system during the experiments.
RESULTS
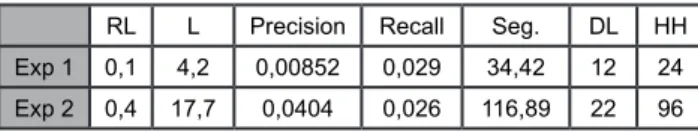
During the 3 experiments recommendations were generated for each user and defined metrics were calculated for each of the recommendations, producing a large volume of data that has been summarized in table 2.
Table 2 assembles the averages resulting in each experiment where each column represents:
• RL: news recommended by the system and read by the user;
• L: news read by the user;
• Precision: Calculation of the average precision; • Recall: Calculation of the average recall_;
• Seg: average time, in seconds, for generation of the recommendations;
• DL: amount of days used as a parameter in the learning process;
• HH: amount of hours used as a parameter in the process hint.
Analyzing the results of each experiment, it was found that the precision and recall_ do not present a set pattern. It has from 0% precision (100% error) up to 70% precision, the same occurs for the coverage that ranges from 0 (zero) to one (1), where zero means that no read news has been recommended and one means that all news read were recommended. The precision and recall averages calculated in all experiments do not exceed 20% and 15% respectively.
Another important point to note is the time, in seconds, that the system takes to generate recommendations. It is noticed that the time gradually increases as we increase the parameter “hours” in the process of hint.
Table 2- Summary of Experiments Conducted
RL L Precision Recall Seg. DL HH
Exp 1 0,1 4,2 0,00852 0,029 34,42 12 24
Exp 2 0,4 17,7 0,0404 0,026 116,89 22 96
CONCLUSION
Using the technique of clustering combined with the creation of a Bayesian network to build a news recommendation system cannot be fully evaluated in the tests performed. Preliminary results indicate that the design decisions influence directly the final outcome of the recommendation system. The choice of variables, their level of discretization, the ordering of the variables, the structure of the proposed network, the data used for learning the probabilities and other factors related to how the network is structured determine the quality of the results.
The metrics of precision and recall observed in the results of the tests showed suboptimal results for the proposed system, however it is not possible to prove that the combination of the two techniques is not effective, given the factors previously listed.
The main objective of this work, which was to ease the problem of “new user”, was partially achieved since the system was developed and recommendations are generated, however when metrics of precision and recall were analyzed it is concluded that the use of the system in production environment chosen for deployment would not be interesting because the quality of the recommendations would be lower than expected using the variables and the project initially determined in this study.
a. the metrics of precision and recall did not show satisfactory results enough to ensure that the recommendation system really arouse the interest of the users of the portal by the recommended news;
b. the runtime system needed to generate each of the recommendations is not adequate to the demand of the portal.
Based on the result of the experiments it was concluded that further experiments are needed to confirm or refute the hypothesis that the use of the techniques of Bayesian networks and clustering for modeling a news recommendation system can ease the problem of new user.
It can be said that the techniques used were not efficient and effective for this specific project, but it is not possible to generalize this result to other projects as no tests were made with other databases.
Results considered unsuitable for the specific study case of this work can be considered suitable for larger companies like Amazon, Google, Netflix and others, since even if the accuracy of recommendation systems is low, yet these recommendations represent thousands of sales, accesses or views that would not be achieved without the use of these systems.
REFERENCES
ADOMAVICIUS, G.; TUZHILIN A. Toward the next generation of recommender systems: a survey of the state of the art and possible extensions. IEEE Transactions on Knowledge & Data Engineering, v. 17, n. 6, p. 734-749, 2005. Disponível em: <http://citeseerx.ist. ad?doi=10.1.1.107.2790&rep=rep1&type=pdf>. Acesso em: 18 nov. 2010.
ARAÚJO, W. J. et al. Elementos tecnológicos de edição, manipulação e uso dos livros digitais. Informação & Sociedade, v. 23, n. 1, p. 13-25, 2013.
BURKE, R. Hybrid recommender systems: survey and experiments: user modeling and user adapted interaction. User Modeling and User-Adapted Interaction, v. 12, n. 4, p. 331-370, 2002. Disponível em: <http://josquin.cti.depaul.edu/~rburke/pubs/burke-umuai02. pdf>. Acesso em: 03 nov. 2010.
CAZELLA, S. C. Aplicando a relevância da opinião de usuários em sistemas de recomendação para pesquisadores. 2006. Tese (Doutorado em Ciência da Informação)- Universidade Federal do Rio Grande do Sul, Porto Alegre, 2006.
___________; DRUMM, J. V.; BARBOSA, J. L. Um serviço para recomendação de artigos científicos baseado em filtragem de conteúdo aplicado a dispositivos móveis. Revista Novas Tecnologias na Educação, v. 8, n. 3, 2010. Disponível em: <http://seer.ufrgs.br/ renote/article/view/18057>. Acesso em: 23 set. 2012.
CHEN, X. Clustering based on a near neighbor graph and a grid cell graph. Journal of Intelligent Information System, v. 40, p. 529-554, 2013.
COSTA, A.; PIMENTEL, B.; SOUZA, R. Clustering interval data through kernel-induced feature space. Journal of Intelligent Information System, v. 40, p. 109-140, 2013.
CROSBIE, V.; MEO, G.; BRANHAM, L. Audience and business models: will the online news industry be able to finance quality journalism?. International Symposium on Online Journalism, v. 7, p. 1-18, 2006. Disponível em: <http://online.journalism.utexas. edu/2006/transcripts/d1p1.pdf>. Acesso em: 19 nov. 2010.
ELUAN, A. A.; MOMM, C. F.; NASCIMENTO, J. A. A sistemática do uso de fontes de informação para a pesquisa científica. Informação & Sociedade, v. 18, n. 2, p. 111-119, 2008.
FRED, A. Redes bayesianas: Instituto Superior Técnico - IST. Lisboa: [s.n.], 2005. Disponível em: <http://www.lx.it.pt/~afred/docencia/ Percepcao_2006/acetatos/rb.pdf>. Acesso em: 08 jun. 2012.
GABRIELI, L.; CORTIMIGLIA, M.; RIBEIRO, J. L. Modelagem e avaliação de um sistema modular para gerenciamento de informação na Web. Ciência da Informação, v. 36, n. 1, p. 35-53, jan./abr. 2007.
MACQUEEN, J. Some methods for classification and analysis of multivariate observations. In: BERKELEY SYMPOSIUM ON MATHEMATICAL STATISTICS AND PROBABILITY, 1., 1967, California. Electronic proceedings… California: University of California, 1967. Disponível em: <http://projecteuclid.org/euclid. bsmsp/1200512992>. Acesso em: 07 dez. 2010.
MARQUES, R. L.; DUTRA, I. Redes bayesianas: o que são, para que servem, algoritmos e exemplos de aplicações. Rio de Janeiro: University Federal do Rio de Janeiro, 2000. Disponível em: <http:// www.cos.ufrj.br/~ines/courses/cos740/leila/cos740/Bayesianas. pdf>. Acesso em: 06 dez. 2010.
NUNES, M. A. S. N. Towards to psychological-based recommenders systems: a survey on recommender systems. Revista Scientia Plena, v. 6, n. 8, 2010. Disponível em: <http://www.scientiaplena.org.br/ojs/ index.php/sp/article/view/119>. Acesso em: 17 nov. 2010.
SHANI, G.; GUNAWARDANA, A. Evaluating recommendation systems: technical report. 2009. No. MSR-TR-2009-159. Disponível em: <http://research.microsoft.com/pubs/115396/ evaluationmetrics.tr.pdf>. Acesso em: 11 nov. 2012.
WAN, M. et al. Web user clustering and web prefetching using random indexing with weight functions. Knowledge and Information Systems, v. 33, p. 89-115, 2012.
YOSHIDA, T. A graph model for mutual information based clustering. Journal of Intelligent Information System, v. 37, p. 187-216, 2011.
ZENG, H.; SONG, A.; CHEUNG, Y. M. Improving clustering with pairwise constraints: a discriminative approach. Knowledge and Information Systems, v. 36, p. 489-515, 2013.