351 351 351 351 351 Mem Inst Oswaldo Cruz, Rio de Janeiro, Vol. 100(4): 351-357, July 2005
Indoor air microbiological evaluation of offices, hospitals,
industries, and shopping centers
Zilma G Nunes/+, Alfredo S M artins, Ana Lúcia F Altoe* * * , M arília M Nishikawa* , M arilene O Leite* * , Paula F Aguiar* * * , Sérgio Eduardo L Fracalanzza* * *
Centro de Produção, Universidade do Estado do Rio de Janeiro, Rua São Francisco Xavier 524, 20550-013 Rio de Janeiro, RJ, Brasil *Instituto Nacional de Controle de Qualidade em Saúde-Fiocruz, Rio de Janeiro, RJ, Brasil **Centro Universitário de Barra
Mansa, Barra Mansa, RJ, Brasil ***Universidade Federal do Rio de Janeiro, Rio de Janeiro, RJ, Brasil
In this study it was compared the MAS-100 and the Andersen air samplers’ performances and a similar trend in both instruments was observed. It was also evaluated the microbial contamination levels in 3060 samples of offices, hospitals, industries, and shopping centers, in the period of 1998 to 2002, in Rio de Janeiro city. Considering each environment, 94.3 to 99.4% of the samples were the allowed limit in Brazil (750 CFU/m3). The industries’ results showed more important similarity among fungi and total heterotrophs distributions, with the majority of the results between zero and 100 CFU/m3. The offices’ results showed dispersion around 300 CFU/m3.
The hospitals’ results presented the same trend, with an average of 200 CFU/m3. Shopping centers’ environments showed an average of 300 CFU/m3 for fungi, but presented a larger dispersion pattern for the total heterotrophs, with the highest average (1000 CFU/m3).
It was also investigated the correlation of the sampling period with the number of airborne microorganisms and with the environmental parameters (temperature and air humidity) through the principal components analysis. All indoor air samples distributions were very similar. The temperature and air humidity had no significant influence on the samples dispersion patterns.
Key words: indoor air - airborne microorganisms - principal components analysis - air sampler
Several airborne infectious diseases have been related to the indoor air quality (Wasserman 1988, Al-Dagal & Fung 1990, Menzies & Bourbeau 1997). These infections are attributed to a wide range of chemical, physical or biological pollutants, and/or contaminants, which were introduced or even produced in the environment (Hunter et al. 1988, Rom et al. 1991, Loudon et al. 1996, Stone 2000).
This scene becomes even more complex whether the indoor air is considered as a product which needs climatization and distribution process before people posure. Nevertheless, some of these people can be ex-tremely susceptible to chemical or biological pollutants. Therefore, due to their long exposure time at workplace, the companies’ responsibility upon workers health should be properly managed.
The pollution of indoor environments has achieved great importance (Menzies & Bourbeau 1997, Lee & Chang 1999, 2000). The increasing number of officially reported cases involving people with health problems, probably related to their professional environment, reduces the pro-ductivity and increases absenteeism (Al-Dagal & Fung 1990, Chan 1999, Stone 2000, Wyon 2004).
In Brazil, the concern about indoor air as vehicle of pollutants and contaminants has assumed such
impor-+Corresponding author. E-mail: zignunes@gmail.com
Receved 3 January 2005 Accepted 6 June 2005
tance in the last years that a specific law was published, in order to standardize all the procedures related to opera-tion and maintenance of air condiopera-tioning systems (Anvisa 1998). Later, two laws were published by the National Agency of Sanitary Surveillance, Ministry of Health (Anvisa 2000, 2003), which established referential stan-dards to indoor climatized air.
Nevertheless, there are many divergent aspects con-cerning these guidelines, for example the maximum limit of 750 colony forming units (CFU)/m3 for fungi that, in fact,
was stated without scientific basis. Besides, this param-eter is used for all kind of environments and for different analysis techniques and there is no reference standard for bacteria, as well as a standard for the analysis tech-nique.
352 352 352 352
352 Indoor air microbiological evaluation • Zilma G Nunes et al.
MATERIALS AND METHODS
Air samplers performance - Fifty indoor air samples were collected in offices (25 of which were analyzed for total heterotrophs and 25 for fungi), throughout 8 work-ing hours, in a climatized environment, located downtown in Rio de Janeiro city.
The single stage MAS-100 air sampler (Merck), at a flow rate of 100 l/min, and the single stage Andersen sam-pler (Andersen) at a flow rate of 28.3 l/min, were used simultaneously. There were collected 100 l of air with MAS-100 sampler, while the Andersen sampler allowed the collection of approximately 141.5 l of air in 5 min. The instruments were placed 1 m above the floor and at a dis-tance of 1 m from each other.
Plate count agar (Difco) and malt extract agar (Difco) were used for total heterotrophs and fungi countings, re-spectively. The plate count agar plates were incubated at 35°C for 48 h and the malt extract agar plates at 25°C for 3 to 5 days. After the incubation period, the CFU were enu-merated according to the methodology mentioned on the Resolution no. 09 of the Anvisa, Ministry of Health, Jan 16th 2003. The results of CFU were calculated for each instrument and reported as CFU/m3 of sampled air.
Evaluation of microbiological contamination levels in indoor environments - The rates frequency of bacteria and fungi in 3060 air samples were studied from 1998 up to 2002. These samples were chosen at random basis in Rio de Janeiro city, being 2066 from offices, 201 from shop-ping centers, 171 from hospitals, and 622 from industries (production areas). The industries studied produced phar-maceuticals and hospital materials. All the environments evaluated were provided with central conditioning air systems.
Samples of 100 l of air colleted from each place using MAS-100 (Merck) were analyzed according to the meth-odology described above.
Temperature and air humidity measurements were per-formed with a digital hygro-thermometer (Instrutherm H210) and were made simultaneously to the air sampling. The instrument was placed on the same surface of the sampler and about 50 cm far from it.
The data analysis used in this report was prepared separately for the different environments evaluated. Once there were more available results for offices during the period from 1998 to 2002, the results concerning this envi-ronment were analyzed for each of those years. In this way, for industries, hospitals, and shopping centers, this evaluation was done with data colleted in different years, as a single data set. This evaluation was also performed considering the seasonality.
PCA - The correlation among four variables was in-vestigated: number of total heterotrophs, number of fungi, temperature, and air humidity. One of the reasons for us-ing the PCA (Massart et al. 1977, Miller & Miller 2000, Montgomery 2001) is the large set of data obtained in this study. Usually, these data are placed in tables with n lines
and m columns, where the lines represent the samples
and the columns represent the variables studied. This generates a matrix of data (n x m). Graphical visualization
is generally used to get information from the results. How-ever, when the number of variables is large, the plot of the data would result in a graphic with high dimension. As it is not possible to draw a plot in more than three dimen-sions, that is, a hyperplan, it is necessary to reduce this number. Then, the PCA technique is used. It reduces the number of variables through a linear combination of the original ones, projecting them in new axis, called principal components (PC).
The direction of the first principal component (PC1) is the one that presents major variance among the data of the original table and from where it is possible to get larger amount of information from the data set studied. The resi-dues are expressed in a second axis orthogonal to the PC1, called the second principal component (PC2). Plot-ting PC1 × PC2, it is possible to observe the multidimen-sional set of data in only two dimensions. The maximum number of PC’s is equal to the rank of the matrix (n×m). In
a loading plot one can see which variables influence the distribution observed in the score plot.
The projection of the samples in the plan defined by two PC’s, for example, PC1 and PC2, can be observed in a score plot, which is very used when it is necessary to determine the different behavior of the samples (objects). On the other hand, the projection of the variables in plans defined by two PC’s is called loading plot.
Therefore, the most important variable is the one with greater loading in the PC. The interpretation is based on the direction where the variables are placed in this graphic. Representing both, the score and loadings plots to-gether, one obtains a biplot. In this plot it can be ob-served the information of the two others, besides check-ing the variables influence on the samples.
Once it is possible to visualize linear combinations of all the variables in two dimensions, it is assumed that this technique allows reducing the data set dimension, simpli-fying its interpretation.
The PCA was carried out through the program Unscrable Version 8.0, Camo Process AS, Norway, 2003.
RESULTS
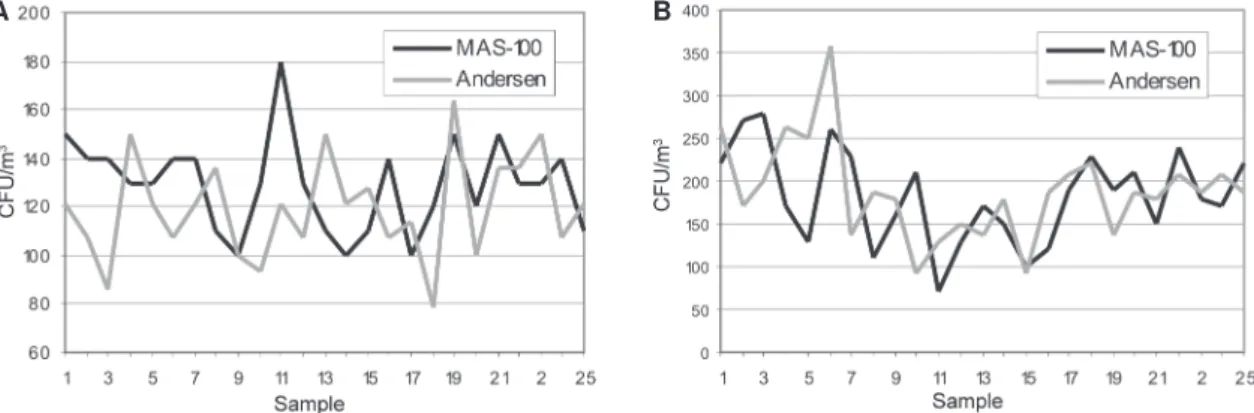
The results obtained with both air samplers (MAS-100 and Andersen samplers) are showed in Fig. 1A-B. They varied approximately in the same range during the sampling period. Although the results were not exactly the same, in general, the MAS-100 and the single stage Andersen sampler performances were equivalent. The fungal counts (Fig. 1A) as well as total heterotrophs counts (Fig. 1B) showed the same trend for both instru-ments.
It was also detected a gradual reduction of the het-erotrophs countings during morning period, which reached out its minimum value around the period when people were absent to have lunch. In the afternoon these countings rose gradually up to a maximum level at the end of working period (Fig. 1B).
353 353 353 353 353 Mem Inst Oswaldo Cruz, Rio de Janeiro, Vol. 100(4), July 2005
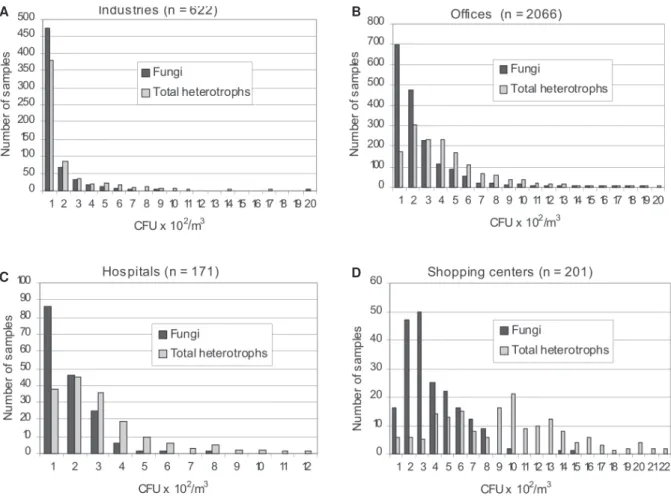
If the same parameter were applied to the total het-erotrophs countings 85.6% of offices, 90.8% of indus-tries, 93.1% of hospitals would be considered in agree-ment with the regulations. For shopping centers, how-ever, only 34.4% were found to be ≤ 750 CFU/m3(Fig. 2). The graphics presented in Fig. 3A-D allow a detailed analysis of the results distribution in classes of 100 CFU/ m3 each. It is possible to notice different behavior pro-files among the studied environments and the measured parameters (total heterotrophs and fungi).
The industries’ results (Fig. 3A) showed more impor-tant similarity concerning the samples distribution of fungi and total heterotrophs. In addition, these environments showed the lowest contamination levels, that is, the ma-jority of the samples was between zero and 100 CFU/m3. Comparing industries and offices distributions, it is pos-sible to notice that the offices’ results (Fig. 3B) showed a larger dispersion, around 300 CFU/m3, mainly concerning the airborne total heterotrophs. The same trend was ob-served concerning hospitals’ results (Fig. 3C), despite the lower number of samples, with an average of 200 CFU/m3. Shopping centers’ environments (Fig. 3D) showed a profile result for fungi very similar to that observed in offices and hospitals. In this case the samples distribu-tion tends to a normal pattern, with an average of 300
CFU/m3. Nevertheless, in relation to total heterotrophs, these studied samples presented a larger dispersion pat-tern than in the other environments. Considering all kinds of environments this had the highest average (1000 CFU/ m3).
Fig. 4 shows the monthly medias of the results sepa-rated according to their collecting period for total het-erotrophs and fungi. The samples were collected from offices during the years of 1998, 1999, and 2000. The data from 2001 and 2002 were incomplete because, due to the regulations, total heterotrophs were not analyzed any-more. Therefore, the data we have since 2000 were not included in the Fig. 4.
The total heterotrophs reached higher numbers in December, while fungi reached higher numbers in March, April, September, November, and December.
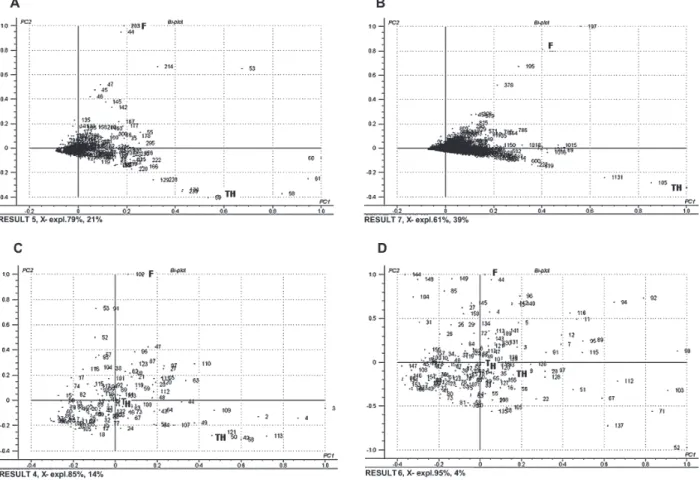
The plots obtained by PCA technique demonstrated the samples distribution in bidimensional space (Fig. 5A-D). The distribution was very homogeneous in the envi-ronments studied. This means that the analyzed air samples were similar, making a single group. The few samples, that were set apart from this group, corresponded to isolated cases, containing increased microorganisms countings when compared to the majority of the samples. However, such samples do not form a sub-group in relation to the bigger group.
In the obtained plots it is possible to observe that these samples were distributed according to three stan-dards as showed in Fig. 5A-D: samples with high concen-tration of heterotrophs and low concenconcen-tration of fungi (down and right); samples with low concentration of het-erotrophs and high concentration of fungi (high and left) and samples with low concentrations of heterotrophs and fungi (at the center of the plots). There were few samples in which the concentrations of total heterotrophs and of fungi had increased at the same time (high and right), however, these samples did not form a fourth pattern.
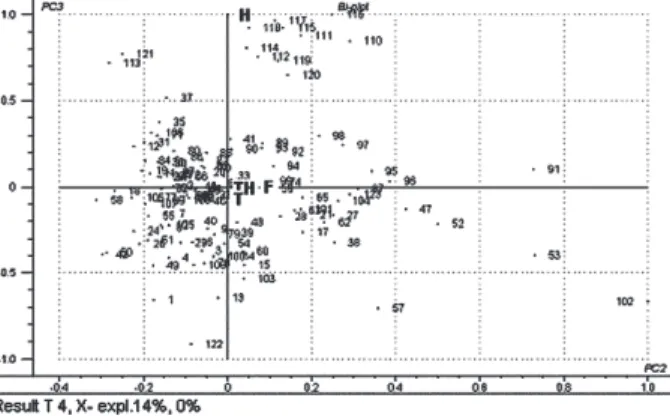
The PCA technique showed that, in the studied samples, temperature and humidity did not demonstrate influence on airborne microorganisms numbers, except for a few hospital samples (Fig. 6 – samples: 110, 111, 112, 114, 115, 117, 118, 119, 120).
A B
Fig. 1: MAS-100 and Andersen air samplers comparison related to A: fungi counts; B: total heterotrophs counts.
354 354 354 354
354 Indoor air microbiological evaluation • Zilma G Nunes et al.
DISCUSSION
There is still no consensus among experts regarding which methodology should be used for sampling bioaerosols and, to date, no standard method has been defined for enumerating microorganisms in indoor air qual-ity investigations. Lee et al. (2004) stated that comparison of air samplers instruments are needed because sampling results using different methods might be more easily
com-pared if consistent relationships between methods can be found.
In this study, despite the fact that the compared in-struments have different flow rates, the conclusion that both performances are equivalent, suggests that the MAS-100 is as adequate as the Andersen equipment, which flow rate is cited in the regulatory standards applied in Brazil.
These results can be very useful considering that the use of portable air samplers offer a great benefit because they are very simple to use and provide equivalent per-formance to the standard one, simplifying the interpreta-tion of the results of a great number of laboratories.
Although the good quality of the results obtained by multiple stage air samplers (May 1964), it is important to emphasize that the use of this kind of instruments makes the analysis slow, complex, and expensive.
Kotula et al. (1978) showed that there were technical and operational advantages on using single stage instru-ments and compared the effectiveness of a single and a multiple stage air samplers and found that the magnitudes of the differences were very small and of questionable importance.
In relation to the reduction of the total heterotrophs countings when less people are in the indoor
environ-A B
C D
Fig. 3 A-D: fungi and total heterotrophs distribution frequency of each environment studied according to the CFU/m3 results (interval groups of 100 CFU/m3).
355 355 355 355 355 Mem Inst Oswaldo Cruz, Rio de Janeiro, Vol. 100(4), July 2005
ment (Fig. 1B), it suggests that there is some correlation between the number of people present at the office and the total heterotrophs counts. This information could be used as a parameter of an excess of occupants/m3 or an insufficient air exchange rate.
The same behavior observed for the fungal counts with the two samplers (Fig. 1A), on the other side, is in agreement with the fact that the most probable sources of air contamination by these microorganisms are the furni-ture and other materials available in the environment (Prahl 1992).
Actually, the Brazilian limit of 750 CFU/m3 or any other, as a risk indicator to people’s health, is only a sug-gestive parameter considering the lack of epidemiological studies that have focused on the relationship between concentrations of any fungal components and human dis-ease. Nevertheless, concerning the majority sample re-sults, it is possible to state that they are in accordance with the local regulatory guideline.
Some authors have already suggested very different upper-limit values for fungi. Miller et al. (1988) assumed a maximum air fungal counting of 150 CFU/m3 and Morey et al. (1984) proposed that microbial contamination levels above 1000 CFU/m3 could indicate contamination risks to indoor occupants. Oghke et al. (1987) used the medium value of a data set collected (100 CFU/m3) in 11 public
buildings as the maximum limit for fungi, suggesting that higher values must have had a probable fungi source that should be investigated. On the other hand, Yang et al. (1993) suggested a maximum limit value of 200 CFU/m3 when they analyzed 2000 samples collected with a six-stage Andersen sampler.
The results observed in industries seem to be usual in this kind of environment and are surely due to the sys-tematical and severe cleaning and sanitization program, especially in the production areas, as well as an efficient control of the air climatization systems, considering the needs to prevent product contamination by dusts or mi-croorganisms.
The highest average (1000 CFU/m3) observed in shop-ping centers could be explained due to the fact that the number of people visiting shopping centers is very high, which is a very different condition from the other envi-ronments studied. Once these people can be one of the natural sources of the airborne microorganisms, can also be expected that the total heterotrophs countings tend to present higher values when a great number, or even an excess of people, is inside this environment. Such assump-tions lead again to the possibility of considering the total heterotrophic microorganisms, as well as fungi, as bio-logical indicators of adverse situations for the indoor air quality.
356 356 356 356
356 Indoor air microbiological evaluation • Zilma G Nunes et al.
Fig. 6: principal components analysis plot of hospital environment (PC2 × PC3) showing the influence of temperature and humidity over some samples: 110-112, 114-120; T: temperature; H: humid-ity; F: fungi counts; TH: total heterotrophs counts.
Few authors have worked with quantitative analysis of microorganisms in indoor environments. These stud-ies, in general, were carried out in different conditions of those used in this one (Spiegelman & Friedman 1968, Buttner & Stetzenbach 1993, Stewart et al. 1995), making difficult to compare these data. Macher et al. (1991) stud-ied a single person home environment, during the period of two years just after its construction and occupation. They found low values for bacteria and fungi, 98 CFU/m3 and 198 CFU/m3, respectively. However, this could be expected for that type of environment, where the occupa-tion rate and activities carried out were very low. Leite et al. (2004) analyzed 312 samples of different environments in Brazil and, although they had adopted different meth-odology for collecting the samples, they found similar values to those presented in this work, with 88.78% of the analyzed samples having fungi countings ≤ 750 UFC/m3. Regarding the seasonality, although Brazil is a tropi-cal country, the warm temperatures reached from Septem-ber to DecemSeptem-ber, corresponding to the summer-spring period, can possibly produce an ideal environment for the growth of fungi, as well as for total heterotrophs. It has to be considered that the absence of filters in the external air inlets of the buildings is an ordinary practice in Brazil. The relative increase of the fungi counts in March and April, in autumn season, was influenced by high val-ues only in 2000. Perhaps, these data are related to the variations of other environment factors such as air hu-midity and speed of winds, which happen to be different this year, so that further studies are necessary to corre-late them.
The PCA results, showing little importance of tem-perature and humidity in relation to the microorganisms counts is disagreement with the works of Kethley et al. (1957) and Pasanen et al. (1991), that related environmen-tal parameters, such as the temperature and the air humid-ity as important factors for the development of bacteria and fungi.
On the other hand, the PCA results also suggest that, possibly, the temperature and air humidity changes in the
offices and industries’ samples have not been intense enough to cause such alterations, or are associated to other variables not studied yet, influencing these micro-organisms dispersion or its elimination and leading to a lack of correlated results. The work of Zoberi (1961) cor-roborates this result when he assured that the reduction of the air humidity can speed up the release of fungi spores and, in this way, the reduction of this factor could cause an increase of the fungi counting values.
As previously described, distribution of heterotrophs and fungi countings plots, from 1998 to 2000, are in accor-dance with the influence of the temperature and the air humidity on the rates of microorganisms found. The months when an increase in the number of microorgan-isms was observed were those where the temperature and the air humidity normally rose in the outdoor environ-ment. Probably, this would be the cause of the increased number of microorganisms inside the building.
Concerning hospital environments, it is of high rel-evance to remember that due to the nature of the activi-ties developed in these places, we can find immu-nocompromised people, patients making use of respira-tory therapy and catheters, or even, submitted to surgery and other invasive medical process. In this case, the iden-tification of microorganisms species can be much more important than their amount determination in the air (Schaal 1991, McDonald et al. 1998).
Finally, this study revealed that despite the great ma-jority of the sites evaluated having shown suitable condi-tions, considering the current microbiological guideline, a continued surveillance must be applied periodically to detect possible changes in the background levels of air-borne microorganisms, aiming the welfare and health of the people exposed to climatized indoor air.
ACKNOWLEDGEMENTS
The first author is grateful to Prof. Paulo Márcio de Mello for the professional support and for providing the necessary conditions to perform this work.
REFERENCES
Al-Dagal M, Fung DY 1990. Aeromicrobiology – A review. Cri Rev Food Sci Nutr 29: 333-340.
Anvisa-Agência de Vigilância Sanitária 1998. Portaria no. 3523 de 28 de agosto. Regulamento Técnico contendo medidas básicas referentes aos procedimentos de verificação visual do estado de limpeza, remoção de sujidades por métodos físicos e manutenção do estado de integridade e eficiência de todos os componentes dos sistemas de climatização, para garantir a qualidade do ar de interiores e prevenção de riscos à saúde dos ocupantes de ambientes climatizados. Diário Oficial da União. Seção 1, 31(8), Brasília, p. 40-42.
Anvisa-Agência de Vigilância Sanitária 2000. Ministério da Saúde. Resolução - RE no. 176, de 24 de outubro. Orientação técnica elaborada por grupo técnico assessor sobre padrões referenciais de qualidade do ar interior em ambientes climatizados artificialmente de uso público e coletivo. Diário Oficial da União. Seção 1, 25 (10), Brasília, p. 32-33.
357 357 357 357 357 Mem Inst Oswaldo Cruz, Rio de Janeiro, Vol. 100(4), July 2005
interior em ambientes climatizados artificialmente de uso público e coletivo. Diário Oficial da União. Seção 1, 20 (01), Brasília, p. 35-37.
Buttner MA, Stetzenbach LD 1993. Monitoring airborne fun-gal spores in an experimental indoor environment to evalu-ate sampling methods and the effects of human activity on air sampling. Appl Environ Microbiol 5: 219-226.
Camo Process AS 2003. Unscrable, version 8.0, Camo Process AS, Norway. 1 CD ROM.
Chan P 1999. Indoor air quality and the law in Singapore. In-door Air 9: 290-296.
Hunter CA, Grant C, Flannigan B, Bravery AF 1988. Mould in buildings: the air spora of domestic dwellings. Intern Biodet 24: 81-101.
Kethley TW, Fincher EL, Cown WB 1957. The effect of sam-pling method upon the apparent response of airborne bac-teria to temperature and relative humidity. J Infect Dis 100: 97-102.
Kotula AW, Guilfoyle BS, Emswiler BS, Pierson MD 1978. Comparison of single and multiple stage sieve samplers for airborne microorganisms. J Food Prot 41: 447-449.
Lee KS, Bartlett KH, Brauer M, Stephens GM, Black WA, Teschke K 2004. A field comparison of four samplers for enumerating fungal aerosols. I. Sampling characteristics. Indoor Air 14: 360-366.
Lee SC, Chang M 1999. Indoor air quality investigations at five classrooms. Indoor Air 9: 134-138.
Lee SC, Chang M 2000. Indoor and outdoor air quality investi-gation at schools in Hong Kong. Chemosphere 41: 109-113.
Leite CC, Rego FLT, Silva MD, Assis PN, Moraes MB, Sousa LS 2004. Contaminação microbiológica do ar em ambientes internos de edifícios climatizados. Rev Anal 9: 39-41.
Loudon KW, Cole AP, Burnie JP, Shaw AJ, Oppenhein BA, Morris CQ 1996. Kitchens as a source of Aspergillus niger infection. J Hosp Infect 32: 191-198.
Macher JM, Huang F, Flores M 1991. A two-year study of microbiological indoor air quality in a new apartment. Arch Environ Health 46: 25-29.
Massart DL, Vandeginste BGM, Buydens LMC, de Jong S, Lewi PJ, Smeyers-Verbeke J 1997. Handbook of Chemometrics and Qualimetrics: Part A. Data Handling in Science and Technology – Volume A, Elsevier, New York, 867 pp.
May KR 1964. Calibration of a modified Andersen bacterial aerosol sampler. Appl Microbiol 12: 37-43.
McDonald LC, Walker M, Carson L, Arduino M, Aguero SM, Gomez P, McNeil P, Jarvis WR 1998. Outbreak of Acinetobacter spp. bloodstream infections in a nursery as-sociated with contaminated aerosols and air conditioners. Pediatr Infect Dis J 17: 716-722.
Menzies D, Bourbeau J 1997. Building-related illnesses. N Engl J Med 337: 1524-1531.
Miller JD, Laflamme AM, Sobol Y, Lafontaine P, Greenhalgh R 1988. Fungi and fungal products in some Canadian houses. Int Biodeter 24: 103-120.
Miller JN, Miller JC 2000. Statistics and Chemometrics for Analytical Chemistry, 4th ed., Prentice Hall, Harlow, 263 pp.
Montgomery DC 2001. Introduction to Statistical Quality Con-trol, 4th ed., John Wiley & Sons, Inc., New York, 796 pp.
Morey RP, Odgson MJ, Sorenson WG, Kullman GJ, Rhodes WW, Isvesvara GS 1984. Environmental studies in mouldy office buildings biological agents, sources, and preventive measures. Ann ACGIH10: 21-35.
Oghke H, Geers A, Beckert J 1987. Fungal load of indoor air in historical and newly constructed buildings used by public services. Proceedings of the 4th International Conference on Indoor air Quality and Climate, p. 681-684.
Pasanen AL, Pasanen P, Jantunen MJ, Kalliokoski P 1991. Sig-nificance of air humidity and air velocity for fungal spore release into the air. Atmospheric Environ 25: 459-462.
Prahl P 1992. Reduction of indoor airborne mould spores. Al-lergy 47: 362-365.
Rom WN, Travis WD, Brody AR 1991. Cellular and molecular basis of the asbestos-related diseases. Am Rev of Respira-tory Dis 143: 408-422.
Schaal KP 1991. Medical and microbiological problems arising from airborne infection in hospitals. J Hosp Infect 18: 451-459.
Spiegelman J, Friedman H 1968. The effect of central air filtra-tion and air condifiltra-tioning on pollen and microbial contami-nation. J Allergy 42: 193-202.
Stewart SL, Grinshpun SA, Willeke K, Terzieva S, Ulevicius V Donnelly J 1995. Effect of impact stress on microbial re-covery on an agar surface. Appl Environ Microbiol 61: 1232-1239.
Stone V 2000. Environmental air pollution. Am J Respir Crit Care Med 162: S44-S47.
Wasserman S 1988. Basic mechanisms in asthma. Ann Allergy 16: 477-482.
Wyon DP 2004. The effects of indoor air quality on perfor-mance and productivity. Indoor Air 14: 92-101.
Yang CS, Hung IL, Lewis FA, Zampiello FA 1993. Airborne fungal populations in non-residential buildings in the United States. Proceedings of the 6th International Conference on Indoor Air Quality and Climate, p. 219-224.