Air Pollution and Infant Mortality from
Pneumonia in the Rio de Janeiro
Metropolitan Area1
MARIA LOCIA F. PENNA~ & MILENA l? DUCHIADE~
444
The authors report the results of an investigation into the possible association between air poIlution and infant mortality from pneumonia in the Rio de Janeiro Metropolitan Area. This investigation employed multiple linear regression analysis (stepwise method) for infant mortalityflfom pneumonia in 1980, including the study population’s areas of residence, incomes, and pollution exposure as independent variab Ies.
With the income variable included in the regression, a statistically significant association was observed between the average annual level of particulates and infant mortality from pneumonia. While this finding should be accepted with cau- tion, it does suggest a biological association between these variables. The authors’ conclusion is that air quality indicators should be included in studies of acute respiratory infections in developing countries.
I
n 1978 Bulla and Hitze (2) pointed out the strong significance of pneumonia as a cause of death among children under five years of age in developing countries, a circumstance demanding preventive ac- tion. Preventive measures that have been proposed include applying the norms for adequate treatment of acute respiratory infections (ARIs), so as to prevent AR1 cases from worsening; vaccination against measles, whooping cough, and diphtheria; and control of risk factors such as indoor pollution (2).In the state of Rio de Janeiro, respira- tory diseases were the second major cause of infant mortality in 1985, account-
‘This article will also be published in Spanish in the
Bolefin de la Oficina Sanitaria Panamericanu, vol. 110. *Assistant Professor, Institute of Social Medicine,
University of the State of Rio de Janeiro. Mailing address: Instituto de Medicina Social. Univer- sidade do Estado do Rio de Janeiro, R. Slo Fran- cisco Xavier 524, 7O andar 20550, Rio de Janeiro, Brazil.
aInvestigator, National School of Public Health, Oswald0 Cruz Foundation.
ing for 18.5% of all deaths. Respiratory disease mortality followed mortality from causes originating in the perinatal period (46.5%) and exceeded mortality caused by infectious and parasitic diseases, in- cluding diarrheal diseases, which ac- counted for 16.7%. Pneumonias were the main cause of respiratory disease deaths, accounting for 77% of the total within this category. The relevance of these fig- ures is increased by the fact that causes of death in the population covered appear relatively well-defined, only 2.2% of the state’s deaths being ascribed to poorly defined causes (as compared to 22% of the mortality in Brazil as a whole).
National and international recommen- dations for controlling AR1 in developing countries have devoted relatively little at- tention to air pollution. For instance, the preventive measures cited by a Brazilian Health Ministry guidebook on control and care of acute respiratory infections (6) include only immunizations required in the first year of life and a proposal to
“avoid leaving the infant in environ- ments polluted by smoke from fires or cigarettes” (p. 13).
However, laboratory and population surveys (4, 5) have indicated that air pol- lution can have harmful effects. Indeed, studies associating increased death rates with air pollution have been carried out in many countries. In general, such studies have investigated increased mor- tality from chronic respiratory diseases, cardiovascular diseases, and cancer, mainly in adults and older people (7-9). There are also several studies concerned with alterations in lung function after acute and chronic exposure to pollution, primarily in school-age children (20-2 1). In addition, a number of recent studies have sought to evaluate the relationship between air pollutants and acute upper and lower respiratory tract infections (12-24), mainly in adults and school-age children.
Such surveys are not yet common in Latin America, even though in recent de- cades the area’s economic development process has been characterized by rapid industrialization and urbanization ac- companied by acute socioenvironmental problems. Today, some of the world’s greatest urban conglomerates, including centers like Mexico City and Sao Paulo, are found in Latin America. (Among these, the Rio de Janeiro Metropolitan Area, with a territory of 6,464 kmz, in- cludes about 10 million inhabitants living in the city of Rio de Janeiro proper and 12 peripheral cities.) Nevertheless, air pollu- tion is not so rigorously controlled as it is in the developed countries, and govern- ment authorities are only slowly becom- ing concerned with the environmental problems involved.
The aim of the study reported here was to investigate possible associations be- tween air pollution in the metropolitan area of Rio de Janeiro, as indicated by the amount of suspended particulate matter
in the atmosphere, and pneumonia mor- tality among children under one year of age.
MATERIALS AND METHODS
The Rio de Janeiro Metropolitan Area consists of 24 administrative regions per- taining to the city of Rio de Janeiro and 13 outlying municipalities. Detailed infor- mation about socioeconomic indicators for each of these regions and munici- palities (15) was available from the Bra- zilian Institute of Geography and Statis- tics for 1980, a census year, and so that year was selected for this work.
The socioeconomic indicators used in the study were (1) the proportion of households with a total income lower than two minimum wages, and (2) the proportion of households with a total in- come between two and five minimum wages. Since the minimum wage in 1980 was under US$30 per month, we used the first indicator to select families living in dire poverty and the second to select mainly poor families of semiskilled workers.
Data on the number of deaths among children under one year old, by cause and area of residence, were provided by the State Secretariat of Health, which is the agency responsible for collecting death certificates throughout the state and for codifying the underlying cause of death according to the rules of the IX In- ternational Classification of Diseases.
In order to estimate the number of live births occurring in the year of the study, we applied a correction factor to the sta- tistics provided by the Civil Register. This was necessary; for although birth regis- tration is mandatory in Brazil, cost con- siderations typically cause it to be carried out with some delay among the more im- poverished segments of the population. Using birth data from Civil Registry sta- tistics published up to 1988 (16), which
cited registered births reported in the year of the infant’s birth and in all subse- quent years (allowing for up to eight years ‘ delay in birth registration), we employed the method proposed by Sczwarcwald (17).
The correction factor calculation is based on the premise that after the third year of delay, the number of records will decrease in accordance with a geometric progression. By means of log-linear re- gression analysis of the available data, the proportion of underrecording was es- timated. The results seemed to agree with those of Brass, which were derived from census information (17).
Estimates of exposure to air pollution were based on the total amount of sus- pended particulates (pg/ms) in the sur- veyed areas. The data on particulates were provided by the State Foundation of Environmental Engineering (Fundacao Estadual de Engenharia do Meio Ambi- ente-FEEMA), which has 22 stations monitoring suspended particulates by collecting air samples over a 24-hour pe- riod every six days using the high-vol- ume sampler method (Hi-vol). These data indicate the air quality of 27 regions, because the metropolitan area’s geo- graphic characteristics delimit different basic zones, and so some stations mea- sure air quality for more than one region (18). Our analysis of these data included both the annual geometric mean for each region (average pollution) and the year’s maximum 24-hour concentration (maxi- mum pollution), since if there were a threshold for the existence of some bio- logical effect, the maximum figure should correlate better than the average figure with occurrence of that effect.
The data were examined by multiple linear regression analysis, using the step- wise method. The dependent variable was infant mortality due to pneumonia per 10,000 live births, while the indepen- dent variables were the percentage of
households with a total income lower than two minimum wages, the percent- age of households with total income be- tween two and five minimum wages, av- erage pollution in 27 administrative regions and municipalities of the Rio de Janeiro Metropolitan Area, and maxi- mum pollution in the same places (Table 1).
The weighted least squares method was used to deal with the variance het- erogeneity of the data. The weights were the number of live births, which were as- sumed to be proportional to the recipro- cal of mortality variances.
We then repeated the analysis, em- ploying as the dependent variable infant mortality from all causes per 1,000 live births, and also infant mortality from di- arrhea per 10,000 live births. This last analysis was done to see if air pollution could be associated with diarrhea mortal- ity-which would indicate an ecologic fal- lacy. All the analyses were carried out using the “Statistical Analysis System” (SAS) (19).
RESULTS
It was observed that of the 22 stations studied, 20 exceeded the quality standard in force (an average particulate pollution of 80 pg/ms), while 15 exceeded the daily maximum concentration standard of 240
pglm3,
some doing so more than once a year.The above-mentioned standards con- form with those used in the United States, making it appear that the popula- tions involved were subjected to high concentrations of air pollutants. The analysis (Table 2) yielded statistically sig- nificant regression coefficients for the proportion of households with a total in- come inferior to two minimum wages (t = 7.555, p = O.OOOl), the proportion of households with a total income between two and five minimum wages (t =
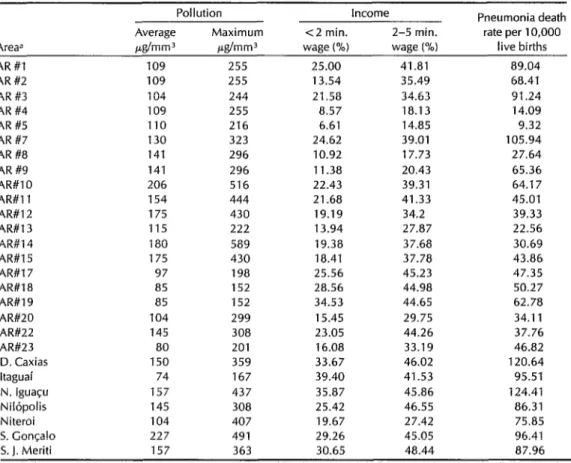
Table 1. Aggregate data for the 27 study areas, showing average and maximum particulate concen- trations, family income levels (<2 and 2-5 times the minimum wage), and infant mortality from pneumonia per 10,000 births.
Pollution Income Pneumonia death Average Maximum <2 min. 2-5 min. rate per 10,000 Areaa &mm3 i&mm3 wage (%) wage (%I live births
AR #I 109 255 25.00 41.81 89.04
AR#2 109 255 13.54 35.49 68.41
AR #3 104 244 21.58 34.63 91.24
AR #4 109 255 a.57 18.13 14.09
AR #5 110 216 6.61 14.85 9.32
AR #7 130 323 24.62 39.01 105.94
AR #8 141 296 10.92 17.73 27.64
AR #9 141 296 11.38 20.43 65.36
AR#lO 206 516 22.43 39.31 64.17
AR#ll 154 444 21.68 41.33 45.01
AR#l2 175 430 19.19 34.2 39.33
AR#l3 115 222 13.94 27.87 22.56
AR#l4 180 589 19.38 37.68 30.69
AR#l5 175 430 18.41 37.78 43.86
AR#17 97 198 25.56 45.23 47.35
AR#18 85 152 28.56 44.98 50.27
AR#19 85 152 34.53 44.65 62.78
AR#20 104 299 15.45 29.75 34.11
AR#22 145 308 23.05 44.26 37.76
AR#23 80 201 16.08 33.19 46.82
D. Caxias 150 359 33.67 46.02 120.64
ltaguai 74 167 39.40 41.53 95.51
N. Iguaqu 157 437 35.87 45.86 124.41
Nilbpolis 145 308 25.42 46.55 86.31
Niteroi 104 407 19.67 27.42 75.85
S. Got-gal0 227 491 29.26 45.05 96.41 5. J. Meriti 157 363 30.65 48.44 87.96
aThe letters “AR” refer to admlnlstratlve regions of the city of Rio de Janeiro, while the names refer to munlcipalitles. Four ad- mlnlstrative regions and seven municipalities were excluded from the study for lack of pollution data.
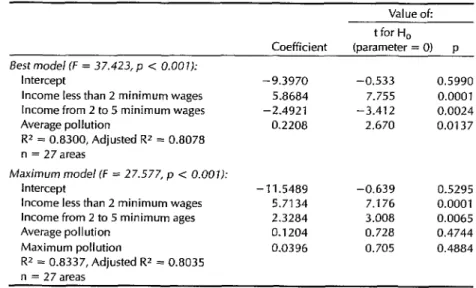
-3.412, p = 0.0024), and average pollu- tion (t = 2.670, p = 0.0137).
Maximum pollution was not included in the best model. The best model ex- plains 83% (R2 = 0.83) of the overall vari- ation in infant pneumonia mortality, but only 5.27% of the total variation can be explained by pollution (squared semi- partial correlation coefficient = 0.0527). However, pollution explains 23.7% (squared partial correlation coefficient
= 0.2366) of the residual variation after including in the model the two above- mentioned socioeconomic variables.
Table 2 also shows the maximum
50 Bulletin of PAHO 25(l), 1991
model. The inclusion of maximum pollu- tion resulted in loss of precision, with no significant regression coefficients for av- erage pollution and maximum pollution. The squared partial correlation coeffi- cients were 0.02351 for average pollution and 0.0221 for maximum pollution.
Table 2. Regression coefficients for the best and maximum models with infant pneumoniamortality as the dependent variable.
Value ok
Best model (F = 37.423, p < 0.001):
Intercept
Income less than 2 minimum wages Income from 2 to 5 minimum wages Average pollution
R* = 0.8300, Adjusted R2 = 0.8078 n = 27areas
Coefficient
-9.3970 5.8684 - 2.492 1
0.2208
t for H,
(parameter = 0) p
-0.533 0.5990 7.755 0.0001 -3.412 0.0024 2.670 0.0137
Maximum mode/ (F = 27.577, p < 0.001): Intercept
Income less than 2 minimum wages Income from 2 to 5 minimum ages Average pollution
Maximum pollution
RZ = 0.8337, Adjusted R* = 0.8035 n = 27 areas
- 11.5489 -0.639 0.5295 5.7134 7.176 0.0001 2.3284 3.008 0.0065 0.1204 0.728 0.4744 0.0396 0.705 0.4884
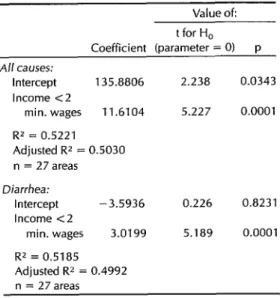
When the dependent variable (infant 51.9% and 52.2% of the variation in diar- pneumonia mortality) was replaced in rhea and general mortality, respectively turn with infant mortality from all causes (R2 = 0.5185,R2 = 0.5221).
and infant diarrhea mortality (Table 4),
the only independent variable accepted DISCUSSION by the model was the proportion of
households with a total income below These results agree with previous find- two minimum wages, which explains ings that attribute an increase in lower
Table 3. Correlation matrix for variables used in the analysis.
Income Pollution Mortality from: <2 min. 2-5 min.
wages wages Average Maximum Pneumonia Diarrhea All causes
Income:
<2 min. wages 2-5 min.
wages
Po//L/tion: Average Maximum
Death rate: From
pneumonia From
diarrhea From all
causes
1 .ooo
0.8597 1 .ooo
0.1637 0.2500 1 .oooo
0.1563 0.1488 0.8518 1 .oooo
0.8456 0.5995 0.3061 0.3512 1 .oooo
0.7201 0.6161 0.2121 0.1083 0.7060 1 .oooo
0.7226 0.6071 0.1781 0.1287 0.7922 0.8852 1 .oooo
Table 4. Regression coefficients for the models with infant diarrhea mortality and mortality from all causes as the dependent variable.
Value of: t for H,
Coefficient (parameter = 0) p A// causes:
Intercept 135.8806 Income <2
min. wages 11.6104
RZ = 0.5221 Adjusted RZ = 0.5030 n = 27 areas
2.238 0.0343
5.227 0.0001
Diarrhea:
Intercept -3.5936 Income <2
min. wages 3.0199
RZ = 0.5185 Adjusted RZ = 0.4992 n = 27 areas
0.226 0.8231
5.189 0.0001
respiratory disease morbidity and mortal- ity in children to pollutants of the S02- suspended particulates complex (5). Af- ter the 1952 smog in London, the direct biologic impact on the respiratory tract was attributed to suspended particulate matter, but today we cannot regard such effects as being due to nonspecific partic- ulates. Instead it is felt that measures of suspended particulate matter concentra- tions in the atmosphere function as a substitute for measures of other sub- stances, probably acid aerosols, that are responsible for the biologic effects (20).
Working with a measure of exposure that actually is a proxy variable for cau- sal exposure tends to weaken the ob- served association, increasing our confi- dence in the observed results. On the other hand, we used routine air pollution control data. These data are collected at monitoring sites whose locations tend to be selected for regulatory purposes; that is, they tend to be near sources of emis- sion rather than near places receiving av- erage exposures, and so they tend to reg-
52 Bdetin of PAHO 25(l), 1991
ister relatively high concentrations of pollutants (21). However, if this tendency toward overestimation of exposure were uniform, it would not introduce any bias into the type of analysis performed.
Among the difficulties involved in at- tributing infant pneumonia mortality to air pollution is one revealed by the litera- ture (9), which points out an association between the air pollution and socio- economic conditions, which in turn are associated in a causal way with infant mortality from pneumonia. This double association transforms socioeconomic conditions into a confounding variable, requiring some control.
Among socioeconomic indicators for which data are available, the one most closely related to pollution would appear to be income, which is also the one most closely associated with infant mortality. Hence, failure to include income in the model would probably lead to bias, whereas its inclusion could result in over- control, thus making the actual associa- tion appear weak. In this light, the asso- ciation found between infant pneumonia mortality and air pollution could be underestimated because of the model selected.
Indoor air pollution constitutes an- other possible confounding variable, one not subject to control in studies with ag- gregate data. However, for indoor pollu- tion to become a confounding variable in this present study (responsible for bias in the association between air pollution and infant pneumonia mortality), it would be necessary for indoor and outdoor air pol- lution to also be related, something that could only be explained by association of these two variables with socioeconomic conditions. Hence, control over socio- economic influences through the variable “income” would also provide some con- trol over the indoor air pollution variable.
should not constitute a confounding vari- able in our study for reasons of climate, dwellings located in the Rio de Janeiro Metropolitan Area generally being well- ventilated. Moreover, organic fuel is rarely used; and, when used, it is tradi- tionally burned in a place outside or well- separated from the main living spaces of the home.
Regarding indoor pollution by ciga- rette smoke, there are no nationwide data indicating whether smoking preva- lence is associated with low income. In the absence of empirical data suggesting a negative association between family in- come and indoor pollution by cigarette smoke, we presume that although the more privileged classes are more aware of the risks to small children presented by parental (especially maternal) smok- ing, Brazilian traditions do not encourage smoking among women, and cigarette smoking is not favored by the more im- poverished classes because of its high cost.
Our data set shows that average particulate pollution was a better proxy variable for exposure than maximum par- ticulate pollution. Specifically, the con- founding effect of the socioeconomic variables was found to be larger for maximum pollution than for average pollution.
The association observed in this study between air pollution and infant pneu- monia mortality must be regarded with the same caution reserved for other studies using aggregate data, because such studies are subject to “ecologic fal- lacy” and fail to provide measures of ef- fect such as relative risk. Nevertheless, the present findings are consistent with available knowledge on the subject; and their biologic specificity is suggested by exclusion of both variables related to air pollution from the regressions when the dependent variable was general infant mortality (all causes) or infant diarrhea
mortality (see Table 4), despite the fact that high correlation coefficients were found between these two air pollution variables and infant pneumonia mor- tality.
CONCLUSION
The investigation revealed an associa- tion between air pollution (measured in terms of the annual average concentra- tion of suspended particulates) and in- fant pneumonia mortality at the level of aggregate data for each administrative re- gion in the city of Rio de Janeiro and the other cities of the metropolitan area. This association persists even when the model includes the proportion of households with a total income below two minimum wages and the proportion with a total in- come between two and five minimum wages, which controls for the effects of socioeconomic conditions. The biologic character of this association is indicated by the model’s failure to accept pollution as an explanatory variable when dealing with general infant mortality or infant di- arrhea mortality.
This result must be regarded with the caution appropriate for findings derived from ecologic studies of this nature. At the same time, detection of this apparent association in combination with find- ings of other studies-including animal studies indicating changes in pulmonary defense mechanisms caused by exposure to air pollutants-clearly justifies greater involvement with this issue for the pur- pose of seeking reduced infant mortality from acute respiratory infections. In sum, the results suggest that air pollution mea- sures should be included in studies de- signed to detect risk factors for serious acute respiratory infections in urban areas of developing countries, where for the most part environmental control is not yet considered a priority matter.
REFERENCES
12.1. Bulla S, Hitze KL. Acute respiratory in- fections: a review. Bull WHO. 1978; 56(3):481-98.
2.
3.
4.
5.
6.
7.
8.
9.
10.
11.
World Health Organization, Technical Advisory Group on Acute Respiratory In- fections. Reporf
of
the Third Meeting. Ge- neva: World Health Organization; 1987; document WHO/RSD/87/37.Ministerio da Saude. Esfafisficas de morfal- idade, Brasil, 1985. Brasilia: Centro de Doc- umentacao do Ministerio da Saude; 1988. Shankar BP, Rao VS, Mannix RC, et al. Effects of pollutant atmospheres on sur-
face receptors of pulmonary macro-
phages. J Toxic01 Environ Health. 1988; 24:385-402.
Holland WW, Bennett AE, Cameron IR, et al. Health effects of particulate pollution: reappraising the evidence. Am ] Epidemiol. 1979;110(5):527-658.
Ministerio da Satide. Assisf&cia e
co&role
das infec@es respirato’rias agudas. Rio de Jan- eiro: Ministerio da SaudelINAMPS; 1984. Mazumdar S, Schimmel H, Higgins ITT. Relation of daily mortality to air pollution:an analysis of 14 London winters,
1958/59-1971172. Arch Environ Health. 1982;37(4):213-20.
Jacobson El. The role of air pollution and other factors in general mortality and
can-
cer mortality. Arch Environ Health.
1987;42(3):170-74.
Buffler PA, Cooper SP, Stinett S, et al. Air pollution and lung cancer mortality in Harris County, Texas, 1979-1981. Am J Ep- idemiol. 1988;128(4):683-99.
Saric M, Fugas M, Hrustic 0. Effects of urban air pollution on school-age chil- dren. Arch Environ Health. 1981;36(3): 101-8.
Arossa W, Spinacci S, Natale P, et al. Changes in lung function of children after air pollution decrease. Arch Environ Health. 1987;42(3):170-74.
13.
14.
15.
16.
17.
18.
19.
20.
23
Mostardi RA, Woebkenberg NR, Ely DL, et al. The University of Akron study on air pollution and human health effects: II, ef- fects on acute respiratory illness. Arch En- viron Health. 1981;36(5):250-55.
Love GJ, Lan SP, Shy MC, et al. The inci- lence and severity of acute respiratory ill- less in families exposed to different levels If air pollution, New York metropolitan Irea, 1971-1972. Arch Environ Health. 1981;36(2):66-73.
Charpin D, Kleisbauer JR Fondari J, et al. Respiratory symptoms and air pollution
changes in children: the Gardanne
Coalbasin study. Arch Environ Health. 1988;43:22-27.
Instituto Brasileiro de Geografia e Es- tatistica. Vol 1: IX recenseamento gerul do Brasil, 1980. Rio de Janeiro: Instituto Brasileiro de Geografia e Estatfstica; 1983: chap 4.
Instituto Brasileiro de Geografia e Es- tatistica. Vols 7-13: estatisficas do registro civil, 2980-1986. Rio de Janeiro: Instituto Brasileiro de Geografia e Estatfstica; 1988. Sczwarcwald CL. Mortalidade infantil no Estado do Rio de Janeiro, 1976-1980. Rio de
Janeiro: ENSP; 1984. (Mimeographed
document).
Fundacao Estadual de Engenharia do
Meio Ambiente. Volume 1: diagndstico am- biental do estado do Rio de janeiro. Rio de
Janeiro: FEEMA-DIPLAM; 1985.
SAS Institute. SASISTAT: guide
for
personal computer. Cary, North Carolina: SAS In- stitute; 1985. Version 6 ed.Lippman M, Thurston GD. Exposure as-
sessment: input into risk
assessment.
Arch Environ Health. 1988;43(2):113-37.
International Program on Chemical
Safety. Guidelines on sfudies in environmen- tal epidemiology. Geneva: World Health
Organization; 1983. (Environmental
health criteria 27).