I
Filipe Rodrigues Medina de Sousa
Degree in Biochemistry
Structural and functional investigation of type II
NADH:quinone oxidoreductase from the pathogenic
bacteria
Vibrio cholerae
and
Staphylococcus aureus
Dissertation to obtain the Master degree in Biochemistry for Health
Supervisor: Dra. Manuela M. Pereira
Co-Supervisor: Dra. Ana Paula Batista
Jury:
President: Doutor Pedro Matias Opponent: Prof. Carlos Salgueiro Members of the jury: Doutora Margarida Archer
Instituto de Tecnologia Química e Biológica, António Xavier
III
Structural and functional investigation of type II
NADH:quinone oxidoreductase from the pathogenic
bacteria
Vibrio cholerae
and
Staphylococcus aureus
Copyright
I
Agradecimentos
Em primeiro lugar quero agradecer às minhas orientadoras Dra. Manuela M. Pereira e Dra. Ana Paula Batista por me aconselharem, apoiarem e guiarem neste projecto e nesta aventura pessoal que foi escrever esta tese de mestrado. Espero não vos ter desiludido e ter correspondido da melhor forma que sei à oportunidade que me deram. Obrigado por me darem o espaço e o ambiente para errar e aprender. Por me permitirem perceber que o sentimento de curiosidade e espirito critico que sempre tive é algo de que me devo orgulhar.
Quero agradecer ao Professor Miguel Teixeira, como responsável da Metalloproteins and Bioenergetics Unit, me ter dado a oportunidade única de desenvolver a minha tese de mestrado no seu laboratório.
Quero agradecer ao Afonso, à Patricia, à Sandra, ao Bruno, ao Paulo, à Filipa Calisto, à Filipa Sena, à Andreia, à Dalila e ao Zé por facilitarem a minha adaptação a esta nova fase da minha vida e por todo o apoio cientifico e pessoal que deram ao longo deste ano. Em especial à Patricia por ter sido a minha segunda consciência em alguns momentos importantes, por todos os esclarecimentos cientificos e por toda a motivação e apoio nos momentos de dúvida. Ao Bruno por me espicaçar a curiosidade todos os dias, pelas horas a ouvir-me quando todos os outros já tinham desistido, pela amizade e ajuda a me integrar no grupo, mas principalmente por servir como exemplo de entrega, profissionalismo, competência e boa disposição . À Filipa Sena por me obrigar a exigir o máximo de mim, por toda a disponibilidade cientifica e pessoal, pela paciência e companhia, por ter partilhado a sua bancada, mas acima de tudo pelo apoio que me deu nos dias mais dificeis.
Ao ITQB, à FCT e à FCM por terem criado as condições necessárias para que eu pudesse desenvolver a minha tese de mestrado.
À professor Smilja Todorovic e à Dra. Célia Silveira do grupo Raman Spectroscopy of Metalloproteins pela disponibilidade e ajuda nas experiências de Voltametria ciclica.
À professora Teresa Catarino pela boa disposição, pela incansável disponibilidade e por todo o debate e ajuda prestada na recolha e análise dos resultados de Fast e Steady state Kinetics.
A todos os meus amigos que me dão a alegria, a motivação e a força para continuar a lutar. Em especial ao André, Nuno e Rafa por simplesmente serem o que são todos os dias mesmo quando o trabalho e a distância tenta atrapalhar.
À Joana pela amizade e apoio de sempre, nos bons e nos maus momentos. Por ao longo deste ano ter sido aquela presença amiga nesta nova fase.
II minhas birras mais parvas, por me dar a confiança que nunca tive, por me dar o seu carinho e a sua amizade incondicional que espero que durem para além das circunstâncias que hão de vir. Não estaria onde estou e não seria quem sou se não fosse pelo que me deste. É só deixar rolar.
Ao André, ao Ricardo e ao Hugo por serem aqueles irmãos de sempre e para sempre. Não é assim tão dificil pôr o nome dos amigos nos agradecimentos.
A toda a minha familia por me apoiar desde sempre em todos os erros que cometi. Por se interessarem e preocuparem com o que faço e com quem sou, por me educarem e moldarem na pessoa que hoje sou. Em especial à minha avó Manuela por me ter apoiado e motivado durante este ano complicado com toda a sua preocupação e dedicação.
Ao Afonso por ser o irmão de que me orgulho, e que me motiva a ser mais e melhor todos os dias para tentar acompanhar o seu ritmo. Porque há de ser sempre o meu mano mais novo.
III
Aims and motivations
Type II NADH:quinone oxidoreductases (NDH-2), are proteins which catalyze the transfer of two electrons from NADH to the quinone. Their study has received a new impetuous with the determination of its crystallographic structure, which made this project timely.
NDH-2 is considered a functional replacement of the respiratory Complex I, since it performs the same catalytic reaction as this protein complex and has been shown to restore the NADH dehydrogenase activity in Complex I deficient cells. NDH-2 is also the only protein with NADH:quinone oxidoreductase activity in some pathogenic organisms, like Vibrio cholerae and Staphylococcus aureus for example, having been proposed as possible new targets for rational drug design. For those two reasons the study of NDH-2 may have implications in human health and quality of life.
We aimed at investigating the catalytic mechanism of NDH-2 and the structural determinants for substrate specificity, considering that NDH-2 is capable of interacting with different quinones. Specifically our objectives were:
expressing, purifying and biochemically characterizing the NDH-2 from Vibrio cholerae for the very first time;
V
Resumo
Staphylococcus aureus e Vibrio cholerae são duas bactérias patogénicas que sozinhas são responsáveis pela morte de mais de 150.000 humanos por ano (afectando quase 5.000.000 de pessoas). Os antibióticos e as vacinas, em conjunto, já erradicaram algumas doenças infecciosas e surgem como as únicas hipóteses viáveis para o tratamento de algumas das doenças mais comuns de origem bacteriana.
VII
Abstract
Staphylococcus aureus and Vibrio cholerae are two pathogenic bacteria that, on their own, are responsible for more than 150,000 human deaths per year (affecting almost 5,000,000 people worldwide). Antibiotics and vaccines have been proved to work as a viable strategy to treat bacterial related epidemics such as cholera and MRSA associated infections. Nevertheless, new drugs are increasingly necessary due to the appearance of resistant strains.
IX
Index
Resumo ... V
Abstract ... VII
Index of figures ... XI
List of abbreviations ... XIX
1. Introduction ... 1
1.1 Energetic Metabolism ... 1
1.1.1 Cell Energy ... 1
1.1.2 Respiratory chains ... 2
1.1.3 Type II NADH:quinone oxidoreductases ... 5
1.2 Staphylococcus aureus ... 7
1.2.1 General characteristics ... 7
1.2.2 Respiratory chain ... 8
1.2.3 Type II NADH:menaquinone oxidoreductase ... 8
1.3 Vibrio cholerae ... 9
1.3.1 General characteristics ... 9
1.3.2 Respiratory chain ... 9
1.3.3 Type II NADH:ubiquinone oxidoreductase ... 10
2. Materials and Methods ... 11
2.1 NDH-2 Structural Models ... 11
2.2 Protein Expression and Purification ... 11
2.3 Biochemical characterization ... 12
2.3.1 Protein purity ... 12
2.3.2 UV-Visible spectroscopy ... 12
2.3.3 Protein and flavin quantification ... 13
2.3.4 Oligomerization state ... 13
2.3.5 Circular Dichroism ... 14
2.3.6 Thermal denaturation ... 14
2.3.7 Cyclic Voltammetry ... 15
2.4 Steady state kinetics ... 16
2.5 Fast kinetics ... 17
2.6 Fluorescence Quenching Studies ... 19
3. Results and Discussion ... 21
3.1 Type II NADH:quinone oxidoreductase from Staphylococcus aureus ... 21
3.1.1 Protein expression and purification ... 23
3.1.2 Protein purity ... 26
3.1.3 Protein concentration and flavin content ... 27
3.1.4 Structural analyses of NDH-2 from Staphylococcus aureus ... 28
3.1.5 Final structural considerations ... 39
3.1.6 Functional analysis of NDH-2 from Staphylococcus aureus ... 40
3.1.7 Final functional considerations ... 51
X
3.2.1 Protein expression and purification ... 55
3.2.2 UV-Visible spectroscopy and protein purity ... 58
3.2.3 Protein concentration and flavin content ... 59
3.2.4 Structural analysis of NDH-2 from Vibrio cholerae ... 60
3.2.5 Functional analysis of NDH-2 from Vibrio cholerae ... 63
4. Conclusions ... 65
5. References ... 67
XI
Index of figures
Figure 1. 1 - Schematic representation of respiratory chain components indicating their
respective enzymatic activities. A – ED:quinone oxidoreductase; B – quinol:EC oxidoreductase; C – EC:EA oxidoreductase. Adapted from (5). ... 2
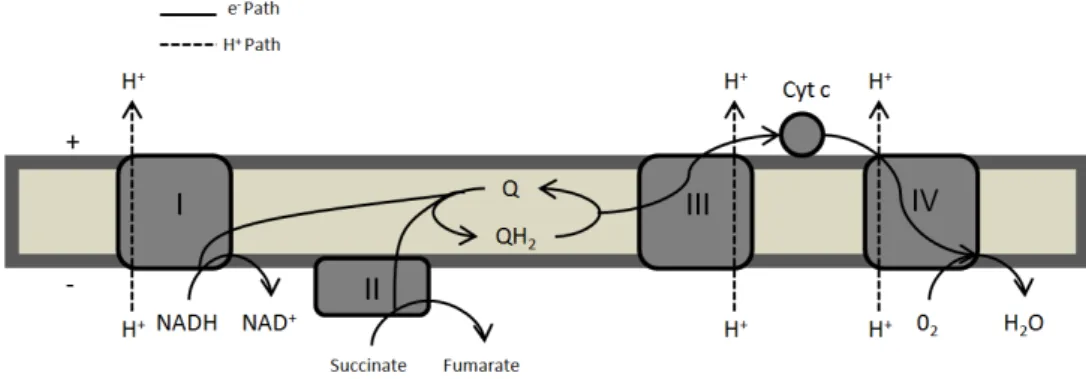
Figure 1. 2 - Schematic representation of the mammalian mitochondrial respiratory chain sequence. Complex I, III and IV transport electrons sequentially from NADH to O2, while translocating protons across the membrane. The electron carrier in the case of the mammalian respiratory chain is cytochrome c, and the expressed quinone is Ubiquinone. Complex II also feeds the quinone pool with electrons from succinate oxidation. ... 3
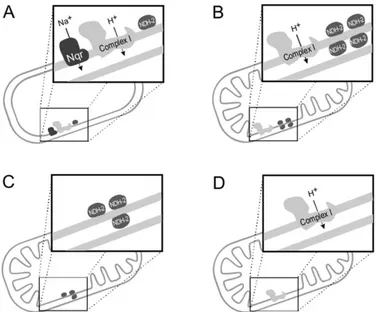
Figure 1. 3 - Schematic representation of the occurrence and localization of the three families
of respiratory NADH dehydrogenases. A - Prokaryotes may have all three types of NADH dehydrogenases. B - Mitochondria from fungi and strictly aerobic yeast may contain CpI and up to four different NDH-2. C Mitochondria from fermentative yeasts do not contain CpI, but up to three NDH-2. D - Mitochondria from higher eukaryotes only contain CpI, adapted from (13). ... 4
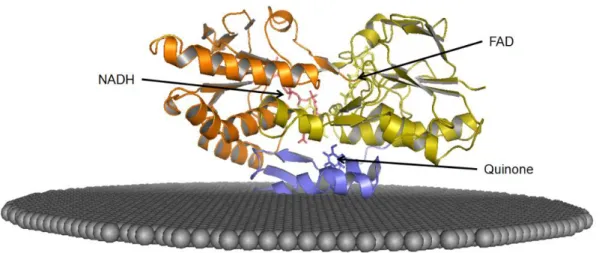
Figure 1. 4 - Cartoon representative of the crystallographic structure of NDH-2 from S. aureus, highlighting the three different domains. Staphylococcus aureus NDH-2’s protomer structure model divided by its domains: Orange – NADH binding domain; Yellow – FAD binding domain; Blue – C-terminal domain. Phospholipidic membrane is represented as gray spheres. The figure was constructed using Pymol . ... 5
Figure 2. 1 - Cyclic Voltammetry setup and representative Voltammogram with current intensity (µA) plotted vs Applied potential. (A) – Cyclic Voltammety instrument setup: We – working electrode; Re – reference electrode; Ce – Counter electrode; Ar - Argon entry point. (B) - Epc - Cathodic peack potencial; Epa - Anodic peack potential; Ei - Initial potential. The arrow represents the direction of the potential during the scan. Adapted from (58). ... 15
Figure 2. 2 - Schematic representation of the "Stopped Flow" apparatus. The arrow represents
the direction of the flow. Chambers’ A and B content is mixed in Chamber C and irradiated with light, which is then measured by the detector. ... 18
XII
Figure 3. 2 - Cartoon representing NDH-2_Sa mutants’ structure based in the WT structure
(PDB 4XDB). A – E172D; B – E172Q; C – E172S; D – E172A. FAD is represented in yellow, NADH in red and quinone blue sticks. The position of the cofactors is proposed based with a superimposition of the S. aureus structure with the PDB from S. cerevisiae NDH-2 (PDB 4G6H). ... 22
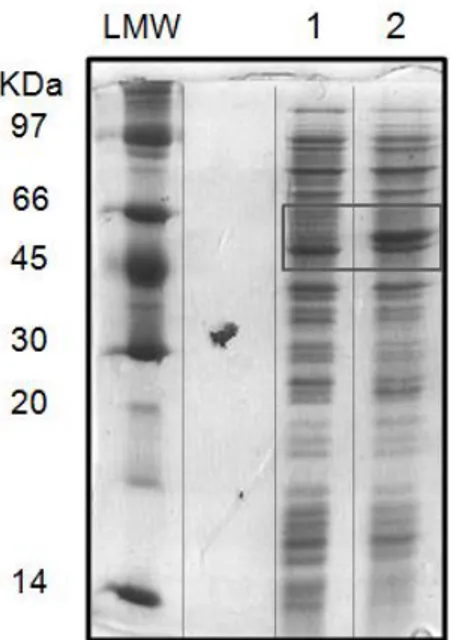
Figure 3. 3 - SDS-PAG exemplifying the NDH-2_Sa WT expression. SDS-PAGE: Stacking Gel
– 4 % acrilamide; Resolving Gel – 15 % acrilamide; Molecular mass of NDH-2_Sa: ~ 44 KDa. 1 – Growth of E. coli Rosetta cells before IPTG addition (OD600 = 0.6); 2 – Growth of E. coli Rosetta cells after 4 hours of induction. ... 23
Figure 3. 4 - Example of a chromatogram obtained in the purification of the E172A NDH-2_Sa
by a Q-Sepharose-HP column. In black filled line is represented the Abs280, in green dashed line is represented the % of 1 M NaCl, 100 mM phosphate buffer pH 7.0 . All the purified proteins presented similar elution profiles. ... 25
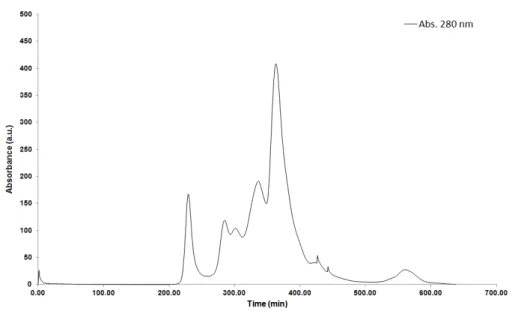
Figure 3. 5 - Example of a chromatogram obtained in the purification of E172A NDH-2_Sa by a
S200 column. In black filled line is represented the Abs280. This chromatogram serves as an example for all the size exclusion chromatographies performed during the purification of the studied proteins. ... 26
Figure 3. 6 - PAG with the purified NDH-2_Sa mutants and wild type at 15 µM.
SDS-PAGE: Stacking Gel – 4 % acrilamide; Resolving Gel – 15 % acrilamide; Molecular mass of NDH-2_Sa: ~ 44 KDa. Wells: 1 – LMW markers; 2 – NDH-2_Sa WT; 3 – E172A; 4 – E172Q; 5 – E172S; 6 – E172D. ... 26
Figure 3. 7 – Chromatogram of the protein standards’ size exclusion chromatography and
corresponding calibration curve. The absorbance at 280 nm is represented as a function of the eluted volume. A - Superimposed chromatograms obtained from the independent injections of the standard commercial proteins; B – The calibration curve (dotted line) was calculated by a linear regression of the elution volumes from the injection of cytochrome c (12 KDa), Mioglobin (17 KDa), BSA (67 KDa), Conalbomin (77 KDa), Glucose oxidase (160 KDa) and Ferritin (440 KDa) (filled black circles). ... 29
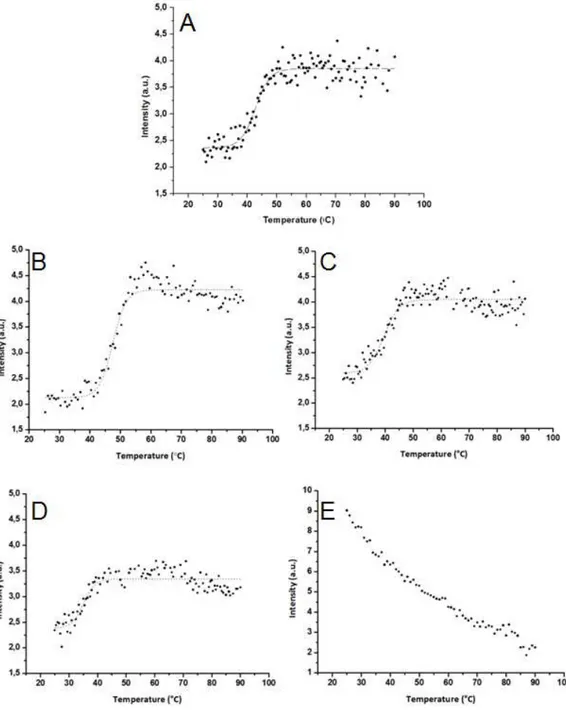
Figure 3. 8 - Thermal denaturation curves of the purified NDH-2_Sa proteins. In black dots is represented the fluorescence emission intensity at 530 nm (excitation at 450 nm) in function of the temperature, between 25 and 90 ºC, to each purified NDH-2_Sa mutant (6 µM). In dashed lines is represented the correspondent sigmoid fit. A – WT; B – E172A; C – E172Q; D – E172S; E – E172D. ... 31
Figure 3. 9 - Far UV CD spectra of the purified NDH-2_Sa wild type and mutants. A – WT; B –
XIII
Figure 3. 10 - Cartoon showing the NDH-2_Sa WT structure (PDB 4XDB) colored by its
different secondary structure features. In blue are represented the β-sheets, in red are the α -helices and in black is the random coil. In stick is highlighted the position of E172. The position of the cofactors is proposed based with a superimposition of the S. aureus structure with the PDB from S. cerevisiae NDH-2 (PDB 4G6H). ... 34
Figure 3. 11 - Example voltammogram from WT and E172S obtained with a scan rate at 50
mV/s. In bold black line is represented the voltammogram from NDH-2_Sa WT; in dashed black line is represented the voltammogram from E172S; in blue dashed line is represented the buffer control. The observed electric current peaks occur for every studied NDH-2_Sa at approximately -0.45 V. ... 35
Figure 3. 12 - UV-Visible absorbance spectra of the NDH-2_Sa WT. A – In black filled lines is represented the oxidized protein spectrum, in dashes lines is the NADH reduced protein spectrum; B – In black filled lines is represented the dithionite reduced protein spectrum, in dashes lines is the same spectrum after NAD+ addition. [NDH-2] = 6 µM. Adapted from (43). .. 36
Figure 3. 13 - UV-Visible absorbance spectra of the E172A NDH-2_Sa. A – In black filled lines
is represented the oxidized protein spectrum, in dashes lines is the NADH reduced protein spectrum; B – In black filled lines is represented the dithionite reduced protein spectrum, in dashes lines is the same spectrum after NAD+ addition. [NDH-2] = 6 µM; [NADH] = 12 µM; [NAD+] = 12 µM. ... 37
Figure 3. 14 - UV-Visible absorbance spectra of the E172Q NDH-2_Sa. A – In black filled lines is represented the oxidized protein spectrum, in dashes lines is the NADH reduced protein spectrum; B – In black filled lines is represented the dithionite reduced protein spectrum, in dashes lines is the same spectrum after NAD+ addition. [NDH-2] = 6 µM; [NADH] = 12 µM; [NAD+] = 12 µM. ... 37
Figure 3. 15 - UV-Visible absorbance spectra of the E172S NDH-2_Sa. A – In black filled lines
is represented the oxidized protein spectrum, in dashes lines is the NADH reduced protein spectrum; B – In black filled lines is represented the dithionite reduced protein spectrum, in dashes lines is the same spectrum after NAD+ addition. [NDH-2] = 6 µM; [NADH] = 12 µM; [NAD+] = 12 µM. ... 37
Figure 3. 16 - UV-Visible absorbance spectra of the E172D NDH-2_Sa. A – In black filled lines
is represented the oxidized protein spectrum, in dashes lines is the NADH reduced protein spectrum; B – In black filled lines is represented the dithionite reduced protein spectrum, in dashes lines is the same spectrum after NAD+ addition. [NDH-2] = 6 µM; [NADH] = 18 µM; [NAD+] = 30 µM. ... 38
Figure 3. 17 - Steady state kinetic curves from E172A NDH-2_Sa at 500 nM. A – Measured V0
XIV filled lines represent the fit obtained with the Michaelis-Menten equation. Specific activity was measured by following the decrease in the 340 nm absorbance (NADH consumption). ... 41
Figure 3. 18 - Steady state kinetic curves from E172Q NDH-2_Sa at 500 nM. A – Measured V0 vs [NADH] at 150 µM DMN; B – Measured V0 vs [DMN] at 100 µM NADH. The curves in black filled lines represent the fit obtained with the Michaelis-Menten equation. Specific activity was measured by following the decrease in the 340 nm absorbance (NADH consumption). ... 41
Figure 3. 19 - Steady state kinetic curves from E172S NDH-2_Sa at 500 nM. A – Measured V0 vs [NADH] at 150 µM DMN; B – Measured V0 vs [DMN] at 100 µM NADH. The curves in black filled lines represent the fit obtained with the Michaelis-Menten equation. Specific activity was measured by following the decrease in the 340 nm absorbance (NADH consumption). ... 41
Figure 3. 20 - Diagram illustrating the proposed mechanism of the quinol regeneration by O2. Molecular oxygen works as a final electron acceptor, since it has a higher reduction potential, increasing the driving force of the quinone reduction (and concomitant FAD oxidation) reaction. ... 44
Figure 3. 21 - NADH:DMN oxidoreductase activity inhibition curves with HQNO. A – E172A; B
– E172Q; C – E172S. Measured V0 vs [HQNO] at 100 µM NADH and 150 µM DMN... 44
Figure 3. 22 - Reduction and oxidation half reaction curves from E172A at 5 µM (after mixing).
A – Reduction half reaction curves (450 nm in red and 670 nm in blue); B – Oxidation half reaction curves (450 nm in red and 670 nm in blue). ... 46
Figure 3. 23 - Reduction and oxidation half reaction curves from E172Q at 5 µM (after mixing). A – Reduction half reaction curves (450 nm in red and 670 nm in blue); B – Oxidation half reaction curves (450 nm in red and 670 nm in blue). ... 46
Figure 3. 24 - Reduction and oxidation half reaction curves from E172S at 5 µM (after mixing).
A – Reduction half reaction curves (450 nm in red and 670 nm in blue); B – Oxidation half reaction curves (450 nm in red and 670 nm in blue). ... 46
Figure 3. 25 - Protein-substrate interaction curves, representing the % Fluorescence intensity
quenching plotted vs substrate concentration for the three studied NDH-2_Sa mutants (2 µM). A – E172A ∆Fmax% vs [DMN]; B - E172A ∆Fmax% vs [NADH]; C - E172Q ∆Fmax% vs [DMN]; D - E172Q ∆Fmax% vs [NADH]; E - E172S ∆Fmax% vs [DMN]; F - E172S ∆Fmax% vs [NADH]. In black filled lines is represented the fit for the HQNO free titrations, in black dashed lines is represented the fit for the curves in the presence of HQNO. ... 49
Figure 3. 26 - Cartoon representing NDH-2_Sa WT structure (PDB 4XDB) showing the E172
XV and E183 are also highlighted in sticks. The dashed black line serves as a visual guideline to the observable Glutamate line... 52
Figure 3. 27 - Cartoon representing NDH-2_Sa WT structure (PDB 4XDB) showing the E172, K379 and H51 localization and relative position to FAD (yellow), NADH (red) and quinone (blue), highlighted in sticks. A – NDH-2_Sa structure cartoon with a zoom in the E172 and proposed quinone binding location, showing in sticks the two amino acid residues with a positive side chain that are close enough to interact directly with E172; B – Zoomed image of the structural NDH-2_Sa WT model showing the proposed position of K379 relative to the quinone; C - Zoomed image of the structural NDH-2_Sa WT model showing the proposed position of K379 relative to the quinone after mutating E172 to an Alanine residue. The position of the substrates is proposed based with a superimposition of the S. aureus structure with the PDB from S. cerevisiae NDH-2 (PDB 4G6H). ... 53
Figure 3. 28 - SDS-PAG exemplifying the NDH-2_Vc expression E. coli Rosetta. SDS-PAGE: Stacking Gel – 4 % acrilamide; Resolving Gel – 15 % acrilamide; Molecular mass of NDH-2_Vc: ~ 47 KDa. Wells: 1 – LMW markers; 2 – E. coli Rosetta growth before induction with IPTG; 3 - E. coli Rosetta growth after four hours of induction with IPTG. ... 55
Figure 3. 29 - UV-Visible spectrum of NDH-2_Vc from the second purification. The UV-Visible
spectrum reveals an extra absorption peak at ~410 nm (left of the 450 nm flavin peak), thus supporting the idea that a cytochrome was contaminating the sample. ... 56
Figure 3. 30 - PAG of NDH-2_Vc preparation, after size exclusion chromatography. SDS-PAGE: Stacking Gel – 4 % acrilamide; Resolving Gel – 15 % acrilamide; Molecular mass of NDH-2_Vc: ~ 47 KDa. ... 58
Figure 3. 31 - Purified NDH-2_Vc UV-Visible absorbance spectrum. In black filled lines is
represented the spectrum of the oxidized protein; in dashed lines is represented the NADH reduced protein spectrum. ... 59
Figure 3. 32 - Native PAG with of NDH-2_Vc preparation, after size exclusion chromatography.
XVII
Index of tables
Table 3. 1 - NDH-2_Sa WT and mutants calculated R280/450 based on the absorbance intensities obtained from the UV-Visible spectroscopy. ... 27
Table 3. 2 - Protein concentrations determined based in the absorbencies at 280 and 450 nm measured in the corresponding UV-Vis spectra. The ε280 and ε450 values used were 50.364 mM-1cm-1 and 11.3 mM-1cm-1 respectively. ... 28
Table 3. 3 - Purified proteins' elution time in an analytical size exclusion chromatography
column S200 (25 mL), and their corresponding calculated molecular mass. ... 30
Table 3. 4 - Purified NDH-2_Sa R 208/222 and relative percentages. The values were obtained
from the CD spectra. ... 34
Table 3. 5 - Calculated formal reduction potentials for the free oxidized FAD and studied NDH-2_Sa. ... 35
Table 3. 6– Summary of the structural studies results for the purified NDH-2_Sa. ... 40
Table 3. 7 - Estimated Vmax values obtained from visual interpretation of the experimental curves, for the different NDH-2_Sa. ... 42
Table 3. 8 - Aerobic and Anaerobic NADH dehydrogenase activities for the purified NDH-2_Sa
mutants and wild type. The presented values from the anaerobic activities were taken from the steady state kinetic titrations with NADH. NADH dehydrogenase activities were measured by following the decrease of the absorbance at 340 nm, corresponding to the consumption of NADH. ... 43
Table 3. 9 - Calculated KI values for the NADH:quinone oxidoreductase activity by HQNO, for the three NDH-2_Sa mutants. ... 45
Table 3. 10 - Calculated reduction and oxidation half reaction rates of the purified NDH-2_Sa
mutants. The rates were calculated based in the variations of the absorbance at 450 nm. ... 47
Table 3. 11 - Calculated KD and %∆Fmax for both NADH and DMN, for the different NDH-2_Sa
WT and mutants in the presence and absence of HQNO. ... 50
Table 3. 12 - NDH-2_Vc concentration calculated by both the 280 and 450 nm absorbance intensities, and calculated %Flavin. ... 60
Table 3. 13– Purified NDH-2_Vc elution volume in a Size exclusion chromatography column. 60
Table 3. 14 - NADH:quinone oxidoreductase activities from NDH-2_Vc for different quinones
XIX
List of abbreviations
[X] - concentration of "X"
∆µH+ - proton electrochemical potential ∆Fmax - maximum quenching
2Fe-2S - 2 iron - 2 sulfur center Abs - absorbance
ATP - adenosine triphosphate
cAMP - cyclic adenosine monophosphate CD - circular dichroism
Cl- - chloride anion CpI/NDH-1 – complex I CpII – complex II CpIII – complex III CpIV – complex IV CT – charge transfer CV - Cyclic Voltammetry cyt c– cytochrome c
DBDF - two dinucleotide binding domains flavoprotein DDB - 2,3-Dimethoxy-5,6-dimethyl-p-benzoquinone DDM - n-Dodecyl-β-D-maltopyranoside
DLS - dynamic light scattering
DMN - 2,3-Dimethyl-1,4-naphthoquinone e-- electron
E. coli - Escherichia coli E172 - glutamate 172
E172A – type II NADH:quinone oxidoreductase from S. aureus, with Glutamate 172 mutated into an Alanine
E172D - type II NADH:quinone oxidoreductase from S. aureus, with Glutamate 172 mutated into an Aspartate
XX E172S - type II NADH:quinone oxidoreductase from S. aureus, with Glutamate 172 mutated into a Serine
EA - electron acceptor EC - electron carrier ED - electron donor
FAD- flavin adenine dinucleotide FMN - flavin mononucleotide H+ - proton
HMW - high molecular weight
HQNO - 2-n-Heptyl-4-hydroxyquinoline N-oxide IP - isoelectric point
IPTG - isopropyl-β-D-thiogalactosidase K - constant
KD - dissociation constant KI - inhibition constant
KM - Michaelis-Menten constant LMW - low molecular weight
MRSA - meticillin-resistant Staphylococcus aureus MSA - multiple sequence alignment
MT - melting temperature MW - molecular weight
MWC - Monod-Wyman-Changeux Na+ - sodium cation
Na+-NQR - sodium-translocating NADH:quinone oxidoreductase NAD+- oxidized nicotinamide adenine dinucleotide
NADH - nicotinamide adenine dinucleotide
NADPH - nicotinamide adenine dinucleotide phosphate
NDH-2_Sa – type II NADH:quinone oxidoreductase from Staphylococcus aureus NDH-2_Vc – type II NADH:quinone oxidoreductase from Vibrio cholerae
XXI PVL - Panton–Valentine leukocidin
Q - quinone QH2 - quinol
R280/450 - ratio between absorbancies at 280 and 450 nm rpm - rotations per minute
S. aureus - Staphylococcus aureus
S. cereviseae–Sacharomyces cereviseae
S200 - Superdex 200
SAXS - Small-angle X-ray scattering
SDS-PAGE - sodium dodecyl sulphate – polyacrilamide gel electrophoresis SEC – size exclusion chromatography
SHE - standard hydrogen electrode Trp - Tryptophan
UV-Vis - ultra violet-visible V. cholerae - Vibrio cholerae V0 - initial rate
Vmax - maximum rate WT - wild type
1
1.
Introduction
1.1 Energetic Metabolism
1.1.1 Cell Energy
The transformation and utilization of energy are common to all biochemical reactions needed to regulate and maintain the electrochemical disequilibria which we call life. Bioenergetics is a vast scientific domain, studying the mechanisms which allow the cell to harvest and store energy in the form of reduced substrates or electrochemical potentials.
Cellular metabolism can be divided in catabolic reactions (degrading reactions) and in anabolic reactions (synthesis reactions). In the catabolic phase, complex molecules with high energetic value (proteins, carbon hydrates and fats) are degraded into structurally simpler precursors (lactate, CO2 or NH3 for example) in a thermodynamic favorable process. In the anabolism reactions (biosynthesis) the same precursors are combined and transformed, with energy consumption, in biomolecules capable of playing all the functions that are characteristic of a living organism.
The energy contained in the catabolic thermodynamically favorable reactions may be harvested and conserved by the differential accumulation of chemical or electrical molecules between the two sides of the membrane. This electrochemical disequilibrium creates a ready to use potential which allows the cell to perform biochemical work needed to the perpetuation of its life such as solute transport, flagellar rotation or adenosine triphosphate (ATP) synthesis. The proton (H+) electrochemical potential is one of the main chemical gradients in the cell and is directly responsible for the synthesis of ATP (1).
The proton electrochemical potential (∆µH+, measured in kilojoules per mole) consists of two distinct components: an electrical potential resulting from the charge separation across the membrane (∆Ψ); and a chemical potential originated by the asymmetrical proton distribution through the membrane (∆pH).
Ψ
eq. 1 –Equation relating the electrical potential (∆Ψ) and chemical potential (∆pH) of the protons across
the membrane used to calculate the proton electrochemical potential (∆ H+
). F is the Faraday’s constant, R is the “ideal gas” constant and T is the temperature (2).
2 from electron transfers from highly negative reductive potential substrates (NADH or NADPH for example) to a final acceptor with a positive reduction potential (O2 in the case of aerobic organisms) (2).
In prokaryotes the respiratory chain proteins are expressed in the cellular membrane and they translocate protons from the cytoplasm into the periplasmic space. In eukaryotic organisms, in order to make the expression and regulation of these proteins as tight as possible, some subunits are coded in the mitochondrial genome and expressed in the inner membrane of this same organelle, while the rest is coded in the nucleus with signal peptides that orient those proteins into mitochondria (3). In the case of mitochondria, the proton electrochemical potential is created by translocating protons from the mitochondrial matrix to the inter membrane space.
Respiratory chains are as diverse as life on earth. Depending on the general metabolic needs of the organism, respiratory chains have changed and adapted to be able to act as slightly different transport systems (4). For the sake of comprehending the general constitution, mechanisms and function of respiratory chains, and despite not being fully representative, the mammalian mitochondrial respiratory chain was used as a model in this introduction.
1.1.2 Respiratory chains
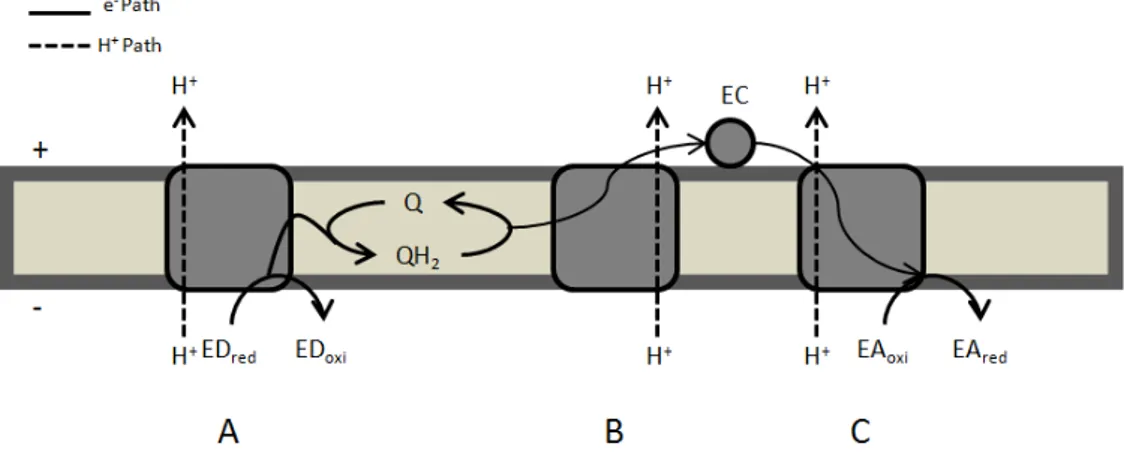
In general, respiratory chains are composed of membrane associated protein complexes with three different enzymatic activities: 1 - electron donor (ED): quinone (Q) oxidoreductase (Fig.1A); 2 - quinol (QH2): electron carrier (EC) oxidoreductase (Fig.1B) and 3 - electron carrier: final electron acceptor (EA) oxidoreductase (Fig.1C).
Figure 1. 1 - Schematic representation of respiratory chain components indicating their respective
enzymatic activities. A – ED:quinone oxidoreductase; B – quinol:EC oxidoreductase; C – EC:EA oxidoreductase. Adapted from (5).
3 chain, there are four different complexes (complex I to IV) that catalyze the electron transfer from the NADH or succinate to O2 through a redox potential span of 1,1V (in the case of NADH being the electron donor) (1, 6).
Complex I (EC:1.6.5.3), the largest of the four respiratory complexes, is composed of ~44 polypeptides, having a molecular mass of as much as 1 MDa, and as cofactors one Flavin Mononucleotide (FMN) and eight iron-sulfur clusters. This “L” shaped complex is the main entry point of electrons to the respiratory chain, feeding the quinone pool with electrons from NADH (NADH:quinone oxidoreductase). Complex I (CpI) catalyses the transfer of two electrons, reducing quinone to quinol, coupling this redox transfer with the translocation of H+ across the membrane (7-8).
From the quinol the electrons are transferred to cytochrome c in a reaction catalyzed by Complex III (quinol:cytochrome c oxidoreductase). Complex III (EC:1.10.2.2), or Cytochrome bc1 complex, is a transmembrane protein complex composed by a cytochrome c1, a cytochrome
b and a Rieske iron-sulfur subunit as its three catalytic subunits. This respiratory enzyme can have up to eleven subunits, but only cytochrome b and the Rieske subunit are conserved throughout this protein family (6, 9). Translocation of protons occurs through a Q-cycle mechanism first proposed by Peter Mitchell, in which there is an asymmetric consumption and release of protons in each side of the membrane. For every two electrons passing from quinol to cytochrome c, CpIII releases four protons at the positive side but takes only two from the negative side (10).
After being reduced, cytochrome c reduces Complex IV (CpIV). CpIV (EC:1.9.3.1), or cytochrome c oxidase, catalyses the final step in the electron transfer chain of mitochondria, the oxidation of cytochrome c, and the respective O2 reduction (cytochrome c:O2 oxidoreductase). Mitochondrial Complex IV has 13 subunits of which only two are considered to have catalytic activity (subunits I and II). During the reduction of molecular oxygen to two molecules of water, four protons are pumped to the positive side for every four electrons that are given to the system by cytochrome c (6, 11).
4 Although mammalian mitochondria present a relatively straightforward respiratory chain, some diversity is observed with the presence of secondary donor:quinone oxidoreductases. Besides CpI, a succinate dehydrogenase (Complex II – figure 1.2), an α-glycero-phosphate dehydrogenase and an electron transfer flavoprotein:ubiquinone oxidoreductase are responsible for supplying electrons into the quinone pool (12).
This diversity is even more obvious outside of the mammalian class, probably because of the multiplicity of different environments and consequent need to have more robust and adaptable respiratory systems. Depending on the growth conditions, the same organism can express different electron carriers (including quinones) and different respiratory proteins.
In prokaryotes the respiratory proteins are, in general, analogous to the mitochondrial ones but with less polypeptide chains (corresponding to the minimal functional units). In some cases the original protein may have been substituted by another one with similar function but different structure, and in other cases genes coding for the different enzymes performing the same enzymatic reaction may co-exist. In the specific case of the NADH dehydrogenases, CpI (or NDH-I) may be replaced by type-II NADH:quinone oxidoreductase (NDH-2) or even sodium-translocating NADH:quinone oxidoreductase (Na+-NQR). It is also possible to observe the presence of two or three of these NADH dehydrogenases in the respiratory chain of the same organism, their expression being dependent on the growth conditions. The presence of different types of NADH dehydrogenases in the same organism allows for adjustments of the overall redox state of the cell by regulating the flow of electrons/protons by oxidative phosphorylation (13).
Figure 1. 3 - Schematic representation of the occurrence and
5 1.1.3 Type II NADH:quinone oxidoreductases
Type II NADH:quinone oxidoreductase (NDH-2) is a respiratory enzyme that catalyses the transfer of two electrons from NADH to the quinone (ubiquinone or menaquinone – see Supplementary figure 6.2) contributing indirectly to the overall electrochemical potential, meaning it does not translocate protons across the membrane. This protein is distributed throughout the three domains of life. In eukaryotes, its presence has been described in plants (14), fungi (15) and protozoa (16). NDH-2 has also been identified in bacteria (17-19) and in archaea (5, 20). Depending on the organism, there can be several isoforms distributed through different organelles or at different sides of the same organelle, allowing the oxidation of NADH from different cell compartments (Figure 1.3).
NDH-2 is a membrane associated homodimeric enzyme, localized at the surface of the lipid bilayer through electrostatic interactions. Each monomer has approximately 45 KDa and has a non covalently bound FAD (Flavin adenine dinucleotide) as the only redox prostetic group (13, 21). NDH-2 belongs to the “Two Dinucleotide Binding Domains Flavoprotein” (DBDF) super family, which as the name indicates, are characterized by their two domains for the binding of FAD and a pyridine nucleotide. The DBDF super family includes other protein families such as glutathione reductases, dihydrolipoamide dehydrogenases, NADH:ferredoxin oxidoreductases, 2,4-dienoyl-CoA reductases and sulfide dehydrogenases(22-23).
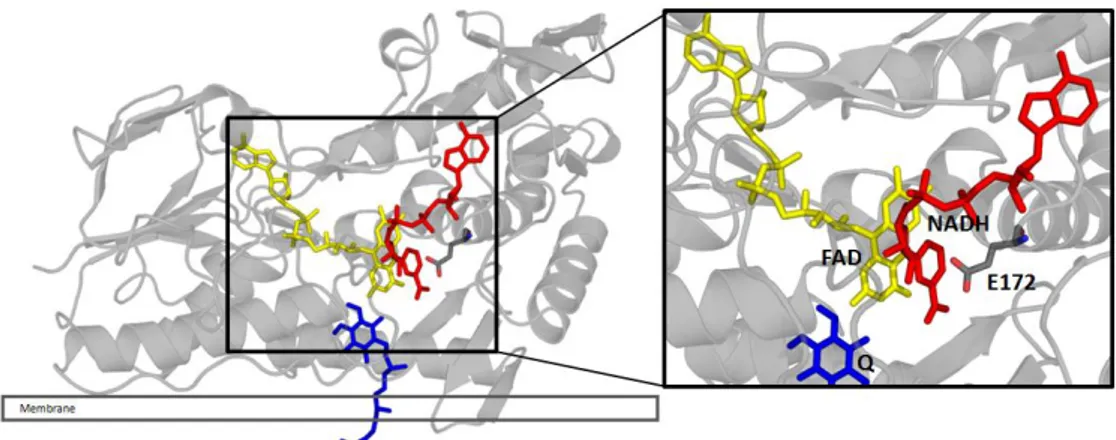
Roughly the structure of NDH-2 can be divided in three domains: 1 - Flavin binding domain, 2 - NADH binding domain; 3 - C-terminal domain (membrane interaction) (Figure 1.4).
Figure 1. 4 - Cartoon representative of the crystallographic structure of NDH-2 from S. aureus, highlighting the three different domains. Staphylococcus aureus NDH-2’s protomer structure model divided by its
6 The presence of FAD gives the characteristic yellow colour to the protein. The colour corresponds to a maximum absorption at 450 nm in the absorption spectrum (Supplementary figure 6.1). FAD, as well as NADH, binds to the protein by one of its two Rossman-fold domains, the dinucleotide binding domains, consisting of β-strand-α-helix-β-strand structures with GlyXGlyXXGly motives (21-22).
The C-terminal domain is thought to be responsible for the quinone binding and membrane anchoring. In vitro, a broad range of quinone substrates was proved to be accepted by the protein. Depending on the structure of the hydrophobic ring or in the size of their isoprenoid side chain, the enzyme performs different catalytic rates. Studies show that partial truncation of the bacterial C-terminal domain, specifically the terminal amphipathic helices, results in a soluble cytoplasmatic form of NDH-2, with no changes in its dimerization state, proving the membrane anchoring role of this structural feature (17).
Despite the recent advances in the structural knowledge of NDH-2, there is some debate about the binding site of the substrates hence the reaction mechanism associated with the redox turnover of the protein. Two different types of mechanism have been proposed for NDH-2 enzymatic activity: ping-pong or ternary complex. According to Iwata et al (24) NDH-2 has two overlapping binding sites for NADH and the quinone suggesting a single site ping-pong mechanism. In contrast Yang et al (25) proposed a ternary complex mechanism, with donor and acceptor both bound to the protein simultaneously in distinct binding sites. This ambiguity observed even at the very basic structural/mechanistic level illustrates how little is known about this protein family and the need of further exploring the molecular basis of its enzymatic functioning.
Inhibitors for type-II NADH:quinone oxidoreductases are rare and mostly unspecific. Mainly two classes of NDH-2 inhibitors are known: quinolones, in which HQNO (2-n-Heptyl-4-hydroxyquinoline N-oxide) is included, and phenothiazines. Besides this family of compounds,
just a few other molecules have been proposed to have inhibitor activity, but they are either hard to manipulate or have weak inhibiting activity (21, 26-29).
The presence of NDH-2 has not been reported in mammalian mitochondria, and has been proved to have an essential role in the bioenergetics of some human pathogens, sometimes being the only NADH dehydrogenase present. These observations led to the proposal of this enzyme as a new drug target to deal with pathogenic related diseases (28, 30-32).
7 sequenced and genes encoding type-II NADH:quinone oxidoreductases have become available for experimentation, opening new opportunities to study NDH-2.
1.2
Staphylococcus aureus
1.2.1 General characteristics
The organism Staphylococcus aureus (S. aureus) is a facultative anaerobic, Gram-positive, non motile, asporogenous, coccal bacterium belonging to the Firmicutes phylum. These bacteria can be frequently found in the human respiratory tract and in the skin.
Although S. aureus is not always pathogenic, infection can be caused by entering of the bacteria to usually sterile sites due to trauma or abrasion in skin or mucosa (33).
S. aureus is a frequent cause of skin infections, respiratory diseases (sinusitis), food poisoning and one of the five most common causes of hospital-acquired infections. Each year,
as much as 500,000 patients in United States’ hospitals contract a staphylococcal related
infection (34).
The treatment of choice for S. aureus infection was penicillin, but since the introduction of this antibiotic in 1943 the percentage of penincilin-resistant isolates has been growing, and by 1960 it had reached 80 %. Treatment of S. aureus became a therapeutic challenge, even with combination therapies with gentamycin and meticillin, after the rise of antibiotic-resistant strains in the 1960s and 1970s, particularly meticillin-resistant S. aureus (MRSA) (35).
MRSA represents between 5 and 54 % of clinical isolates in Western Europe (36) and over 50 % in the United States (37). Besides being more challenging to treat, MRSA has a significantly higher mortality than the susceptible isolates (38) and leads to longer hospital stays, therefore higher health care associated costs (39). It is the increasingly higher hospital associated costs that has alerted the industrialized countries to one of the biggest threats to human health into the second decade of the 21st century.
8 1.2.2 Respiratory chain
As facultative anaerobic bacteria S. aureus are able to perform both aerobic and anaerobic respiration, and also change into fermentative metabolism. Not much is known about S.aureus respiratory chain. Similarly to other Staphylococci species, it has genes coding for two A-type O2 reductases (40).
Based on genome analyses, there is no gene cluster that suggests the presence of Complex I nor of sodium-translocating NADH:quinone oxidoreductase (Na+-NQR) (http://www.sanger.ac.uk/resources/downloads/bacteria/staphylococcus-aureus.html), meaning that NADH oxidation, with its correspondent electron transport into respiratory chain, has to be performed by an alternative respiratory enzyme.
1.2.3 Type II NADH:menaquinone oxidoreductase
Type II NADH:menaquinone oxidoreductase (EC:1.6.99.3) from S. aureus (NDH-2_Sa), is a respiratory enzyme that catalyzes the transfer of two electrons from NADH to menaquinone (Staphylococci’s physiological quinone (41)). This 88 KDa dimeric membrane protein (44 KDa per monomer) has already been purified and characterized (42-43) and is one of the very few to have a crystallographic structure determined (44). As all NDH-2, this protein has two Rossman-fold domains for the binding of NADH and its cofactor FAD, and contains a C-terminal domain associated to the membrane docking. The protein is a dimer in solution as showed by the performed SAXS studies. It was also shown that binding of NADH to NDH-2 leads to the formation of a stable charge transfer complex characterized by the appearance of a band around 670 nm in the protein UV-Visible absorption spectrum. Fast kinetics studies showed that the limiting step of the reaction was the oxidation of FAD (and concomitant quinone reduction). HQNO was shown to inhibit the reaction and to affect the binding of the quinone and NADH differently (43).
9
1.3
Vibrio cholerae
1.3.1 General characteristics
Vibrio cholerae (V. cholerae), the etiological agent of cholera disease, is a facultative anaerobic, asporogenous, motile, curved, Gram-negative bacterium. There are over 130 different serougroups of V. cholerae but only O1 and O139 strains are associated with human disease (33).
Both O1 and O139 V. cholerae strains secrete an exotoxin known as cholera toxin which binds to a specific receptor (GM1 ganglioside) in the intestinal mucosa cells. The A subunit of this toxin is then released into the cell activating adenylate cyclase, leading to the increase of the cyclic adenosine monophosphate (cAMP) which inhibits the Na+ absorption by the cell. To compensate this ion gradient, cells are forced to pump Cl- to the intestine lumen, followed by water.
The pathogenesis of V. cholerae depends on the synergistic action of a number of other different factors which allow the cell to reach and colonize the human intestine, but the cholera toxin is the direct responsible for the most common symptoms associated with this disease, diarrheas and vomits. In acute cholera cases, the amount of water lost in the small intestine is greater than the possible reabsorption in the large intestine, eventually leading to death by dehydration.
These pathogenic bacteria are commonly found in places with poor sanitation and it spreads through contaminated food and water, colonizing the human small intestine. This association with non treated waters explains the higher cholera incidence in places like south Asia, Latin America and Africa (33, 45-46).
The worldwide incidence of cholera has increased approximately 25 % throughout the first decade of the 21rst century. In 2013 there were 129064 reported cases of cholera that are considered to be underestimated due to “the fear of negative impact on travel and trade” ( 46-47).
1.3.2 Respiratory chain
10 (http://gcid.jcvi.org/projects/msc/vibrio/ - March 2015), therefore the oxidation of NADH has to be performed by other respiratory enzymes.
The Vibrio cholerae’s Na+-NQR is a redox-driven pump that couples de sodium transport across the membrane with the electron transfer from NADH to quinone. This 210KDa respiratory enzyme is composed of six different subunits and contains a non covalently bound FAD, two covalently bound FMNs, a 2Fe-2S center, a non covalently bound riboflavin and an iron center (50-51).
1.3.3 Type II NADH:ubiquinone oxidoreductase
In addition we have identified another hypothetical NADH dehydrogenase, based on amino acid sequence analyses. This hypothetical enzyme is coded by the chromosome’s I VC1890 gene located between positions 2038194 and 2039498, and little or nothing is known about it. After blasting (52)theamino acid sequence coding already characterized NDH-2 from different organisms against the genome from Vibrio cholerae, the best scoring hit was identified as a NADH:quinone oxidoreductase. This hypothetical classification was further supported by the presence of the characteristic signature for Rossman-Fold domains (GlyXGlyXXGly) in the coding sequence.
We propose that this protein belongs to the NDH-2 family catalyzing the transfer of electrons from NADH to the ubiquinone (Vibrio’s physiological quinone), serving as another electron entry point to the Vibrio’s respiratory chain, having an estimated molecular mass of 47.5 KDa per monomer.
11
2.
Materials and Methods
2.1 NDH-2 Structural Models
NDH-2_Sa WT, E172A, E172S, E172Q, E172D and NDH-2_Vc structural models were generated using the Protein Homology/analogy Recognition Engine V 2.0 (Phyre2) web tool (53), using bacterial Staphylococcus aureus NDH-2 structure (PDB code 4XDB) as the crystallographic protein template.
The generated models were analyzed and used to create illustrational figures supporting theoretical discussions using PyMOL (54).
2.2 Protein Expression and Purification
Escherichia coli (E. coli) Rosetta 2 (DE3)pLysS cells (Novagen) were transformed with the plasmid pET-28a(+) containing the coding sequence of each of the studied NDH-2 (NDH-2_Sa WT, E172A, E172S, E172Q, E172D and NDH-2_Vc). Plasmids were made available for use in this project before the start of this thesis. Transformation was achieved using a heat shock protocol (55).
Cells were grown in 2YT rich medium with 100 µg/mL kanamycin (Roth) and 34 µg/mL chloramphenicol (Roth) at 37 ºC and 180 rpm. Protein expression was induced with the addition of 1 mM IPTG (isopropyl-β-D-thiogalactosidase) (Apollo Scientific) to the media when cells reached an optic density (OD600) of 0.6. After 4 hours of induction, cells were harvested by centrifugation at 8.000 rpm, 10 minutes and stored at -20 ºC.
Thawed cells were suspended in 100 mM phosphate buffer pH 7.0, 250 mM NaCl, containing a tablet of protease inhibitors (Roche), before being disrupted in a French Press at 6,000 psi. Disrupted cells were separated from non disrupted ones by centrifugation at 10,000 rpm, 10 min. The resulting supernatant was ultra-centrifuged at 42,000 rpm for 2 hours. The resulting pellet (membrane fraction) was resuspended in 100 mM phosphate buffer pH 7.0, 2 M NaCl, using a Potter homogenizer, and incubated at 4 ºC over night (under agitation). The membrane fraction was ultra-centrifuged again at 42,000 rpm for 1 h. The ionic strength of the resulting supernatant (soluble fraction), containing NDH-2, was lowered to 50 mM NaCl, with successive additions of 100 mM phosphate buffer pH 7.0, to a Amicon filtration system, at 4 ºC.
12 allowing following the absorbance of the eluted fractions at 280 and 450 nm. The purified proteins were stored at -80 ºC.
The described protocol was applied to all the studied NDH-2. For NDH-2_Vc specifically three different buffer´s pHs (6, 7 and 8) were tested during purification protocol optimization (see discussion).
2.3 Biochemical characterization
The biochemical characterization aimed first, to evaluate the quality of the protein samples, by determining its concentration, flavin content and purity; second, to make a preliminary spectroscopic characterization of the samples (allowing simultaneously to access its enzymatic redox reversibility, hence its correct functioning, and to obtain the protein UV-Visible spectra); and third to determine/confirm some more specific physical/chemical parameters such as molecular mass, oligomerization state, stability and secondary structure content.
2.3.1 Protein purity
Protein purity was evaluated by sodium dodecyl sulphate – polyacrilamide gel electrophoresis (SDS-PAGE) using a Mini-PROTEAN® Electrophoresis System (BIORAD). Samples, containing 15 µM NDH-2 in 5 µL of loading buffer (Tris-HCl 50 mM, pH8; SDS; Bromophenol Blue; Glycerol; β-mercaptethanol and Urea), were subjected sequentially for 15 minutes to 150 V, 400 mA, 200 W and 45 minutes to 180 V, 400 mA, 200 W in 4 % and 12.5 % acrilamide stacking and resolving gel respectively. Low molecular weight (LMW) standards (GE Healthcare) were used ranging from 14 to 97 KDa. Protein bands were revealed using Blue Coomassie Stainer (0.1 %).
2.3.2 UV-Visible spectroscopy
These spectroscopic studies had as main objectives the acquisition of both oxidized and reduced NDH-2 spectra, confirm the appearance of a charge transfer complex, assess protein quantification, as well as showing the reversibility of the system, hence its functionality, before proceeding into more advanced techniques.
13 prepared inside the anaerobic chamber with degassed water, and a Scavenging System, composed of 5 mM glucose (Roth), 4 U/mL glucose oxidase (Sigma Aldrich) and 130 U/mL catalase (Sigma Aldrich), was used.
Reduction of 6 µM NDH-2 was achieved by addition of NADH (12 µM for E172A, E172S and E172Q; and 30 µM for E172D and NDH-2_Vc) (Sigma Aldrich) or sodium dithionite (Sigma Aldrich) (same concentrations of NADH) and for its oxidation 2,3-Dimethoxy-5,6-dimethyl-p-benzoquinone (DDB) (Sequoia Research Products) (in the case of NDH-2_Vc) or 2,3-Dimethyl-1,4-naphtoquinone (DMN) (synthesized from menadione from Sigma Aldrich (56)) (for NDH-2_Sa mutants) respectively was added. The added quinone concentration was the same as NADH, to maintain a 1:1 ratio of substrates. Spectra were collected at wavelengths ranging from 250 to 900 nm, at 35 ºC and using 100 mM phosphate buffer pH 7.0, 250 mM NaCl.
2.3.3 Protein and flavin quantification
After purification, protein was quantified spectroscopically in a Shimadzu UV-1603 spectrophotometer, using the obtained spectra and extinction coefficients at 280 nm (ε280) of 50.364 and 35.534 mM-1cm-1 for NDH-2_Sa and NDH-2_Vc respectively. The ε280 were calculated using the following equation and considering the ε280 for the free oxidized flavin:
M-1cm-1
eq. 2 - Extinction coefficients at 280 nm (ε280) calculation formula based in the number of tryptophan,
tyrosine and cysteine residues in the amino acid sequence.
Flavin content was determined by comparing the results from protein and FAD concentration. FAD concentration was calculated by quantification of its absorbance at 450 nm using the extinction coefficient of 11.3 mM-1cm-1 for the free oxidized flavin.
2.3.4 Oligomerization state
14 To further confirm the oligomeric state of the purified proteins Native-PAGE was performed. The protein samples, containing 15 µM NDH-2 in 2.5 µL of loading buffer, 1 µL Coomassie blue G-250 sample additive and 10 µL of water, were loaded on a 1 mm thick, 3-12 % polyacrylamide gradient gel, containing 50 mM BisTris and 500 mM aminocaproic acid, and were subjected 1 hour to 150 V and followed by 40 min at 250 V, always at 4 oC. High molecular weight markers (GE Healthcare) were used ranging from 67 to 669 KDa. The anode buffer was 50 mM BisTris pH 6.8. The initial cathode buffer was 50 mM Tricine, 15 mM BisTris pH 6.8, and 0.5 % Brilliant Blue G-250 (used during the first hour) and the second cathode buffer was 50 mM Tricine, 15 mM BisTris pH 6.8, and 0.05 % Brilliant Blue G-250 (used during the last 40 minutes). At the end of the electrophoretic process, the gel was stained with Coomassie Blue to further guarantee an homogeneous staining (0.1 %).
2.3.5 Circular Dichroism
Circular Dichroism (CD) makes use of an optical characteristic of some materials, or structural features, in which light rays having different polarizations are absorbed in different proportions. In CD the quantification of the differential absorption of circularly polarized light may provide a set of different structural information about very different optically active molecules. The most common use of CD is in the study of secondary structure of proteins. Different secondary structure features, affect the CD spectrum of a protein differently, hence, it may be used to identify and calculate the relative percentage of α-helix/β-sheet/Turn/Unordered structure (57).
In this case the CD spectra of the different purified NDH-2_Sa mutants (E172A, E172Q, E172S and E172D) were acquired to investigate, in a non quantitative analysis, if the secondary structure was maintained when comparing with the wild type.
CD experiments were performed in a Spectropolarimeter J-815 at 25 ºC with 50 sequential acquisitions at 100 nm/sec. Spectra ranged from 260 to 200 nm. Proteins were studied at 5 µM concentration in 1 mM potassium phosphate buffer pH 7.0.
2.3.6 Thermal denaturation
15 emission at 530 nm. The assays were performed using 2 µM of protein in 100 mM phosphate buffer pH 7.0, 250 mM NaCl.
The Melting Temperature was calculated using the OriginPro8 software, fitting a Boltzman function (sigmoidal curve) to the data.
2.3.7 Cyclic Voltammetry
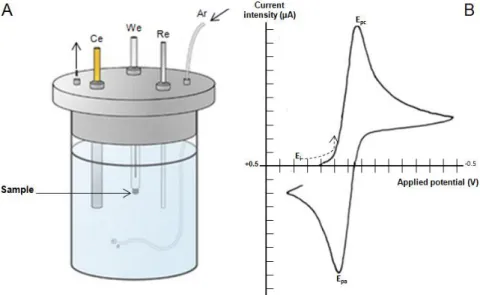
Cyclic Voltammetry (CV) is a technique that allows the study of electrochemical reactions. In a CV experiment a voltage is applied in a “working” electrode. Starting in a preselected value (Ei), the potential is scanned linearly, increasing until a determined limit (Switching potential), and then decreasing, returning to the starting value, thus completing the voltage cycle. During the scanning of the potential (measured against a reference electrode), the generated electrical current is recorded as a function of the applied potential originating a Voltammogram (Figure 2.1) (58). During the first half of the cycle, the potential has to reach a value that allows the studied sample to have been reduced originating a peak in the Voltammogram (Epc – Figure 2.1). In the second half of the cycle, starting in the switching potential, the sample is reoxidized giving rise to a second peak (Epa – Figure 2.1). The number of cycles, as well as the scan rate, can be varied to generate more robust data (59).
Figure 2. 1 - Cyclic Voltammetry setup and representative Voltammogram with current intensity (µA)
plotted vs Applied potential. (A) – Cyclic Voltammety instrument setup: We – working electrode; Re –
reference electrode; Ce – Counter electrode; Ar - Argon entry point. (B) - Epc - Cathodic peack potencial; Epa - Anodic peack potential; Ei - Initial potential. The arrow represents the direction of the potential during the scan. Adapted from (58).
16 In this case, Cyclic Voltammetry assays were meant to determine the formal reduction potential of the FAD in the studied NDH-2. The reduction potential (mV) was determined using a silver chloride electrode (Ag/AgCl) as the reference, graphite (Pg) as the working electrode and platinum (Pt) as the counter electrode. The electrolyte solution used was 100 mM potassium phosphate buffer pH 7.0, to ensure sufficient conductivity. The measurements were done with scan rates of 10, 20, 50, 75, 100, 150, 200, 300 and 500 mV/s and the recorded data were plotted as current (i) vs potential (E) to generate the cyclic Voltammogram trace. To ensure anaerobic conditions during the assays, a constant influx of Argon was maintained into the Voltammetry cell.
Reduction potentials were calculated by averaging the Epc and Epa values of each scan rate, and then reaveraging the values obtained from the nine tested scan rates. Final reduction potential was converted to have the reduction potential of the Standard Hydrogen Electrode (SHE) as reference.
2.4 Steady state kinetics
Enzyme kinetics is a general term that defines the study of chemical reactions catalyzed by enzymes. In these studies, reaction rates constants (k) are determined and the effect of different reaction conditions, such as substrate concentration, temperature or pH, are investigated. Briefly, steady state kinetics can be described as a specific approach in enzyme kinetics where the concentration of enzyme-substrate complex [ES] is considered to be constant during the time that the experimental reaction rates are measured (activity assays). This is achieved by maintaining the substrate concentrations [S] orders of magnitude above the enzyme concentration [E], meaning that virtually there is no free enzyme and that all of the protein is bound to its substrate (saturating conditions). As a biochemical model to enzymatic studies, the steady state kinetics model is an approach and does not fully represent all enzyme mechanistic behavior possibilities, but its ability to provide a working foundation that is both conceptually correct and easy to compare between different enzymatic systems, made it widely used.
Steady state activity assays were performed on a Shimadzu UV-1800 monitoring the change in the absorbance at 340 nm, corresponding to the wavelength at which the electron donor (NADH) absorbs the most. The reaction mixture (1000 µL) contained 20 nM of protein (final concentration) in the case of NDH-2_Sa WT and NDH-2_Vc; and 500 nM in the case of the studied NDH-2_Sa mutants; all diluted in 100 mM potassium phosphate buffer pH 7.0, 250 mM NaCl.
17 were prepared inside the anaerobic chamber with degassed water), and meant to determine both the substrates’ Michaelis-Menten constant (KM) and the maximum rate (Vmax) of the enzyme. To the NDH-2_Sa mutants, two independent curves were done. In the first titration DMN was used as electron acceptor at concentrations ranging from 5 to 150 µM (with NADH stable at 100 µM). In the second curve, NADH concentrations ranged from 5 to 100 µM (with the electron acceptor stable at 150 µM). In the case of NDH-2_Vc, single concentration measurements were performed (only the Vmax was studied) at 100 µM for NADH and 150 µM for both DDB and DMN.
NADH extinction coefficient of 6.22 mM-1cm-1 was used to calculate NDH-2 specific activity (µmol/min/mg protein). Measured initial rate (V0) was plotted vs substrate concentration. The Michaelis-Menten equation was used to create fitting curves to the experimental data, using a non-linear least-squares regression to determine KM and Vmax values.
Inhibition studies (still in anaerobic conditions) were performed in NDH-2_Sa mutants using HQNO. HQNO titrations were performed to calculate the inhibition coefficient (KI) of this inhibitor to the different NDH-2_Sa mutants. Titrations were made ranging the concentration of the inhibitor from 0 to 100 µM, maintaining NADH and DMN concentrations stable at 100 and 150 µM respectively.
Aerobic activity assays were performed at atmospheric O2 concentrations at 35 ºC, with 100 µM NADH and with both 0 and 150 µM of the quinones used in the anaerobic assays. All measurements were made in triplicates.
2.5 Fast kinetics
18 mechanism, information on short-lived reaction intermediates for example. As in steady state kinetics, the effect of parameters such as temperature, pH and reagent concentration on the kinetics of the reaction can be determined with a series of experiments.
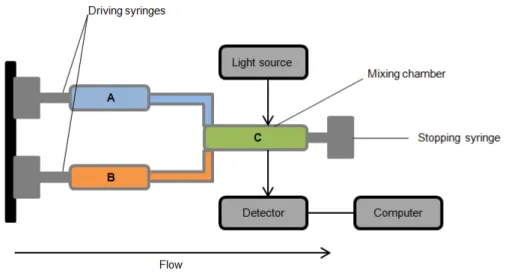
Figure 2. 2 - Schematic representation of the "Stopped Flow" apparatus. The arrow represents the
direction of the flow. Chambers’ A and B content is mixed in Chamber C and irradiated with light, which is
then measured by the detector.
The main goal of the fast kinetics experiments performed in the frame work of this thesis was the study of both the reductive and oxidative half-reactions and the charge transfer complex formation from the different NDH-2 by the determination of their kinetic parameters. As the majority of the redox reactions, electron transfer between NADH, NDH-2 and quinone occurs in the ms timescale and is dependent of environmental conditions like pH and temperature. In order to maintain conditions as reproducible as possible during all fast kinetics experiments, the temperature of the entire apparatus was maintained at 15 ºC and pH was controlled with 100 mM phosphate buffer pH 7.0, 250 mM NaCl (conditions previously optimized in this lab while performing similar studies (43)). 15 ºC was a temperature that was previously tested in the lab, in order to guarantee that the reaction was slowed enough to occur outside of the “dead time” period. If the fast kinetics assays would have been performed at 30 ºC, the majority of the reaction would have ended by the time the readings started.
Since O2 may interfere with the redox activity of the enzyme, generating misleading results, anaerobic conditions were guaranteed during all fast kinetics experiments by using the entire Stopped Flow apparatus inside an anaerobic chamber MBraun 130, where the oxygen level was kept bellow 1 ppm. To further ensure anaerobic conditions in the assays, all the solutions were prepared inside the anaerobic chamber with degassed water, and a Scavenging System (the same as the one described in the UV-Visible absorbance spectra assays) was used.
19 were followed at 450 nm and charge transfercomplexformation at 670 nm), to an exponential curve using the tool solver from Microsoft Office Excel. The missing data corresponding to the dead time (~3 ms) was extrapolated considering the values of the absorbance at time zero obtained from control experiments with only NDH-2.
Reductive half-reaction
For the study of the reductive half-reaction (electron transfer from NADH to the flavin) 10 µM of oxidised NDH-2 (syringe A) was mixed with 10 µM of NADH (syringe B) (1:1 ratio). During the first 150 ms (dead time not included) 100 UV-Vis spectra were acquired. Reductive half-reaction studies were performed to NDH-2_Sa WT, E172A, E172S, E172Q and E172D.
Oxidative half-reaction
For the study of the oxidative half-reaction (electron transfer from the flavin to quinone) 10 µM of oxidised NDH-2 (syringe A) was mixed with 20 µM of NADH and 30 µM of DMN (syringe B). These conditions allowed the protein to complete two turnovers and the final oxidation was considered to the determination of the oxidation rate. During the first 750 ms (dead time not included) 100 UV-Vis spectra were acquired. Oxidative half-reaction studies were performed to NDH-2_Sa WT, E172A, E172S, E172Q and E172D.
2.6 Fluorescence Quenching Studies
Protein fluorescence studies are frequently used as they rely on relatively simple apparatus and can provide valuable information about the studied protein. The recorded data is related to changes in the fluorescence of specific protein features, most commonly the tryptophan residues, by the action of a quencher molecule which can be a substrate, an inhibitor or any other ligand (60).
In the specific case of enzyme-substrate interaction, fluorescence quenching studies can be used to obtain, for example, substrate-enzyme dissociation constants (KD), substrate binding site relative positions or protein allosteric-induced conformational changes. Despite the ease with which the data is collected, a lot of variables have to be considered in order to allow a correct data analysis (61). The main goal of these Fluorescence quenching studies was the determination of the KD from both NADH and quinone to the different NDH-2_Sa.
20 being studied. The effect of HQNO (Alexis) in the protein quenching by both NADH and quinone was tested by repeating the above described titrations but this time in the presence of 100 µM of this inhibitor.
Tryptophan and flavin fluorescence emission spectra were recorded at 25 ºC with excitation wavelengths of 280 nm and 450 nm respectively. The variation of the emission at 330 nm (∆F) was normalized and represented as function of substrate concentration.
In order to determine the KD, the obtained titration data was used to simulate curves using the Monod-Wyman-Changeux (MWC) model equation (for dimeric enzymes):
eq. 3 - Monod-Wyman-Changeux (MWC) model equation (for dimeric enzymes) (62). [S] – substrate concentration; ∆Fmax – maximum fluorescence quenching; KS– equilibrium constant (replaced by KD); L – allosteric constant (considered as “0” for a non cooperative binding).