O be se wo m e n o n a lo w e ne rgy rice
and be an die t: e ffe cts o f le ucine ,
arginine o r glycine supple m e ntatio n
o n pro te in turno ve r
1Divisão de Nutrição Clínica, and 2Divisão de Medicina Geriátrica e Interna Geral
e Laboratório de Espectrometria de Massa, Departamento de Clínica Médica, Faculdade de Medicina de Ribeirão Preto, Universidade de São Paulo, Ribeirão Preto, SP, Brasil
J.S. Marchini1,
C.R. Lambertini1,
E. Ferriolli2 and
J.E. Dutra de O liveira1
Abstract
This study examined if leucine, arginine or glycine supplementation in adult obese patients (body mass index of 33 ± 4 kg/m2) consuming a
Brazilian low energy and protein diet (4.2 MJ/day and 0.6 g protein/ kg) affects protein and amino acid metabolism. After four weeks adaptation to this diet, each subject received supplements of these amino acids (equivalent to 0.2 g protein kg-1 day-1) in random order.
On the seventh day of each amino acid supplementation, a single-dose
15N-glycine study was carried out. There were no significant
differ-ences in protein flux, synthesis or breakdown. The protein flux (grams of nitrogen, gN/9 h) was 55 ± 24 during the nonsupplemented diet intake and 39 ± 10, 44 ± 22 and 58 ± 35 during the leucine-, glycine-and arginine-supplemented diet intake, respectively; protein synthesis (gN/9 h) was 57 ± 24, 36 ± 10, 41 ± 22 and 56 ± 36, respectively; protein breakdown (gN/9 h) was 51 ± 24, 34 ± 10, 32 ± 28 and 53 ± 35, respectively; kinetic balance (gN/9 h) was 3.2 ± 1.8, 4.1 ± 1.7, 3.4 ± 2.9 and 3.9 ± 1.6. There was no difference in amino acid profiles due to leucine, arginine or glycine supplementation. The present results suggest that 0.6 g/kg of dietary protein is enough to maintain protein turnover in obese women consuming a reduced energy diet and that leucine, arginine or glycine supplementation does not change kinetic balance or protein synthesis.
Co rre spo nde nce
J.S. Marchini
Divisão de Nutrição Clínica FMRP, USP
Av. Bandeirantes, 3900 14049-900 Ribeirão Preto, SP Brasil
Fax: + 55-16-633-6695 E-mail: jsmarchi@ fmrp.usp.br
Research supported by FAPESP (No. 97/09577-4).
Received August 10, 2000 Accepted June 28, 2001
Ke y wo rds
·O bese women ·Protein ·Glycine ·Arginine ·Leucine ·Stable isotope
Intro ductio n
Obese subjects have increased protein turnover, whole-body protein synthesis and oxidation compared with same age lean adults (1). It has been suggested that protein bal-ance in obese subjects is not maintained with a protein intake lower than 70 g/day when
energy is restricted to 1100 kcal/day (4.5 MJ) (2). Garlick et al. (3) have also shown that when energy is restricted, the nitrogen bal-ance decreases and is improved by high pro-tein intake.
treatment of obesity, but as a source of nitro-gen one can expect it to be effective. More-over, some amino acids have known phar-macological properties which could be of potential benefit for protein metabolism (4), and the effect of supplementation with these amino acids during low energy diets on obese persons has not been reported.
Two amino acids, arginine and leucine, are particularly recognized to have pharma-cological in addition to nutritional proper-ties. Arginine (L-2-amino-5-guanidinovaleric acid) is an aliphatic amino acid which has an important role in immune function and stimulates the release of growth hormone by the pituitary gland (5). Arginine is also a physiological precursor of nitric oxide (endothelium-derived relaxing factor) and this has been suggested as an explanation for its hypotensive effect on healthy subjects (6). Leucine (L-2-amino-4-methyl valeric acid) is a branched chain essential amino acid that has important roles in protein and glucose metabolism, neurotransmitter syn-thesis and lymphoid tissue metabolism (7).
This study was intended to test if supple-mentation with arginine and leucine improves protein and amino acid metabolism in obese patients consuming a low energy diet. To determine if any eventual changes in protein metabolism would be due to their pharmaco-logical properties, we also studied a period of supplementation with glycine, an amino acid with no such effects. All supplementa-tion periods were compared with nonsupple-mented (control) ones.
Mate rial and Me tho ds
Subje cts
Seven obese women aged 36 ± 8 years were studied. Each subject underwent de-tailed clinical evaluation and blood tests (complete hematologic cell count, plasma glucose, creatinine and urea levels) and, apart from obesity, no other acute or chronic
ill-nesses were detected. No subjects were preg-nant or breastfeeding. After the initial evalu-ation, a dietary history was obtained and each subject was instructed to eat a local rice and bean diet (see below) and to maintain their usual level of activity.
This study was approved by the local Ethics Committee. Written informed con-sent was obtained from each subject after detailed information about the purposes and risks of this research.
Study de sign
Each volunteer received a low energy rice and bean diet (4.2 MJ) with a total protein intake of 0.6 g kg-1
day-1
throughout the 8-week study period. This diet, which has been used in previous similar research protocols, does not have any amino acid deficiency and reflects a typical Brazilian diet (8-10).
After an adaptation period of 4 weeks, the rice and bean diet was supplemented with leucine, arginine and glycine in random order (equivalent to 0.2 g protein kg-1
day-1 ) for 7 days each, so that each subject partici-pated in four study periods. Between 7-day supplementation periods, the subjects re-ceived a nonsupplemented rice and bean diet for 2 days (washout period). A period of 7 days on a nonsupplemented diet was also studied (control).
On the 7th day of each period, a 9-h whole-body 15
N-glycine single-dose study was carried out (11) after a 12-h fast. Each subject was given six isoenergetic, isoni-trogenous meals at 2-h intervals, which vided half the total usual daily energy, pro-tein and supplemented leucine, arginine or glycine intake (i.e., 2.2 MJ, 0.3 g protein kg-1 day-1
from rice and beans, and an amino acid
supplement equivalent to 0.2 g kg- 1
day-1
). Two hours after the first meal, the bladder was emptied for baseline urine en-richment determination and a dose of 15
All urine was collected until the 9th h of study for urea and ammonia 15N enrichment determination. Two blood samples were taken for urea 15
N enrichment determination at 0 h and 9 h (12).
Pro te in turno ve r
Flux was calculated from the amount of isotope excreted in urine in the end product (urea and ammonia) over the 9-h study pe-riod. In addition, the amount of label re-tained in the urea pool at 9 h was used to adjust the result of flux based on the label excreted in urinary urea (13). Flux was cal-culated as: Q = d x Ex/ex, where Q is flux, d is the amount of isotope administered, Ex is the amount of end product excreted, and ex is the amount of isotope excreted as the end product over the study period. The end prod-uct average flux was taken as the harmonic mean of the estimates of flux based on the excretion of urea-N and ammonia-N, and was used in the calculation of protein thesis and breakdown rates (12). Protein syn-thesis and degradation were estimated from: Q = Nint + D = Ex + S, where Nint is nitrogen intake, D is the equivalent of protein degra-dation, and S is the equivalent of protein synthesis.
Sam ple analysis
Urine was collected into containers with 5 ml concentrated HCl. Samples were stored at -20oC until triplicate analysis. Aliquots were taken for duplicate determination of total nitrogen, ammonia-N, urea-N, ammo-nia-15
N, urea-15
N (14) and free amino acids (15). Total nitrogen was measured by the Kjeldahl method. Urea and ammonia were extracted sequentially by Conway diffusion and titration for mass spectrometry analysis by alkaline aeration. Isotope enrichment was measured with a mass spectrometer (Anca 20-20, Europa Scientific, Cheshire, England). Plasma amino acid was analyzed by
high-performance liquid chromatography (Shi-madzu Corporation, Tokyo, Japan) after precolumn fluorescence derivatization with ortho-phthaldialdehyde (15).
Statistical analysis
The repeated measures design was used for statistical analysis, with one-way within-subjects ANOVA (for repeated measures or amino acid supplement). Thus, the repeated measure factor had four levels: no ment, leucine supplement, glycine supple-ment and arginine supplesupple-ment, in random order (16). Post hoc comparisons were made
using the Tukey test. Fasted state was com-pared to fed state by the paired t-test. P
values of 0.05 or less were considered sig-nificant.
Re sults
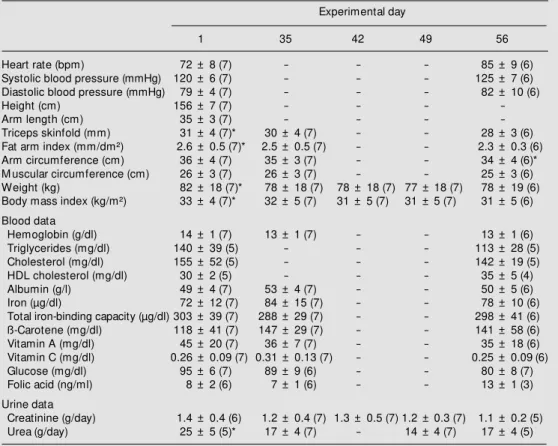
Anthropometric and biochemical data are shown in Table 1. Body mass index and arm fat index decreased significantly from day one to day 35 (adaptation period) and then remained constant up to the end of the study (Table 1). Blood biochemical data did not change significantly. Urinary urea excretion was higher on the first day of the study as compared to any other study period and uri-nary urea excretion remained constant from week 2 to 8.
Table 1. Clinical, anthropometric and biochemical data of the volunteers throughout the experimental protocol.
Experimental day
1 35 42 49 56
Heart rate (bpm) 72 ± 8 (7) - - - 85 ± 9 (6)
Systolic blood pressure (mmHg) 120 ± 6 (7) - - - 125 ± 7 (6)
Diastolic blood pressure (mmHg) 79 ± 4 (7) - - - 82 ± 10 (6)
Height (cm) 156 ± 7 (7) - - -
-Arm length (cm) 35 ± 3 (7) - - -
-Triceps skinfold (mm) 31 ± 4 (7)* 30 ± 4 (7) - - 28 ± 3 (6)
Fat arm index (mm/dm²) 2.6 ± 0.5 (7)* 2.5 ± 0.5 (7) - - 2.3 ± 0.3 (6)
Arm circumference (cm) 36 ± 4 (7) 35 ± 3 (7) - - 34 ± 4 (6)*
M uscular circumference (cm) 26 ± 3 (7) 26 ± 3 (7) - - 25 ± 3 (6)
Weight (kg) 82 ± 18 (7)* 78 ± 18 (7) 78 ± 18 (7) 77 ± 18 (7) 78 ± 19 (6)
Body mass index (kg/m²) 33 ± 4 (7)* 32 ± 5 (7) 31 ± 5 (7) 31 ± 5 (7) 31 ± 5 (6)
Blood data
Hemoglobin (g/dl) 14 ± 1 (7) 13 ± 1 (7) - - 13 ± 1 (6)
Triglycerides (mg/dl) 140 ± 39 (5) - - - 113 ± 28 (5)
Cholesterol (mg/dl) 155 ± 52 (5) - - - 142 ± 19 (5)
HDL cholesterol (mg/dl) 30 ± 2 (5) - - - 35 ± 5 (4)
Albumin (g/l) 49 ± 4 (7) 53 ± 4 (7) - - 50 ± 5 (6)
Iron (µg/dl) 72 ± 12 (7) 84 ± 15 (7) - - 78 ± 10 (6)
Total iron-binding capacity (µg/dl) 303 ± 39 (7) 288 ± 29 (7) - - 298 ± 41 (6)
ß-Carotene (mg/dl) 118 ± 41 (7) 147 ± 29 (7) - - 141 ± 58 (6)
Vitamin A (mg/dl) 45 ± 20 (7) 36 ± 7 (7) - - 35 ± 18 (6)
Vitamin C (mg/dl) 0.26 ± 0.09 (7) 0.31 ± 0.13 (7) - - 0.25 ± 0.09 (6)
Glucose (mg/dl) 95 ± 6 (7) 89 ± 9 (6) - - 80 ± 8 (7)
Folic acid (ng/ml) 8 ± 2 (6) 7 ± 1 (6) - - 13 ± 1 (3)
Urine data
Creatinine (g/day) 1.4 ± 0.4 (6) 1.2 ± 0.4 (7) 1.3 ± 0.5 (7) 1.2 ± 0.3 (7) 1.1 ± 0.2 (5)
Urea (g/day) 25 ± 5 (5)* 17 ± 4 (7) - 14 ± 4 (7) 17 ± 4 (5)
Data are reported as means ± SD, w ith the number of subjects given in parentheses. * P<0.01 compared to day 1 (ANOVA/Tukey test). Fat arm index = triceps skinfold/arm length; muscular circumference = arm circumference - p triceps skinfold; body mass index = w eight/height.
Table 2. Kinetic data after a single dose of 15N-glycine during the periods of no supplementation and supplementation w ith leucine, glycine or arginine (in random order).
No supplement Leucine Glycine Arginine
Total urine nitrogen, urea and ammonia after 9 h of 15N-glycine infusion (gN/9 h)
Ammonia 0.22 ± 0.23 0.26 ± 0.23 0.15 ± 0.15 0.18 ± 0.12
Urea 1.04 ± 1.32 1.33 ± 0.78 1.32 ± 0.69 1.22 ± 0.93
Total nitrogen 2.34 ± 1.80 2.56 ± 0.93 2.36 ± 0.73 1.94 ± 1.14
Urine ammonia 15N enrichment at baseline and after 9 h of 15N-glycine infusion (atom% excess)
Baseline 0.38 ± 0.01 0.38 ± 0.02 0.38 ± 0.01 0.38 ± 0.01
After 9 h 0.47 ± 0.04 0.48 ± 0.05 0.54 ± 0.15 0.47 ± 0.07
Urine urea 15N enrichment at baseline and after 9 h of 15N-glycine infusion (atom% excess)
Baseline 0.38 ± 0.01 0.38 ± 0.02 0.38 ± 0.01 0.38 ± 0.01
After 9 h 0.45 ± 0.04a 0.49 ± 0.02b 0.48 ± 0.05c 0.46 ± 0.03d
Blood urea 15N enrichment at baseline and after 9 h of 15N-glycine infusion (atom% excess)
Baseline 0.38 ± 0.01 0.38 ± 0.01 0.37 ± 0.05 0.38 ± 0.01
After 9 h 0.41 ± 0.02 0.40 ± 0.02 0.40 ± 0.02 0.40 ± 0.01
Protein kinetic data (gN/9 h)
Whole-body flux 55 ± 23 39 ± 10 44 ± 21 58 ± 33
Synthesis 54 ± 24 36 ± 10 41 ± 22 56 ± 36
Breakdow n 51 ± 24 34 ± 10 32 ± 28 53 ± 35
Balance (synthesis-breakdow n) 3.2 ± 1.8 4.1 ± 1.7 3.4 ± 2.9 3.9 ± 1.6
Table 3. Plasma and urinary amino acids before (fast) and after (fed) the kinetic study in obese subjects receiving a low energy rice and bean diet.
Supplement Urine data (µmol/l) Plasma data (µmol/l)
Leucine Glycine Arginine Without Leucine Glycine Arginine Without
supplement supplement
Fast Fed Fast Fed Fast Fed Fast Fed Fast Fed Fast Fed Fast Fed Fast Fed
Alanine 145 139 214 143 147 165 128 83 172 260 195 206 147 240 268 171
161 172 116 129 74 197 99 48 93 171 155 118 101 226 191 150
Arginine 69 145 249 107 148 111 310 114 409 390 348 292 279 431 400 337
61 161 233 96 139 98 452 77 247 186 197 73 100 270 140 98
Aspartic acid 26 39 52 33 27 33 52 39 80 89 55 51 49 69 68 59
21 25 40 27 11 28 43 32 50 36 29 21 14 28 23 10
Glutamic acid 53 81 171 60 64 108 86 124 353 412 385 352 313 340 416 365
29 66 142 70 59 143 48 125 162 153 299 65 53 134 132 84
Glycine 833 1753 2559 2319 796 1912 3706 763 386 307 318 187 140 379 294 188
867 1980 2640 3507 468 2794 3796 413 419 209 295 82 79 546 177 112
Isoleucine 23 62 23 23 11 25 20 11 58 101 67 80 58 72 76 70
20 89 13 22 13 25 15 5 26 109 32 42 10 31 21 19
Leucine 28 36 32 35 30 31 45 18 334 371 209 202 160 238 188 186
32 34 17 32 19 34 54 13 206 192 111 68 51 112 94 50
M ethionine 15 9 18 10 19 12 14 9 134 152 158 74 59 136 171 136
15 7 8 13 12 12 16 6 131 187 196 86 79 198 169 153
Phenylalanine 48 52 69 50 48 42 69 36 107 131 85 83 64 110 94 81
37 46 59 65 37 70 62 20 75 58 39 28 23 52 38 26
Serine 115 109 263 205 84 139 204 115 305 264 181 150 123 343 217 160
136 130 216 339 46 128 210 113 354 111 111 54 65 439 130 73
Threonine 149 159 292 231 134 181 221 149 211 210 185 149 135 201 216 170
124 137 116 273 118 200 183 79 144 76 138 51 34 155 76 36
Tyrosine 63 68 87 71 62 63 102 61 87 95 64 63 53 81 68 64
43 37 52 68 35 58 77 22 65 46 26 24 19 42 28 12
Valine 20 20 30 19 20 17 35 17 229 215 262 229 197 279 295 245
19 8 17 10 12 18 28 10 131 89 159 58 28 137 128 60
Data are reported as means ± SD.
D iscussio n
In this study, a protein intake of 0.6 g kg-1
day-1
was sufficient to maintain protein turnover in obese women on a reduced en-ergy diet. During the experimental protocol, as expected, there was a drop in anthropo-metric measurements, but from around the fourth week on, after the adaptation period, there was anthropometric and biochemical
stabilization. This may reflect the occur-rence of energy expenditure reduction in response to the reduced energy intake, a phenomenon demonstrated by other authors (17). For this research, this stabilization rep-resented, in fact, an advantage, as it elimi-nated the possibility of misinterpretation of results due to changes in body weight.
N-glycine (3,13). There is evidence that the method of 15N-glycine infusion employed in whole-body protein turnover studies (i.e., constant infusion, repeated or single dose) does not affect the results (3,13). Besides, the use of a single dose permits the repetition of the study for many times, allowing the follow-up of time course changes in protein synthesis and breakdown (3). For whole-body protein turnover studies it is assumed that the nitrogen pool is homogenous and that the nitrogen exchange among different pools is constant under the experimental conditions used. However, the hypothesis of homogeneity and stability of the metabolic pool of body nitrogen is valid only under exceptional circumstances (12,18). For this reason, the fact that in the present investiga-tion the same subject was studied under different conditions seems to be advanta-geous. Also, since this permitted the com-parison of results with baseline and with every other period, any possible method-ological problem would have been diluted in the overall experiment (19). Although this method implies an oversimplification of the complex reactions of protein kinetics in vivo,
when it is applied under controlled experi-mental conditions it affords useful informa-tion concerning the dynamics of human pro-tein metabolism (20).
Previous studies have shown that 0.6 g protein kg-1
day-1
is sufficient to keep the nitrogen equilibrium in healthy Brazilian persons on a rice and bean diet (9,10). It is possible that obese subjects have the same protein requirements, which remain un-changed during the low energy diet, as also proposed by others. Solini et al. (21) found no differences in leucine flux, oxidation or non-oxidative disposal between non-diabetic obese women and normal women. Other studies conducted on eutrophic subjects re-ceiving 0.5 g protein kg-1
day-1
(10,22) found a kinetic balance close to that of the present study. Vazquez et al. (23) showed that an increase of the protein composition of
isoen-ergetic weight reduction diets (2.5 KJ/day) from 50 to 70 g/day leads to no changes in nitrogen balance.
In the present study, whole-body nitro-gen flux (around 39-58 mg nitronitro-gen kg-1 h-1) was higher than that obtained for control subjects (around 17-46 mg nitrogen kg-1
h-1 ) (10,13) with a mean body mass index of 25 kg/m2
. Protein synthesis and breakdown were also higher than values reported in the litera-ture for normal body weight individuals (10,11,22) but similar to those reported for obese adolescents (24). One of these studies (10) was done using the same protocol/envi-ronmental conditions as the present study. It should also be pointed out that the variation in the data obtained here for obese subjects was similar to that observed in other studies of protein metabolism (1-3,20,21,24).
Leucine, arginine or glycine supplemen-tation (0.2 g kg-1
day-1
) did not improve kinetic balance or protein synthesis com-pared with the baseline diet period. It is possible that, as the subjects had no changes in protein metabolism induced by the low energy diet, any eventual effects of supple-mentation remained undetectable.
Urine and plasma amino acid profile did not show any remarkable differences, with the exception of high mean plasma values for phenylalanine, leucine and methionine when compared to literature values for eutrophic women (25). Plasma amino acid levels were not modified by supplementa-tion. Kihlberg et al. (19) have described high plasma levels of phenylalanine and leucine and also of isoleucine, valine, lysine, ty-rosine, proline and glutamic acid in obese women. These results suggest that obese women may have a particular amino acid profile, but this should be confirmed by fur-ther studies.
increasing protein synthesis rate. Obese sub-jects are able to keep a stable protein me-tabolism on a diet containing 0.6 g protein kg-1
day-1
and providing an energy intake of 4.2 MJ/day. Further trials with longer fol-low-up periods are needed to determine if nitrogen kinetic balance is maintained dur-ing very low energy treatment regimens (or even drug treatments). In addition, we
con-firm that single-dose protein turnover stud-ies are reliable, fast, inexpensive and easy to carry out in hospitalized patients. They can be used in short whole-body protein turn-over studies in patients for whom long, con-tinuous isotope infusion with gas and blood collection would be difficult or even impos-sible.
Re fe re nce s
1. Welle S, Barnard RR, Statt M & Amatruda JM (1992). Increased protein turnover in obese w omen. M etabolism, 41: 1028-1034.
2. Oi Y, Okuda T, Koishi H, Waki M , Kurata M & Nambu S (1987). Effects of low -energy diets on protein-metabolism stud-ies w ith [N-15]glycine in obese patients. Journal of Nutritional Science and Vitami-nology, 33: 227-237.
3. Garlick PJ, Clugston GA & Waterlow JC (1980). Influence of low -energy diets on w hole-body protein-turnover in obese subjects. American Journal of Physiology, 238: E235-E244.
4. Shah OJ, Anthony JC, Kim ball SR & Jefferson LS (2000). 4E-BP1 and S6K1: translational integration sites for nutri-t ional and horm onal inf orm anutri-t ion in muscle. American Journal of Physiology, 279: E715-E729.
5. Brittenden J, Heys SD, M iller I, Sarkar TK, Hutcheon AW, Needham G, Gilbert F, M cKean M , Ah-See AK & Erem in O (1994). Dietary supplementation w ith L-arginine in patients w ith breast cancer (> 4 cm) receiving multimodality treatment: report of a feasibility study. British Jour-nal of Cancer, 69: 918-921.
6. Hishikaw a K, Nakaki T, Suzuki H, Saruta T & Kato R (1991). L-arginine-induced hypo-tension. Lancet, 337: 683-684.
7. Schauder P, Wahren J, Paoletti R, Ber-nardi R & Rinetti M (1992). Branched-Chain Amino Acids. Biochemistry, Phys-iopathology and Clinical Science. 1st edn. Raven Press, New York.
8. Vannucchi H, Duarte RM F & Dutra de Oliveira JE (1981). Nutritive value of a rice and beans based diet for agricultural mi-grant w orkers in Southern Brazil. Nutri-tion Reports InternaNutri-tional, 24: 129-134. 9. Vannucchi H, Duarte RM F & Dutra de
Oliveira JE (1983). Studies on the protein requirements of Brazilian rural w orkers (“ bóias-frias” ) given a rice and bean diet.
International Journal for Vitamin and Nu-trition Research, 53: 338-344.
10. M archini JS, M oreira EAM , M oreira M Z, Hiram atsu T, Dutra de Oliveira JE & Vannucchi H (1996). Whole-body protein metabolism turnover in men on a high or low calorie rice and bean Brazilian diet. Nutrition Research, 16: 435-441. 11. Fern EB, Garlick PJ, M cNurlan M A &
Waterlow JC (1981). The excretion of iso-tope in urea and ammonia for estimating protein turnover in man w ith [15N]glycine. Clinical Science, 61: 217-228.
12. Fern EB, Garlick PJ & Waterlow JC (1985). Apparent compartmentation of body ni-trogen in one human subject: its conse-quences in measuring the rate of w hole-body protein synthesis w ith 15N. Clinical Science, 68: 271-282.
13. Grove G & Jackson AA (1995). M easure-ment of protein-turnover in normal man using the end-product method w ith oral [N-15]glycine - comparison of single-dose and intermittent-dose regimens. British Journal of Nutrition, 74: 491-507. 14. Waterlow JC, Garlick PJ & M illw ard DJ
(1978). Protein Turnover in M ammalian Tissues and in the Whole Body. North-Holland Publishing, Amsterdam, North-Holland. 15. Lindroth P & M opper K (1979). High per-formance liquid-chromatographic determi-nation of subpicomole amounts of amino-acids by precolumn fluorescence derivati-zation w ith ortho-phthaldialdehyde. Ana-lytical Chemistry, 51: 1667-1674. 16. StatSoft (1994). Statistics for Window s:
Statistics II. Vol. 3. StatSoft, Inc., Tulsa, OK. 17. Roberts SB, Fuss P, Heyman M B, Dallal GE & Young VR (1996). Effects of age on energy expenditure and substrate oxida-tion during experimental underfeeding in healthy men. Journals of Gerontology. Se-ries A, Biological Sciences and M edical Sciences, 51A: B158-B166.
18. Soares M J, Piers LS, Shetty PS, Jackson AA & Waterlow JC (1994). Whole-body
protein-turnover in chronically undernour-ished individuals. Clinical Science, 86: 441-446.
19. Kihlberg R, Bark S & Hallberg D (1982). An oral amino acid loading test before and after intestinal bypass operation for mor-bid obesity. Acta Chirurgica Scandinavica, 148: 73-86.
20. Winterer J, Bistrian BR, Bilmazes C, Black-burn GL & Young VR (1980). Whole body protein turnover, studied w ith 15N-glycine, and muscle protein breakdow n in mildly obese subjects during a protein-sparing diet and brief total fast. M etabolism, 29: 575-581.
21. Solini A, Bonora E, Bonadonna R, Castel-lino P & DeFronzo RA (1997). Protein me-tabolism in human obesity: relationship w ith glucose and lipid metabolism and w ith visceral adipose tissue. Journal of Clinical Endocrinology and M etabolism, 82: 2552-2558.
22. Dichi I, Dichi JB, Papini-Berto SJ, Angeleli AYO, Bicudo M H, Rezende TA & Burini RC (1996). Protein-energy status and N-15-glycine kinetic study of Child A cirrhotic patients fed low - to high-protein energy diets. Nutrition, 12: 519-523.
23. Vazquez JA, Kazi U & M adani N (1995). Protein metabolism during w eight reduc-tion w ith very-low -energy diets: evalua-tion of the independent effects of protein and carbohydrate on protein sparing. American Journal of Clinical Nutrition, 62: 93-103.
24. Pencharz PB, M otil KJ, Parsons HG & Duffy BJ (1980). The effect of an energy-restricted diet on the protein metabolism of obese adolescents: nitrogen-balance and w hole-body nitrogen turnover. Clini-cal Science, 59: 13-18.