DEPARTAMENTO DE BIOL
3D visualization of tissue specific vascular patterns for
endothelial cell polarity analysis
Mestrado em Biologia Molecular e Genética
Maria Margarida Ramos, PhD
2016
UNIVERSIDADE DE LISBOA FACULDADE DE CIÊNCIAS
DEPARTAMENTO DE BIOLOGIA VEGETAL
3D visualization of tissue specific vascular patterns for
endothelial cell polarity analysis
Ana Alexandra Russo
Mestrado em Biologia Molecular e Genética
Dissertação Orientada por:
Cláudio Areias Franco, PhD
Maria Margarida Ramos, PhD
3D visualization of tissue specific vascular patterns for
Acknowledgments
Antes de mais, quero agradecer ao meu orientador de mestrado Cláudio Areia Franco por me dar a oportunidade de realizar o meu estágio de mestrado no laboratório de Morfogénese Vascular no Instituto de Medicina Molecular. O Cláudio permitiu-me ganhar experiência em várias áreas, através de todas a experiências realizadas ao longo do meu estágio. Através deste estágio aprendi a trabalhar com ratinhos e células. Realizei imensas genotipagens, aprendi a perfundir ratos e a extrair órgãos, a dissecar retinas, um órgão bastante utilizado neste laboratório para o estudo da vasculatura e aprendi a trabalhar em cultura celular na tentativa de acompanhar a vasculogénese e angiogénese in vitro. Apreciei bastante o trabalho que realizei neste laboratório e gostei bastante das experiências que realizei. Agradeço ao meu orientador por me ter permitido realizar estes diversos tipos de experiências.
Seguidamente agradeço ao Pedro Barbacena com quem partilhei a bancada e me guiou durante o ano, auxiliando as minhas experiências e meu ajudou na escrita de tese e em muitos outros trabalhos de apresentação em lab meetings. Foi o Pedro quem esteve a acompanhar-me mais de perto todo o progresso das minhas experiências e me ajudou a resolver alguns problemas que foram decorrendo. Ensinou-me a trabalhar com o software de processamento de imagem Fiji e esteve ao meu lado durante as minhas primeiras aquisições de imagem no Confocal. Ensinou-me a trabalhar com a bomba de perfusão para poder realizar as experiências de microfluidics. Foi o Pedro quem realizou as perfusões em todos os ratinhos que usei nestas experiências.
Agradeço à Anna Pezzarosa a quem pedi auxílio na resolução de problemas de processamentos de imagem e me fez a medição das dimensões dos núcleos das células endoteliais e fez análise de intensidades de fluorescência. Foi a Anna quem me fez a medição de índices de refração no Instituto Superior Técnico.
Agradeço especialmente ao técnico de bioimaging António Temudo pela formação que me deu no Confocal 880 e no Lightsheet, tendo ajudado a adquirir varias imagens de retinas. Agradeço por ter passado horas a ajudar-me a processar imagens adquiridas no lightsheet, a ensinar-me a trabalhar com os softwares de processamento e visualização de imagem Arivis 4D Vision® e Imaris®. Resolveu-me iResolveu-mensos problemas que surgiram devido ao peso dos ficheiros que impediam o processaResolveu-mento. Agradeço à Aida por me ensinar a trabalhar em cultura celular, tendo sido extremamente rígida comigo, pois é muito fácil contaminar qualquer instrumento de uso comum podendo comprometer o trabalho dos outros. Acompanhou-me durante os ensaios de coating de células com fibrinogénio.
Foi a Aida quem me ensinou a trabalhar com as retinas e a colocá-las em lamelas para observação no microscópio.
Agradeço em seguida aos meus amigos de faculdade, alguns deles me seguiram para o mesmo mestrado, e amigos mais antigos com quem falo bastante ainda hoje e me acompanharam ao longo deste ano atarefado e aturaram as minhas mudanças de humor e cansaço de trabalho e mesmo assim arranjaram tempo para se encontrar comigo para discutir e desanuviar as frustrações de falta de resultados.
Agradeço muito aos meus colegas de música que me proporcionaram noites de ensaios e concertos que desnuviaram bastante, sempre cheias de palhaçada, risos e música da mais bela sem a qual eu não consigo passar.
Finalmente agradeço aos meus Pais, irmã e irmão e avós por estarem comigo e aturarem-me em todos os aspectos e por terem interesse no que faço, mesmo que não percebam nada do que estou a falar.
Muito obrigada Ana Russo
Abstract
Tissues require specialised vascular beds to perform their functions. The main mechanisms driving organ-specific vascular remodelling are poorly understood. VEGF is the main regulator of sprouting angiogenesis, inducing the expansion of the primitive plexus into a highly branched network. Shear-stress, on the other hand, is the remodelling inducer, that is very important for patterning. VEGF-driven angiogenesis generates a highly branched network where some vessels are not well perfused. During the remodelling and maturation of the angiogenic network, vessel regression eliminates superfluous vessels. Thus, through vascular remodelling the network becomes hierarchically organized and functional. It is known that different tissues have different VEGF distribution patterns and different haemodynamic specificities. Given that both VEGF and shear stress are endothelial cell polarity inducers, we propose that these two factors compete for establishing the endothelial cell polarity axis and that this competition may influence organ-specific patterning. To be able to tackle this question, we decided to develop methods to visualize vascular patterns of whole-organs, stained not just for vessels, but for endothelial cell nucleus and Golgi apparatus as well, in order to assess the endothelial cell polarity and correlate it with VEGF levels in those tissues. In order to visualize deep into tissue we had to optically clear the different tissues (make them transparent). Most of the clearing protocols damage immunofluorescence stainings, so we focused on achieving a clearing protocol that would clear the tissue well while maintaining staining integrity, enabling us to make 3D image acquisition for polarity analysis. For large 3D imaging, the lightsheet microscope was used, for it is a system designed to allow imaging of whole cleared organs. Polarity analysis and correlation with flow and VEGF was not possible, since 3D networks were harder to analyse, but a successful clearing protocol for the specific polarity staining was achieved.
Keywords: Tissue clearing, Tissue patterning, Axial Polarity,
Resumo
A formação de uma rede vascular funcional e padronizada é crucial para o desenvolvimento e crescimento de todos os vertebrados. Qualquer disfunção na formação da rede vascular leva à patogénese de várias doenças como tumores, malformações arteriovenosas, aneurismas, entre outros.
Após a vasculogénese (formação de vasos a partir de precursores endoteliais), a angiogénese expande e remodela a vasculatura. Esta remodelação é um balanço entre sprouting e regressão de vasos que determina uma rede vascular hierárquica e funcional. Estudos recentes apontam para um
papel importante da motilidade e polaridade das células endoteliais no processo de morfogénese vascular. A polaridade celular consiste na distribuição assimétrica de proteínas e organelos dentro da célula, que permite definir estruturas e funções específicas em diferentes regiões da mesma célula. A distribuição assimétrica é estabelecida por complexos de proteínas que definem o eixo de polarização a jusante de factores extracelulares. As células podem estar polarizadas em vários eixos, como o eixo apico-basal ou anterior-posterior/axial. Franco et al. definiram o posicionamento do Golgi em relação ao núcleo como eixo de polaridade axial nas células endoteliais.
O VEGF e o fluxo sanguíneo são dois reguladores importantes da polaridade axial das células endoteliais. O fluxo sanguíneo é importante para a padronização/remodelação da rede de vasculatura. Esta remodelação é o que leva à aquisição de padrões vasculares específicos em cada tecido. Este padrão/arquitetura de vasos é importante e bastante distinto entre órgãos, pois correlaciona-se com a função do tecido e a importância da circulação para essa função. As células endoteliais têm capacidade de sentir a fricção causada pelo fluxo sanguíneo, chamada de tensão de cisalhamento, traduzindo força em sinais bioquímicos mediante várias moléculas, incluindo PECAM1, VE-caderina, VEGFR2, PIEZO1 e cílios primários. O fluxo induz a polarização das células na direção contrária à do fluxo. Já o VEGF, um factor pró-angiogénico, induz também polarização das células endoteliais em direção a gradientes crescentes de VEGF. Notavelmente, durante o processo de angiogénese, a polarização induzida por estes dois factores é tendencialmente oposta. Com base nestas observações, formulámos a hipótese de que o VEGF e o fluxo sanguíneo estão em competição para estabelecer o eixo de polaridade das células endoteliais. Esta competição terá assim um impacto na orientação das células endoteliais, e consequentemente na morfogénese vascular e padronização. Esta questão tem ainda especial interesse pois sabe-se também que diferentes órgãos possuem níveis variados de VEGF, o que também é correlacionado com padrões vasculares próprios. Assim, o nível da competição entre o VEGF e o fluxo sanguíneo poderá ter um papel importante na definição dos padrões vasculares específicos a cada órgão.
Sabe-se que o complexo PAR (PAR-6/PAR-3/aPKC) define o eixo de polaridade de vários tipos celulares. Resultados preliminares mostram que este complexo regula a capacidade das células polarizarem em reação ao VEGF e ao fluxo sanguíneo. Desconhece-se, no entanto, as vias de sinalização que estabelecem a competição entre estes dois factores de polarização.
No estudo realizado pretendemos responder a duas questões: como decorre a remodelação de vasos em cada órgão que leva a uma arquitetura vascular específica? Terá o VEGF influência na polarização das células endoteliais contra o fluxo e essa influência alterna o padrão da vasculatura?
Para tentar responder a estas questões, técnicas de imagiologia foram usadas para determinar a polaridade das células endoteliais e morfologia da vasculatura em cada órgão, usando
técnicas de visualização 3D e métodos que permitem aumentar a transparência dos tecidos. A transparentização consiste em diminuir a dispersão de luz que ocorre nos tecidos, o que os torna opacos, de modo a igualar os índices de refração do meio com o índice de refração médio do tecido. As técnicas dividem-se em dois grandes grupos: técnicas que utilizam solventes orgânicos e técnicas aquosas. Dentro destes grupos, os métodos para obter tecidos transparentes consistem em imersão simples dos tecidos para igualar os índices de refração ou remoção de lípidos. Neste âmbito várias técnicas de transparentização foram testadas e otimizadas na tentativa de compatibilizar a marcação com fluorescência das estruturas com a técnica aplicada.
Os primeiros testes revelaram sensibilidade da marcação dos vasos com anticorpos que marcavam receptores de membrana. Estas técnicas removiam lípidos pelo que se justificava a ausência de marcação, sendo que algumas destas foram excluídas. A técnica que melhor conciliou a capacidade de transparentização e com a compatibilidade com a marcação com anticorpos (isto após algumas modificações ao protocolo original) foi a técnica designada Protocolo 2 que foi uma adaptação do protocolo CUBIC. Após a otimização das técnicas e da marcação com anticorpos específicos que se estavam a utilizar, procedeu-se à adição do anticorpo para marcar o complexo de Golgi ao cocktail de anticorpos. A dificuldade na marcação do complexo de Golgi e do núcleo residiu na reação cruzada que havia nos anticorpos secundários, uma vez que os primários foram criados na mesma espécie. A visualização das três entidades era compatível com o protocolo de transparentização que se estava a utilizar, mas as imagens obtidas podem ser muito confusas devido à presença de sinal de golgi em dois canais. No entanto o tamanho dos dois organelos é distinto, permitindo a diferenciação entre os dois.
Durante a otimização do protocolo, foram feitos testes ao sistema de microscópio de lightsheet que seria o microscópio especializado para obter grandes imagens tridimensionais sem ter de haver seccionamento físico das amostras. Este microscópio contém uma câmara onde fica suspensa a amostra mergulhada num líquido de índice de refração compatível com o índice médio da amostra após ser transparentizada. Testes iniciais usando retinas de ratinho revelaram a dificuldade em trabalhar com ficheiros obtidos neste sistema, uma vez que uma aquisição de uma retina inteira daria origem a um ficheiro de 1Tb, praticamente impossível de processar nas estações de trabalho presentes no instituto. Após alguns testes, passou-se para aquisição de órgãos. Notoriamente a aquisição da vasculatura do cérebro teve sucesso. O cérebro é facilmente transparentizado e a vasculatura é bastante fácil de adquirir em lightsheet. Para fazer reconstrução 3D da vasculatura usando lightsheet, o cérebro é um bom candidato. Já o rim, não transparentiza tão facilmente como o cérebro e a vasculatura é altamente densa, sendo que o lightsheet não é capaz de resolver a estrutura típica do rim que é o glomérulo. Possivelmente o rim terá de ser
adquirido em confocal, mas este microscópio tem uma distância de trabalho limitada não permitindo adquirir grandes estruturas em 3D. O intestino tem a estrutura especializada da vilosidade que é facilmente adquirida em confocal.
Com a imunofluorescência do complexo de Golgi e do núcleo obtida, traçam-se os vetores de polaridade das células utilizando um script do MatLab escrito especificamente para desenhar vetores de polaridade. Porém o script funciona bem assumindo que a rede vascular é bidimensional, como nas retinas, o que não acontece em órgãos uma vez estes apresentam uma rede vascular tridimensional complexa. Do mesmo modo, simular o fluxo também se torna complicado para estas estruturas. Como tal não se pôde correlacionar a polaridade com o fluxo sanguíneo, nem correlacionar com VEGF.
A adaptação de um protocolo de transparentização compatível com as marcações para os vasos, núcleos e complexo de Golgi foi um passo essencial para se poder visualizar órgãos e traçar vetores de polaridade, para futuramente se poder tirar resultados mais conclusivos em relação à orientação das células em relação ao fluxo e a influência do VEGF para a mesma polarização e potencialmente para a padronização dos vasos específica de cada órgão.
Abbreviations
A4P0 - Acrylamide 4%, PFA 0%
ADPKD - Autossomic Dominant Polycistic kidney disease
AKT – or PKB is Protein Kinase B ANG - Angiopoetin
aPKC - atypical Protein Kinase C ARP2/3 – actin-related proteins 2 and 3 CBB – Cláudio’s Blocking Buffer
Cdc42 – Cell Division Cycle 42
CUBIC – Clear, Unobstructed Brain Imaging Cocktails and Computational analysis
DBE - Dibenzyl Ether DCM - Dichloromethane DLG - Discs large DLL4 - delta-like 4
DMSO - Dimethyl sulfoxide Dvl - Dishevelled
EC – Endothelial Cell ECM - Extracellular Matrix
ERG – (erythroblast transformation-specific)-related gene
ERK5 - Extracellular-signal-Regulated Kinase 5 FRUIT - Fructose and urea induced transparency
GEF - Guanine Exchange Factors
GTPase – Guanosine TriPhosphate hydrolase GOLPH4 – Golgi Phosphoprotein 4
iDISCO - immunolabeling-enabled three-Dimensional Imaging of Solvent-Cleared Organs
Hh - Hedgehog
ICAM - Intercellular Adhesion Molecule KLF2 – Krüppel-LikeFactor 2
LGL - Lethal giant larvae
MAPK – Mitogen-Activated Protein Kinase MIP – Maximum Intensity Projection MTOC - Microtubule-Organizing Center Ncx1 - sodium/calcium exchangers
NF-kB - Nuclear Factor kappa-light-chain-enhancer of activated B cells
NICD - Notch intracellular domain NO – Nitric Oxide
NP40 - Nonyl Phenoxypolyethoxylethanol NRP1 - Neuropilin 1
PACT - Passive clarity technique
PALS1- (protein associated with LIN-7)-1 PAR - Partitioning-Defective
PATJ - PALS1- associated tight-junction protein
PC - Polycystin
PCP – Planar Cell Polarity
PDGF – Platelet-Derived Growth Factor PDMS - Poly(Dimethylsiloxane)
PECAM1- Platelet endothelial cell adhesion molecule 1
PEG - Polyethilene Glycol
PI3K - Phospho-inositide 3-Kinase PIGF – Placental Growth Factor
Rac1 – Ras-related C3 botulinum toxin substrate 1
RBP-Jκ - recombination signal-binding protein 1 for Jκ
RhoA - Ras homolog gene family, member A RIMS – Refractive Index Matching Solution ROBO - Roundabout gene family
SC - Stalk Cell
SRF – Serum Response Factor
Src - Proto-oncogene tyrosine-protein kinase TC - Tip cell
TDE - 2,2′-thiodiethanol THF – Tetrahydrofuran
TIE - Tyrosine kinase with immunoglobulin-like and EGF-like domains
WASP - Wiskott–Aldrich syndrome protein WAVE - WASP family verprolin-homologous protein
Wnt - Wingless
VCAM - Vascular Cell adhesion Molecule VE-cadherin - Vascular Endothelial cadherin VEGF-A - Vascular Endothelial Growth Factor A
vSMCs - Vascular Smooth-Muscle Cells VMC – Vascular Mural Cells
Index
Acknowledgments ... i
Abstract ... iii
Resumo ... iii
Abbreviations ... vii
Index ... ix
Index of Figures ... xi
Index of Tables... xi
Chapter I - Introduction ... 1
I.1. Blood vessel formation ... 1
I.1.1. Sprouting Angiogenesis ... 1
I.1.1.1. VEGF induced Polarization ... 3
I.1.2. Vascular Remodelling ... 3
I.1.2.1. Shear-stress induced polarization ... 5
I.2. Cell Polarity ... 6
I.3. Aims ... 8
I.3.1. Tissue Clearing ... 9
Chapter II – Materials and Methods ... 10
II.1. Mice manipulation and Perfusion... 10
II.1.1. Simple perfusion protocol ... 10
II.1.2. CUBIC - CB-perfusion... 10
II.1.3. Modified CUBIC ... 10
II.2. Immunostaining Protocol ... 11
II.2.1. Organs... 11
II.2.2. Retinas ... 11
II.2.3. GOLGI immunostaining in organs ... 11
II.3.1. ClearT2 Protocol ... 12
II.3.2. iDISCO Protocol ... 12
II.3.3. PACT Protocol ... 12
II.3.4. Protocol 1 ... 12
II.3.5. Protocol2 – Second Modified CB-perfusion ... 12
II.4. Imaging ... 13
II.5. Processing ... 13
II.6. Polarity vectors drawing ... 13
Chapter III: Results ... 14
III. Clearing Techniques ... 14
III.1. Blood Vessel Visualization ... 16
III.1.1. Testing Clearing Techniques ... 16
III.1.2. Optimization ... 17
III.1.2.1. Other protocols ... 18
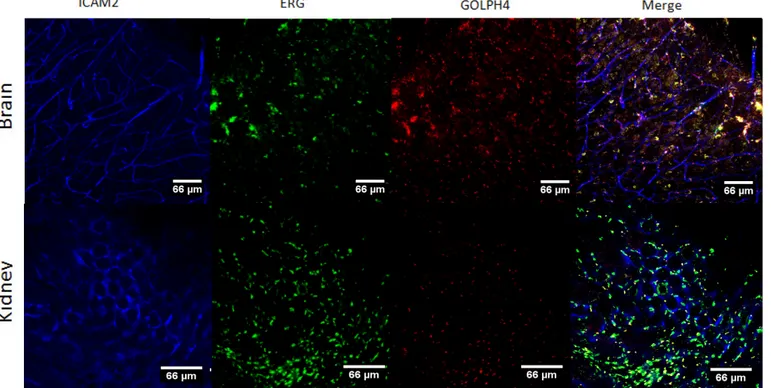
III.1.3. Golgi staining with GOLPH4 ... 20
III.2. Imaging with Light-sheet ... 21
III.2.1. Retinas imaging ... 22
III.2.2. Organ Imaging ... 22
III.3. Polarity assessment in Organs’ vasculature ... 24
Chapter IV - Discussion ... 25
IV.1. Deep Tissue Imaging ... 25
IV.1.1. Tissue Clearing ... 26
IV.1.2. Microscopy... 26
IV.2. Image analysis ... 27
IV.3. Future Perspectives ... 28
Chapter IV - Bibliography ... 30
Supplementary Information ... I
Index of Figures
Figure 1 - Schematic representation of sprouting angiogenesis. ... 2
Figure 2 - Vascular Remodelling Events. ... 4
Figure 3 - Cell Polarity. ... 7
Figure 4 - Schematic representation of vascular network development. ... 8
Figure 5 - Test of different clearing techniques. ... 16
Figure 6 - Clearing Techniques optimization. ... 18
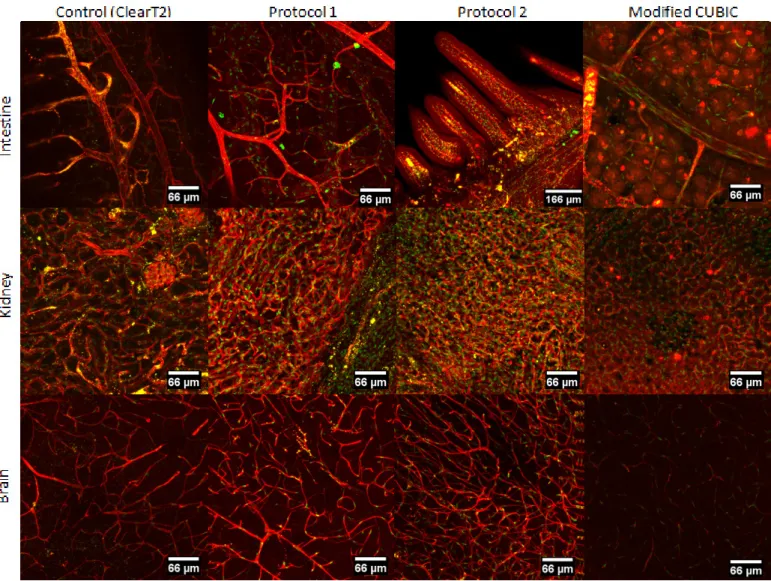
Figure 7 - Test of other clearing protocols for intestine, kidney and brain.. ... 19
Figure 8 - Protocol 2 applied to triple immunostaining of the brain and kidney. I ... 20
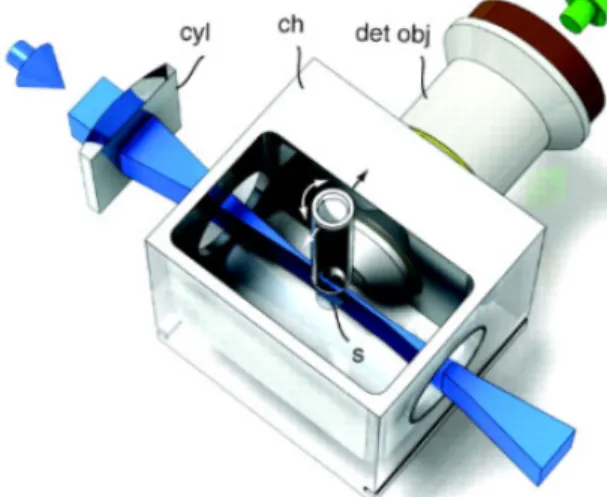
Figure 9 - Light-sheet microscopy. ... 21
Figure 10 - Test of light-sheet acquired retina. ... 22
Figure 11 - Confocal and Lightsheet Brain acquisition. ... 23
Figure 12 - Polarity vector drawing in kidney. ... 24
Supplementary Figure 1 - Urea test in Pre-treatment. ... II Supplementary Figure 2 - Cleared organs.. ... III Supplementary Figure 3 - Testing the Lightsheet microscope.. ... IV Supplementary Figure 4 - Light-sheet tests with Brain.. ... V
Index of Tables
Table 1 - Description of the Clearing Techniques ... 15Supplementary Table 1 - All clearing protocols tested ... I Supplementary Table 2- Reagents Formulation. ... VI Supplementary Table 3 - Z-step/Tissue Thickness (µm) ... VI Supplementary Table 4 - System components. ... VI Supplementary Table 5 - Refractive Indexes measured... VI
Chapter I - Introduction
The vertebrate vasculature forms an extensive branched network of blood vessels that supplies tissues and organs with nutrients and oxygen. This network, also known as vascular plexus, needs to be functional and patterned for correct embryonic development, tissue growth and organ physiology. Any dysfunction or mis-patterning of this network triggers angiogenic pathologies such as tumors, malformations and aneurisms. 1–3
I.1. Blood vessel formation
During embryonic development, endothelial cell (EC) precursors, called angioblasts, migrate and assemble into a primitive vascular network through a process known as vasculogenesis or de novo vessel formation. These precursors undergo cell differentiation and specification into a venous or arterial fate in a genetically programmed and haemodynamic dependent way. Following vasculogenesis, the primitive vascular network is expanded through sprouting angiogenesis, creating a highly branched network. This network is then remodeled, a process driven by blood flow, and that gives rise to a more functional and hierarchically organized vascular system. Recruitment of mural cells (VMC) and vascular smooth-muscle cells (vSMCs) stabilizes the vessels and promotes their maturation1,2. In adulthood, ECs remain in a quiescent state and normally angiogenesis does not occur except in few situations such as wounding, organ regeneration, menstrual cycle, or in some pathological events4. This is tightly controlled by a proangiogenic/antiangiogenic balance. Thus, angiogenesis is a dynamic remodelling process of expansion and regression, until the final patterned network is achieved.
I.1.1. Sprouting Angiogenesis
Sprouting angiogenesis can be described as a collective cell migration event. In this type of migration, cells are structurally and functionally connected (through cell junctions) and the migrating cohort remains attached to the parent vessel. Additionally, polarity and ‘supracellular’ organization are both necessary to achieve coordinated and directed movement5.
Sprouting angiogenesis is mainly triggered by Vascular Endothelial Growth Factor VEGF. Among the types of VEGF (from A to E and PIGF)4, the most important for vascular development is VEGFA. Knocking out just one copy of this factor is lethal for the embryo6,7. VEGFA gives rise to several isoforms via alternative splicing. The differential distribution of VEGFA isoforms, in particular the heparin-binding isoforms 164 and 188, generate a gradient that triggers directional vessel growth8. During the migratory process, and when higher levels of exogenous VEGFA are detected, a particular type of EC is specified to lead the new sprout. These are called endothelial tip cells (TC) and they have a unique morphology and genetic signature, expressing high levels of PDGF-B, VEGFR2 and VEGFR3, NRP1, DLL4, amongst other genes9 (Figure 1). The delta-like (DLL)4–Notch
signaling laterally inhibits TC fate in adjacent ECs. TCs have an invasive behavior that is promoted by the loosening of adherent junctions such as VE
metalloproteinase-mediated degradation of extracellular ma
protrusions, called filopodia and lamellipodia, which are responsible to sense both attracting and repulsive signals and to guide the TC. VEGF triggers this behavior through activation of the transmembranar receptor kinase VEGFR2, which
phosphoinositide 3-kinases (PI3Ks),
VEGFR2 signalling contribute to EC proliferation, filopodial extension The TCs are followed by
parent vessel and establish vessel lumen
definitive, ECs can switch between these states, so that the fittest cell initiates the sprouting phenotype selection is mainly triggered by the DLL4
Notch and VEGF are opposing signals, the first is an inhibitor of sprouting, whereas the second induces sprouting. VEGF induces TC state but also acts as an upstream regulator of DLL4 expression (a Notch ligand), so cells that have higher VE
activates Notch in neighbouring cells. The Notch signalling in turn negatively regulates VEGFR in juxtaposed EC, leading to a decrease in the sensitivity of EC to VEGF, thereby inhibiting TC phenotype in cells adjacent to TCs
adjacent cells (Notch1) there is a conformational change that leads to cleavage of the Notch
Figure
representation of sprouting angiogenesis.
state, cells sense pro factors, such as VEGF and Angiopoetin
sprouting. EC compete for TC (tip cell) fate and once the TC is selected it will begin to lead the sprout. VEGF
guiding the TC filopodia extensions. The SC (stalk cell) w
and maintain the connection to the parent vessel. Once the TC encounters another TC from another sprout they will merge in a process called anastomosis. The stalk cells are responsible for lumen formation. The fusion of the two sprouts gi
and unobstructed vessel
TC fate in adjacent ECs. TCs have an invasive behavior that is promoted by the loosening of adherent junctions such as VE-cadherin (Vascular Endothelial cadherin), by mediated degradation of extracellular matrix (ECM) and through cytoplasmatic protrusions, called filopodia and lamellipodia, which are responsible to sense both attracting and repulsive signals and to guide the TC. VEGF triggers this behavior through activation of the ase VEGFR2, which activates several pathways such as MAPKs, kinases (PI3Ks), SRF (serum response factor), AKT and GTPases
contribute to EC proliferation, filopodial extension and chemotaxis.
are followed by endothelial stalk cells (SC), which maintain the connection to the parent vessel and establish vessel lumen1,10 (Figure1). The tip and stalk phenotype
switch between these states, so that the fittest cell initiates the sprouting phenotype selection is mainly triggered by the DLL4-Notch lateral inhibition (as mentio
Notch and VEGF are opposing signals, the first is an inhibitor of sprouting, whereas the second induces sprouting. VEGF induces TC state but also acts as an upstream regulator of DLL4 expression (a Notch ligand), so cells that have higher VEGF signalling have decreased Notch signalling, but activates Notch in neighbouring cells. The Notch signalling in turn negatively regulates VEGFR in juxtaposed EC, leading to a decrease in the sensitivity of EC to VEGF, thereby inhibiting TC ells adjacent to TCs1. When Dll4-Notch receptor interacts with its ligand on the adjacent cells (Notch1) there is a conformational change that leads to cleavage of the Notch
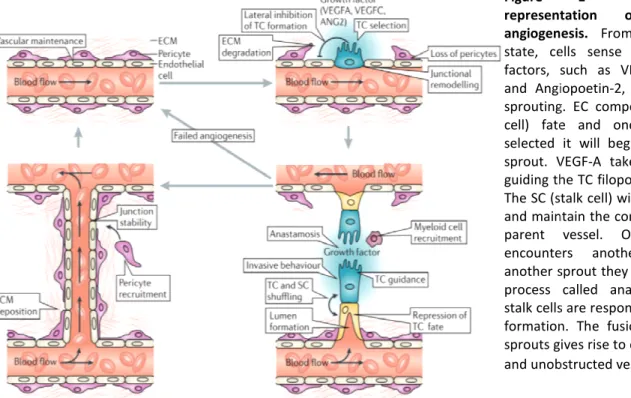
Figure 1 - Schematic representation of sprouting angiogenesis. From a quiescent
state, cells sense pro-angiogenic factors, such as VEGF-A, VEGF-C and Angiopoetin-2, which induces sprouting. EC compete for TC (tip cell) fate and once the TC is selected it will begin to lead the sprout. VEGF-A takes the role of guiding the TC filopodia extensions. The SC (stalk cell) will follow the TC and maintain the connection to the parent vessel. Once the TC encounters another TC from another sprout they will merge in a process called anastomosis. The stalk cells are responsible for lumen formation. The fusion of the two sprouts gives rise to one continuous and unobstructed vessel1.
TC fate in adjacent ECs. TCs have an invasive behavior that is promoted by ndothelial cadherin), by trix (ECM) and through cytoplasmatic protrusions, called filopodia and lamellipodia, which are responsible to sense both attracting and repulsive signals and to guide the TC. VEGF triggers this behavior through activation of the activates several pathways such as MAPKs, AKT and GTPases. Collectively, and chemotaxis.
, which maintain the connection to the phenotypes are not switch between these states, so that the fittest cell initiates the sprouting11. The Notch lateral inhibition (as mentioned earlier). Notch and VEGF are opposing signals, the first is an inhibitor of sprouting, whereas the second induces sprouting. VEGF induces TC state but also acts as an upstream regulator of DLL4 expression signalling have decreased Notch signalling, but activates Notch in neighbouring cells. The Notch signalling in turn negatively regulates VEGFR in juxtaposed EC, leading to a decrease in the sensitivity of EC to VEGF, thereby inhibiting TC Notch receptor interacts with its ligand on the adjacent cells (Notch1) there is a conformational change that leads to cleavage of the Notch
intracellular domain (NICD). NICD translocates to the nucleus associating to RBP-Jκ (recombination signal-binding protein 1 for Jκ), thereby activating the transcription. Notch downregulates VEGFR2 and VEGFR3, but positively regulates VEGFR1 (Flt1). The soluble form of this receptor (sFlt1) serves as a decoy receptor that binds to VEGFA, clearing the free ligand from the environment and preventing it from binding to VEGFR2, therefore functioning as a negative regulator12,13. The communication between the two major pathways in sprouting angiogenesis, Notch and VEGF, is important for vascular patterns.
After the selection process, the sprout is guided by a VEGF gradient. When two vascular branches meet, they merge through anastomosis and during this process the TC lose their motility, form EC-EC junctions and are incorporated in the newly branched vessel, generating a continuous unobstructed lumen1.
I.1.1.1. VEGF induced Polarization
VEGFA binding to VEGFR2 triggers the TC phenotype but also promotes cytoskeleton rearrangements, in order to establish front-to-rear polarization, and by extending the filopodia and lamellipodia. Cdc42 activation via VEGFR2 drives filopodia formation and regulates polarization, while Rac1, also activated by VEGFR2, controls lamellipodia. The front-to-rear polarization is essential for the tip cell to guide the emerging sprout. VEGF binding to its receptors in combination with Slit2/ROBO1 signalling regulates EC polarization, through the adapter protein NCK. Absence of ROBO1 impairs cell polarity, as measured by the random positioning of the Golgi, and abolish cdc42 response to VEGFA and Slit2, because ROBOs are essential for VEGF-mediated Rac1 activation14.
I.1.2. Vascular Remodelling
Angiogenesis is not just sprouting. The tissue specific vascular formation undergoes two phases: first the formation of the primary capillary plexus through extensive branching, the second, vascular growth and remodelling (Figure 2A). Remodelling is an important event in vascular network formation. Remodelling takes place when vessels start being perfused with blood, and this perfusion will induce activation of signalling pathways, modifying gene expression in EC, such as Ncx1, N-cadherin and myosin light chain 2a15. Three cellular processes are important for remodelling: cell proliferation, cell migration and ECM production/degradation15. During this event, changes in lumen diameter and vessel wall thickness will suit local tissue needs16, as well as regression of less perfused vessels, as a response to reduced blood flow. Also artery-vein specialization takes place and this specialization contributes for vessel diameter increase and flow normalization17. Another event that is considered remodelling is microcirculation rarefaction (loss of capillary area) that occurs in hypertension. This might be responsible for an avascular zone in the peri-arterial space. This lack of
capillarity increases with the vessel caliber. This is more freq indicating sufficient oxygenation in the peri
The heterogeneity of EC
to the environment, allowing the construction of different va
tissue, depending on their function and the importance of the blood flow for their performance. It is known that the VEGF expression is triggered by hypoxia, but different tissues respond differently to hypoxia. The response during hypoxia, later determines the level of oxygenation of the specific tissue after angiogenesis, since VEGF not only is important for sprout guidance, but for establishment of fenestrations in quiescent state
each organ, for instance in liver, in normoxic conditions, VEGF is equally distributed and this constitutive expression is responsible for high permeability of EC. Kidney seems to have higher VEGF expression in the glomeruli, and low level in periglomeruli cells. In brain, however, there seems to be low levels of VEGF, and this is consistent with the brain endothelium forming t
(BBB). Exchanges in this case happen not through fenestrations, but through specialized transporters in the EC membrane. This restricted patterned of VEGF distribution somehow, influences patterning in tissue-specific vascular beds18
Intussusception is a less understood remodeling
growth, arborization and branching remodeling. Intussusceptive microvascular growth is a faster alternative to sprouting in which,
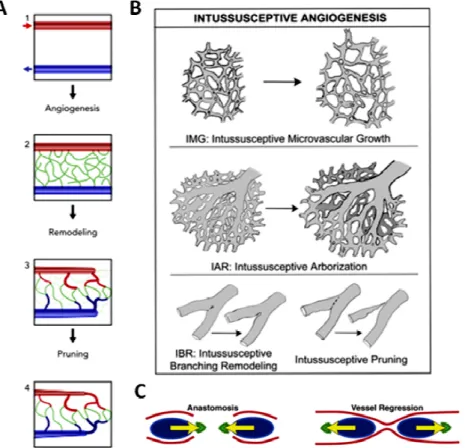
Figure 2 - Vascular Remodelling Events.
Development of vascular network. After vasculogenesis,
expands the network. Remodelling and pruning will drive the formation of an organized and hierarchical network The three intussusceptive processes of microvascular growth, arborization and branching and remodelling. These vessels will regressl19. C) Vessel regression through reversed anastomosis. Shear stress induces polarization of EC leading to a migration event of EC towards higher shear stress. In green is the Golgi apparatus and in blue the nucleus. The arrow represents the axial polarity measured by the positioning of the Golgi apparatus to the nucleus
capillarity increases with the vessel caliber. This is more frequent in arteries than in veins, possibly indicating sufficient oxygenation in the peri-arterial zone.
The heterogeneity of EC gene expression profile and signalling permits different responses to the environment, allowing the construction of different vascular beds that are specific for each tissue, depending on their function and the importance of the blood flow for their performance. It is known that the VEGF expression is triggered by hypoxia, but different tissues respond differently to esponse during hypoxia, later determines the level of oxygenation of the specific tissue after angiogenesis, since VEGF not only is important for sprout guidance, but for establishment of fenestrations in quiescent state18. Therefore, the levels of VEGF are different in each organ, for instance in liver, in normoxic conditions, VEGF is equally distributed and this esponsible for high permeability of EC. Kidney seems to have higher VEGF expression in the glomeruli, and low level in periglomeruli cells. In brain, however, there seems to be low levels of VEGF, and this is consistent with the brain endothelium forming the blood brain barrier (BBB). Exchanges in this case happen not through fenestrations, but through specialized transporters EC membrane. This restricted patterned of VEGF distribution somehow, influences patterning
18.
Intussusception is a less understood remodeling process that can lead to microvascular growth, arborization and branching remodeling. Intussusceptive microvascular growth is a faster alternative to sprouting in which, instead of degradation of the basement membrane, migration and
Vascular Remodelling Events.A) Development of vascular network. After vasculogenesis, sprouting angiogenesis expands the network. Remodelling and pruning will drive the formation of an organized and hierarchical network66. B) The three intussusceptive processes of microvascular growth, arborization and branching and remodelling. These vessels . C) Vessel regression through reversed anastomosis. Shear stress induces of EC leading to a migration event of EC towards higher shear stress. In green is the Golgi apparatus and in blue the nucleus. The arrow represents the axial polarity measured by the positioning of the Golgi apparatus to the nucleus21.
uent in arteries than in veins, possibly
expression profile and signalling permits different responses scular beds that are specific for each tissue, depending on their function and the importance of the blood flow for their performance. It is known that the VEGF expression is triggered by hypoxia, but different tissues respond differently to esponse during hypoxia, later determines the level of oxygenation of the specific tissue after angiogenesis, since VEGF not only is important for sprout guidance, but for Therefore, the levels of VEGF are different in each organ, for instance in liver, in normoxic conditions, VEGF is equally distributed and this esponsible for high permeability of EC. Kidney seems to have higher VEGF expression in the glomeruli, and low level in periglomeruli cells. In brain, however, there seems to be he blood brain barrier (BBB). Exchanges in this case happen not through fenestrations, but through specialized transporters EC membrane. This restricted patterned of VEGF distribution somehow, influences patterning
can lead to microvascular growth, arborization and branching remodeling. Intussusceptive microvascular growth is a faster instead of degradation of the basement membrane, migration and
proliferation, the vessels simply split through the formation of “vertical pillars” inside the vessels that dilate and eventually lead to the splitting (Figure 2B)19. The regulatory mechanisms underlying the formation of these pillars remain unknown. Branching remodelling essentially works in order to achieve the ideal of the Murray law, which states that the cost of transporting blood can be minimized by enlarging the vessel’s diameter20, by optimizing the blood flow distribution. Branching remodelling geometrically rearranges the network using the formation of “pillars” in the proximity of branching points.
In an extensive vessel network, blood fluid will not reach all vessels equally; therefore, some vessels will be less perfused. The highly sprouted network is formed because EC use anaerobic metabolism rather than the oxidative one and when glucose levels do not meet the cell requirements, due to the low energetic income from glycolysis, they switch to oxidative metabolism. For the glycolytic pathway to pair up with oxidative metabolism, ECs go from quiescent to proliferating and migrating state11. Regression (or vessel pruning) is a process that modifies the vascular network by removing less perfused blood vessels. Initially, it was proposed that the main driver for this regression event was EC apoptosis, however recent studies reveal that instead of undergoing apoptosis, ECs migrate and incorporate into more active vessels, enlarging them21,22 (Figure 2A and 2C). Apoptosis drives vessel regression in pupillary membrane, however it is not the main driver of regression. This recent hypothesis states that the regressing vessel goes through a, somehow similar to, reversed anastomosis process. The described process for regression follows four steps: selection, lumen stenosis, EC retraction and resolution of the regressing vessel21. Apoptosis can be observed if the migratory EC fail to integrate the active vessel.
I.1.2.1. Shear-stress induced polarization
The key regulator of the remodelling event is blood flow23, and ECs have the capacity to sense variations in this flow by sensing variations in shear stress, using surface proteins24. Shear stress is the frictional force per unit area and it is parallel to blood flow, proportional to the viscosity and blood velocity and it is the main driver of embryonic morphogenesis of heart and blood vessels24. When shear stress is strong enough it will induce polarization of EC against blood flow. The EC of low perfused vessels will be able to sense this higher blood flow through the neighbouring cells, resulting in polarization towards the same way, towards higher shear stress. In zebrafish, the axial polarity (measured through the positioning of the Golgi apparatus) correlates with directional cell migration (Figure 2C). The EC polarization results in a net movement of cells from a low-flow branch (which regresses) to high-flow branch (which enlarges)21.
The development of the aortic arch vessels occurs due to the action of blood flow that influences VEGF signalling, by inducing the expression of Krüppel-like factor 2 (KLF-2) and promotes
expression of microRNA 126 which increases VEGF signaling1. KLF-2 drives formation of stress fibers that align the cells in direction or the blood flow25. Blood flow is known to activate several pathways like phospho-inositide 3-kinase (PI3K), extracellular signal-regulated kinase 5 (ERK5/MAPK7) and NO pathways that promote EC survival. PECAM-1, VE-cadherin and VEGFR2, together comprise a mechanosensory complex23,24. PECAM-1 directly senses shear stress and activates Src, VE-cadherin functions as an adaptor that brings VEGFR2 closer to PECAM-1 in order to be transactivated by Src. Activated VEGFR2 recruits PI3K that will activate several downstream signalling pathways, specifically the conformational activation of integrins pathway that leads to binding of ECs to the extracellular matrix (ECM). This binding will align the cells in the fluid direction via Rac, Rho and Cdc42. Rac1 activation also stimulates NF-kB activity that will trigger the expression of adhesion molecules like intercellular adhesion molecule (ICAM)-1, vascular cell adhesion molecule (V CAM)-1, endothelial (E)-selectin and platelet-derived growth factor (PDGF). Both NF-kB activation and ICAM1 expression are dependent on the integrin activation pathway23,24. Other known mechanosensors are the calcium channel called Piezo126 and the primary cilia which are specialized structures in the surface of the cell that can bend, upon flow, and trigger Ca2+ influx, through polycystins 1 and 2 at the membrane of the cilia27.
I.2. Cell Polarity
Polarity is defined as an asymmetric distribution of surface proteins, channels, receptors, lipids and various cell contents. The asymmetry leads to a differential structure and function, allowing cellular processes to be regulated differentially across the cell. This inequality is achieved through, the so called polarity proteins, which define various types of cellular axis like apical-basal or anterior-posterior/axial28,29,30 (Figure 3A). These domains are important to provide barriers between compartments, to maintain ion homeostasis, regulate cell migration and allow dispersion of cell content to daughter cells upon division31. The polarity proteins can translate signals, from internal or external sources, that result in cytoskeleton and vesicle transport changes.
The polarity existence is imperative for tissue morphogenesis and elongation32. Among the variety of polarity proteins, a well known family of proteins known as PAR (partitioning-defective), has important roles for the establishment of cell polarity, since it can regulate the actin and microtubule cytosqueleton33
. Par proteins can associate and form complexes. The Par/aPKC complex
is a conserved complex28 that consists in an association between Par-3, Par-6 and aPKC protein (atypical protein kinase C). This complex on the other hand can interact with Par-1/Par-2 complex and amplify small initial polarity cues. The polarity establishment is achieved through distribution of Par-1/Par-2 complex to the basal domain and Par/aPKC complex to the apical domain and this asymmetric distribution occurs due to a cytoplasmatic flow generated from an asymmetric
actomyosin contraction28 (Figure 3B). In mammalian cells, aPKC/Par6 plays a role in rearranging the microtubules, reorienting the microtubule organizing center (MTOC)28,34 which allows orientation of symmetric and asymmetric cell division, and is very important for tissue architecture and morphogenesis32.
This complex contributes for the formation of intercellular junction, driving epithelial polarization. These localized complexes recruit proteins of the Rho family that are GTPases, such as RhoA, Cdc42 and Rac1 that are at the center of the mechanism - inducing polarization When establishing cell polarity,
cytoskeleton rearrangements are determined by local assembly of signaling complexes of Rho GTPases family (Cdc42, Rho and Rac). Cdc42 and Rac1 are responsible for establishing front
and apico-basal polarity. Defects in these polarities will lead to defective anastomosis and remodeling. Cdc42 activates WASP
that induces local assembly of actin filaments, via Arp2/3. The Par complexes interact wit
transmembrane protein Crumbs and scaffold protein PATJ (PALS1- associated tight-junction protein)
determines the apical membrane and induces the formation of tight junctions. Scribble complex proteins comprise Scribble, Discs large (DLG) and Lethal giant larvae (LGL)
the basolateral membrane and also align the mitotic spindle along the apico Crumb and Par complexes interact by mutual exclusion to establish polarity
Another type of polarity proteins essential for tissue morphogenesis belongs to the planar cell polarity (PCP) pathway. PCP is important in multicellular tissues coordinating cell behavior across
(Figure In mammalian cells, role in rearranging the microtubules,
microtubule-28,34
tation of symmetric and asymmetric cell division, and is very important for tissue architecture and
mplex contributes for the formation of intercellular junction, driving epithelial polarization. These localized complexes recruit proteins of the Rho family that are RhoA, Cdc42 and the polarization. When establishing cell polarity,
cytoskeleton rearrangements are determined by local assembly of signaling complexes of Rho GTPases family (Cdc42, Rho and Rac). Cdc42 and Rac1 are responsible for establishing front
larity. Defects in these polarities will lead to defective anastomosis and Cdc42 activates WASP (Wiskott–Aldrich syndrome protein) and Scar/WAVE complex that induces local assembly of actin filaments, via Arp2/3.
The Par complexes interact with other polarity proteins. Crumb complex comprises transmembrane protein Crumbs and scaffold protein PALS1 ((protein associated with LIN
junction protein) and regulate epithelial polarity. Particularly Crumb3 nes the apical membrane and induces the formation of tight junctions. Scribble complex
Discs large (DLG) and Lethal giant larvae (LGL) proteins and membrane and also align the mitotic spindle along the apico
Crumb and Par complexes interact by mutual exclusion to establish polarity35(Figure 3B).
Another type of polarity proteins essential for tissue morphogenesis belongs to the planar cell polarity (PCP) pathway. PCP is important in multicellular tissues coordinating cell behavior across
Figure 3 - Cell Polarity.A) Many types of cell polarity such as: front rear (for migration), apico-basal, anterior-posterior polarities
establishment of apico-basal polarity that occurs through negative feedback loops between Par/aPKC complex
complexes and the Scribble and Crumb (Crb) complexes
cytoskeleton rearrangements are determined by local assembly of signaling complexes of Rho-GTPases family (Cdc42, Rho and Rac). Cdc42 and Rac1 are responsible for establishing front-to-rear
larity. Defects in these polarities will lead to defective anastomosis and Scar/WAVE complex
h other polarity proteins. Crumb complex comprises PALS1 ((protein associated with LIN-7)-1) and and regulate epithelial polarity. Particularly Crumb3 nes the apical membrane and induces the formation of tight junctions. Scribble complex proteins and determines membrane and also align the mitotic spindle along the apico-basal axis. Scribble,
(Figure 3B).
Another type of polarity proteins essential for tissue morphogenesis belongs to the planar cell polarity (PCP) pathway. PCP is important in multicellular tissues coordinating cell behavior across A) Many types of cell polarity such as:
front-to-posterior polarities34. B) The basal polarity that occurs through negative feedback loops between Par/aPKC complex, the remaining Par complexes and the Scribble and Crumb (Crb) complexes28.
the tissue, orthogonally to the apico-basal polarity, orienting them with the body axes. Clear examples of this polarity are the orientation of the hairy cells in the inner ear to the plane of the epithelium36 and the orientation of the hairs on the mouse paw to the body axis30. A polarity cue is transmitted locally from one cell to another allowing all cells to respond as a unit. The main PCP signaling pathway is the non-canonical wnt (wingless) signaling in which a surface receptor frizzled, upon binding to Wnt5a or Wnt11 ligands, recruits the adaptor protein Dishevelled (Dvl) that activates Jun kinase-Rac-Rho pathway for cytoskeleton rearrangements36. Wnt5a, for instances, was found to be important for centrosome/Golgi reorientation. There are evidences of a link between Cdc42/Par6/aPKC and Wnt pathway for establishing microtubule polarity, particularly it was found that Dvl2 interacts with aPKC, but this interaction remains unclear37.
I.3. Aims
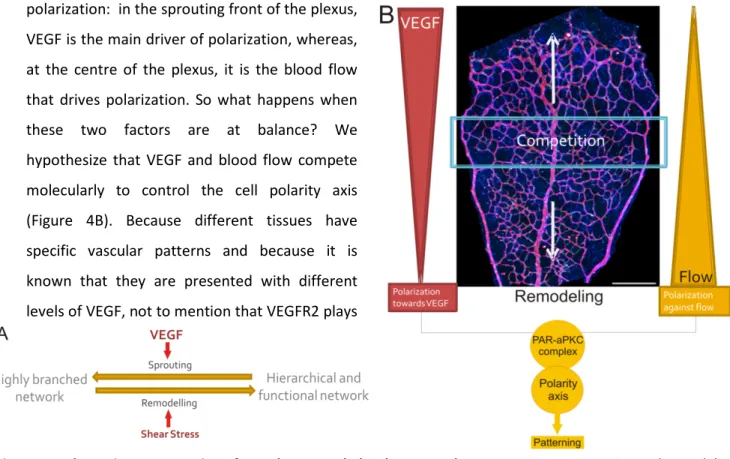
ECs can sense the shear stress induced by blood flow and translate it to cellular signals. Blood flow is known to be the prompter of vessel pruning which is the major remodelling event in vascular morphogenesis. Blood flow induces polarization of ECs against the flow. Also, VEGF promotes angiogenic sprouting and it is known to induce EC polarization9 (Figure 4). Thus, in a growing vascular network, such as the mouse retina model, there are two opposite drivers of EC polarization: in the sprouting front of the plexus,
VEGF is the main driver of polarization, whereas, at the centre of the plexus, it is the blood flow that drives polarization. So what happens when these two factors are at balance? We hypothesize that VEGF and blood flow compete molecularly to control the cell polarity axis (Figure 4B). Because different tissues have specific vascular patterns and because it is known that they are presented with different levels of VEGF, not to mention that VEGFR2 plays
Figure 4 - Schematic representation of vascular network development.A) Angiogenesis as a sprouting and remodeling event controlled by VEGF and shear stress respectively. B) Cell polarity competition by VEGF and blood flow in retina plexus. At the sprouting front of the plexus VEGF is the dominant factor that induces polarization of endothelial cells towards it. At the center of the plexus, blood flow is the key factor regulating polarization against it. In the middle, both factors are at balance and so the hypothesis is that there may be a competition for establishing the polarity axis, possibly at Par/aPKC complex level. This competition may influence blood vessel morphology and vascular pattern.
a role not just in sprouting, but in shear stress sensing, it is also proposed that this competition may determine vessel patterning, which is important for tissue-specific functions. Several questions remain open in the field: What is the balance between VEGF and the flow signalling and when does one signal overcomes the other defining the polarity axis? Does VEGF influence polarization against the flow in an organ specific way and thereby influence vessel morphology? To be able to address these important questions we need to develop novel methods enabling 3D imaging in order to visualize vasculature in organs with single cell resolution for specific assessment of EC polarity patterns in whole organs. Thus, my master thesis work aims at adapting tissue clearing techniques to be able to use our own developed protocol to investigate EC polarity in 3D plexuses. Then, we aim at generating 3D maps of vascular networks of different organs and correlate blood flow, VEGF levels and endothelial cell polarity patterns to organ-specific vascular morphometric parameters.
I.3.1. Tissue Clearing
To get a 3D image of the vasculature, confocal microscopy and Lightsheet microscopy are used combined with techniques of tissue clearing. With the advent of optical sectioning microscopes, that allows imaging in depth, problems still arise from looking at thick tissue. The major problem is the translucence of biological tissues that lowers resolution and prevents deeper imaging38. This intrinsic appearance is due to multiple light scattering which consists in interference of absorbed and emitted light from neighbouring atoms. Organic materials tend to have this property due to their thickness and molecular heterogeneity, being the major source of scattering the membrane lipids. To overcome this problem, optical clearing methods were created in order to smooth the density of the scattering materials (by matching the refractive indexes) so that light will be able to cross the tissue more uniformly. There are two techniques for tissue clearing: Spalteholtz’s method of solvent-based tissue dehydration and the aqueous-based techniques. The first technique dehydrates the tissue and removes lipids. Afterwards, the tissue is placed in higher refractive index solution that removes lipids and clears the tissue. One example is the iDISCO technique39. The aqueous-based techniques emerged due to loss of fluorescence from endogenous fluorescence proteins (eg GFP or lipophilic dyes) 38. There are three approaches to aqueous-based which are simple immersion (ClearT240), hyperhydration (Scale41 and CUBIC42,43) and hydrogel embedding (PACT44). Some of these techniques, despite preserving fluorescence, take a long time to acquire the transparency in larger tissues, not to mention that they use highly denaturing agents to which some antibodies are sensitive45,38. In this thesis we focus on establishing a protocol that clears and allows the specific vessel markers staining compatibility in order to acquire large 3D images for polarity analysis.
Chapter II – Materials and Methods
II.1. Mice manipulation and Perfusion
All mice used during this project were sacrificed using CO2 exposure. All animals were fed freely and housed in SPF facilities. Animal experiments were approved by the Animal Ethics Committee of Instituto de Medicina Molecular (iMM) and according to National Regulations.
II.1.1. Simple perfusion protocol
A needle was inserted in the left ventricle to perfuse the reagents. The collecting product would exit the vasculature through an induced lesion in the right atrium. The first reagent perfused was PBS 1x (pH7.4) with Heparin (10U/mL) to clear the blood. Afterwards, organs were fixed in 4% (wt/v) PFA in PBS 1x solution in order to preserve the vascular architecture and finally washed in PBS 1x (pH7.4). The organs were removed and immersed in a 4% (wt/v) PFA solution for post fixation overnight in a roller at 4oC44.
II.1.2. CUBIC - CB-perfusion
After perfusion of PBS/Heparin (10U/mL), 4%PFA and PBS 1x, 30 mL of a ½ diluted Reagent 1/water solution was perfused. After acquiring a translucid appearance, the organs were removed and directly placed in Reagent 1 overnight at 37oC shaking. Reagent 1 was being replaced as the solution would turn green, from heme solubilization, for 3 days at 37oC shaking. To stop the clearing with reagent 1, the organs were washed with PBS (3x 2h). After the immunostaining the organs were placed in 50% Glycerol solution overnight and then placed in Reagent 2 for clearing (final refractive index matching). The following day the Reagent 2 was replaced. Reagents formulation in Supplementary Table 2 and were prepared according to the described protocol46 – a modified version of this protocol is described below in clearing techniques.
II.1.3. Modified CUBIC
After perfusion of PBS/Heparin (10U/mL), 4%PFA and PBS 1x, 20 mL of a ½ diluted Reagent 1/water solution was perfused and then washed out with PBS 1x. Extracted organs were post fixed with 4%PFA overnight at 4oC. After PBS 1x washes the organs were immersed in Reagent 1 for one day. After PBS 1x washes, immunostaining was performed and then a post-fixation step was conducted. Afterwards organs were placed in 50% Glycerol solution overnight. The following day the tissues were immersed in Reagent2.
II.2. Immunostaining Protocol
II.2.1. Organs
The organs were immersed in a pre-treatment solution (formulation in Supplementary Table 2) overnight, followed by CBB (Cláudio’s blocking buffer) (formulation in Supplementary Table 2) washes every 2h and overnight. Samples were incubated with the primary antibodies (1:200 Rat anti-ICAM and Rabbit anti-Erg in 1:1 PBS/CBB) for two days. The organs were washed with PBT solution (0,1%Triton X-100 in PBS 1x) with 2h washes over the course of a day and overnight. Then, samples were incubated in secondary antibody solution (1:200 IgG anti-Rat conjugated with AlexaFluor 555 and IgG anti-rabbit conjugated with AlexaFluor 647 in 1:1 PBS/CBB) for two days. Afterwards, the organs were washed with PBT and further stored in PBT.
II.2.2. Retinas
Pre-treatment was applied for 4h/overnight at 4oC with shaking. Afterwards, retinas were incubated in 100µL of primary antibody solution (1:200 Rat anti-ICAM and 1:400 Rabbit anti-Erg in 1:1 PBS/CBB) overnight at 4oC, washed with PBT 3x60min and then incubated in 100µL of secondary antibody solution (1:200 IgG anti-Rat conjugated with AlexaFluor 555 and 1:400 IgG anti-rabbit conjugated with AlexaFluor 647), 4oC overnight. These retinas were washed afterwards with PBT and stored in PBT at 4oC.
II.2.3. GOLGI immunostaining in organs
Because golgi and nucleus primary antibodies were raised in the same species the immunostaining protocol was different. The organs were immersed in a pre-treatment solution overnight, followed by CBB washes every 2h and overnight. Samples were then incubated with the primary antibodies (1:200 Rat anti-ICAM and Rabbit anti-GOLPH4 in 1:1 PBS/CBB) for two days, washed with PBT every 2h and overnight and then incubated with a secondary antibody solution (1:200 IgG anti-Rat conjugated with AlexaFluor 555 and IgG anti-rabbit conjugated with AlexaFluor 488 in 1:1 PBS/CBB). After PBT washes, organs were incubated with anti-rabbit Fab fragments to block the anti-GOLPH4 primary antibodies and this blocking was fixed with 4%PFA for 15 min. After PBS 1x washes, organs were incubated in CBB overnight and then incubated with rabbit anti-ERG 1:200 in PBS/CBB. After PBT washes, secondary antibody incubation started using IgG anti-rabbit conjugated with AlexaFluor 647 in 1:1 PBS/CBB. Afterwards, organs were post fixed with 4%PFA/1%Glutaraldehyde overnight at 4oC.
II.3. Clearing Techniques
II.3.1. ClearT2 Protocol
Following immunostaining, organs were placed in a 25%Formamide/10%PEG solution for 1h. Next, samples were immersed in a 50%Formamide/20%PEG solution for 1h, and the solution replaced for another 16h. Samples were immediately imaged using the final clearing solution as imaging solution. The clearing solutions were prepared according to the described protocol40
II.3.2. iDISCO Protocol
Samples were washed with 0,2%Triton X-100 in PBS 1x and immersed in PBS/0.2% TritonX-100/20% DMSO, at 37oC overnight. Then, samples were immersed in PBS/0.1% Tween-20/0.1% Triton X- 100/0.1% deoxycholate/0.1% NP40/20% DMSO, at 37oC overnight and washed in 0,2%Triton X-100 in PBS 1x. Then they were immersed in PBS/0.2% Triton X-100/20% DMSO/ 0.3 M glycine at 37oC overnight and in PBS/0.2% Triton X-100/ 10% DMSO/6%FBS at 37oC overnight. Immunostaining was performed as described before. The clearing starts with an overnight incubation of the samples in 50% v/v tetrahydrofuran/H2O (THF) in a glass vial with a silicon-coated cap. Afterwards samples were immersed in 80% THF/H2O for 1 hr and 100% THF for 1h twice. Samples were then dried and placed in dichloromethane (DCM) until they sank at the bottom of the vial. Finally, samples were placed in dibenzyl ether (DBE) until clearing was achieved.
II.3.3. PACT Protocol
After post fixation in PFA, samples were Incubated in monomer A4P0 (Acrylamide 4%, PFA 0%) supplemented with photoinitiator 2,2’-Azobis[2-(2-imidazolin-2-yl)propane] dihydrochloride 0,25% at 4oC overnight. Then they were transferred to a 37oC waterbath for 6h for polymerization. Samples were incubated in 8%SDS solution at 37oC shaking for 2-5 days. The immunostaining was performed after clearing and afterwards samples were placed in Imaging media RIMS (88% Histodenz in water).
II.3.4. Protocol 1
Part of the CB-perfusion was performed, applying the perfusion of PBS/Heparin (10U/mL), 4% PFA and diluted Reagent1, but, afterwards, Reagent1 was cleared out with PBS1x and the organs were extracted for post fixation overnight at 4oC. Then immunostaining was performed and clearing performed with ClearT2.
II.3.5. Protocol2 – Second Modified CB-perfusion
After perfusion of diluted Reagent 1, PBS1x was perfused to clear out the Reagent1 and organs were extracted for post fixation overnight at 4oC. Then immunostaining was performed. After
post fixation of the immunostaining, organs were immersed in Reagent1 only for 1day, washed out with PBS1x, immersed in 50%Glycerol for overnight and placed in Reagent2 for two days.
II.4. Imaging
Image acquisition was made using Point Scanning Confocal microscopes Zeiss LSM 710, LSM 880 and Light Sheet Fluorescence microscope Zeiss Lightsheet Z1. Samples were first evaluated with the confocal microscopes for signal strength using fluorodishes. The last clearing solution was used to cover the bottom of the dish and the organs were placed in the dish. Afterwards, organs were imaged in sRIMS/RIMS solution, the solution with compatible RI and the one solution to be used in the Lightsheet chamber. After checking signal quality with confocal microscopes, the samples that were most cleared were visualized with the lightsheet. The lightsheet microscope has a chamber that is filled with the imaging media with RI matching the tissues. The tissues were glued to a capillary and placed inside the chamber. The capillary was controlled by the software in order to position the sample in terms of xyz coordinates inside the chamber and the angle that allows the lightsheet to pass. The imaging software used was Zeiss Zen lite® that supports CZI formats.
II.5. Processing
Images from confocal acquisition were processed by image analysis and visualization software Fiji. In Fiji, the z-stacks were downsampled by Maximum Intensity Projection (MIP) to a single image in order to adjust signal brightness and contrast. After processing, files were converted to TIFF format. CZI files can also be directly opened on Imaris® which is a 3D and 4D real time interactive data visualization and management software. Lightsheet images were processed on Arivis 4D Vision® for images that were acquired using multiview combined with tile scan mode. Arivis 4D vision® is the software that allows handling of huge amount of multi-channel data. It provides tools for stitching and alignment to generated multidimensional image stacks Because Arivis generates files with SIS format, not recognizable by Imaris®, after processing with Arivis software for stitching, the image was converted to TIFF, generating a number of TIFF files equal to the number of Z-stacks and with separated channels. Using Fiji, the files were assembled for each channel, then merged and a Hyperstack was created. On Imaris® we could open these TIFF files. For images that were acquired with a simple Z-stack on lightsheet, the files could be directly opened on Imaris.
II.6. Polarity vectors drawing
Using Fiji each channel was saved separately. They were assembled and saved in TIFF format. Using a Matlab script designed for polarity analysis in 2D images, the image was opened and the vectors were drawn from nucleus to Golgi. Because Golgi staining is not specific for EC, we had to maintain an opened file with separated Z-stack in order to detect which Golgi belonged to which nuclei.
Chapter III: Results
III.Clearing Techniques
The vascular network visualization in organs requires the application of clearing techniques and immunofluorescence in order to enable us to visualize vessel lumen (stained with anti-ICAM2/CD102), endothelial nuclei (stained with anti-ERG - erythroblast transformation-specific-related gene) and the Golgi apparatus (stained with anti-GOLPH4). These clearing techniques were optimized for imaging with lightsheet microscopy. In a first approach, we selected four clearing methods according to the previews descriptions of each technique, immunostaining compatibility and fluorophore emission38. Due to the fact that ICAM2 binds to the vessel membrane, we considered that techniques of passive delipidation would interfere with that specific staining. However previous descriptions showed compatibility of some of these clearing techniques (iDISCO, PACT and CUBIC) with membrane staining. We decided to begin testing the clearing methods with iDISCO (a basic technique belonging to the solvent-based clearing approach), ClearT2 (a simple immersion approach that uses formamide), PACT (an improved technique from the hydrogel-embedding approach) and CUBIC (an Hyperhydration approach) (see Table 1 for details).
iDISCO - immunolabelling-enabled three-dimensional imaging of solvent-cleared organs
The Solvent-based clearing techniques were the first to be developed. For more than one century resins were used in the biology field to stabilize samples, because of their hydrophobicity that would cause dehydration of tissue. Spalteholz first described a clearing method for large tissue in the beginning of the 20th century, but it was a harsh method that would damage the surface few centimeters. For solvent-based clearing techniques the first step is tissue dehydration, since water holds a lower refractive index compared to cellular structures. Tissues are immersed in alcohol/water solutions (with progressive decrease of water concentration), followed by immersion in solvents that delipidize the tissue45.
ClearT2
ClearT2 is a simple immersion technique that does not remove lipids or water. It is an improvement of ClearT technique in which formamide is used to better match the refractive index of tissues. But formamide alone was not compatible with immunostaining or fluorophore emission, so ClearT2 was developed by adding Polyethilene Glycol (PEG) to the formamide solution. PEG would help to stabilize the protein conformation as well as immunostaining and fluorophore emission40.
PACT - passive clarity technique
PACT is a hydrogel embedding technique in which the hydrogel is used for purpose of tissue structure stability, lipids are then extracted with ionic detergents and finally the cleared tissue is