Resistance Mutation on Parasite Growth In Vitro
Gabrielle Fröberg,aPedro Eduardo Ferreira,a,bAndreas Mårtensson,a,cAbdullah Ali,dAnders Björkman,aJosé Pedro Gilb,e,f
Malaria Research Group, Department of Medicine, Karolinska Institutet, Stockholm, Swedena; Drug Resistance and Pharmacogenetics Group, Institute of Biotechnology and Bioengineering, Centre of Molecular and Structural Biomedicine, University of Algarve, Faro, Portugalb; Division of Global Health (IHCAR), Department of Public Health Sciences, Karolinska Institutet, Stockholm, Swedenc; Zanzibar Malaria Control Programme (ZMCP), Zanzibar, Tanzaniad; Laboratory of Molecular Anthropology and Health, Department of Anthropology, Binghamton University, Binghamton, New York, USAe; Drug Resistance Unit, Section of Pharmacogenetics, Department of Physiology and Pharmacology, Karolinska Institutet, Stockholm, Swedenf
Plasmodium falciparum mutations associated with antimalarial resistance may be beneficial for parasites under drug pressure, although they may also cause a fitness cost. We herein present an in vitro model showing how this combined effect on parasite growth varies with the drug concentration and suggest a calculated drug-specific cost-benefit index, indicating the possible ad-vantage for mutated parasites. We specifically studied the D-to-Y change at position 1246 encoded by the pfmdr1 gene (pfmdr1 D1246Y) in relation to amodiaquine resistance. Susceptibilities to amodiaquine, desethylamodiaquine, and chloroquine, as well as relative fitness, were determined for two modified isogenic P. falciparum clones differing only in the pfmdr1 1246 position. Data were used to create a new comparative graph of relative growth in relation to the drug concentration and to calculate the ratio between the benefit of resistance and the fitness cost. Results were related to an in vivo allele selection analysis after amodi-aquine or artesunate-amodiamodi-aquine treatment. pfmdr1 1246Y was associated with decreased susceptibility to amodiamodi-aquine and desethylamodiaquine but at a growth fitness cost of 11%. Mutated parasites grew less in low drug concentrations due to a pdominating fitness cost, but beyond a breakpoint concentration they grew more due to a prepdominating benefit of increased re-sistance. The cost-benefit indexes indicated that pfmdr1 1246Y was most advantageous for amodiaquine-exposed parasites. In vivo, a first drug selection of mutant parasites followed by a fitness selection of wild-type parasites supported the in vitro data. This cost-benefit model may predict the risk for selection of drug resistance mutations in different malaria transmission settings.
A
rtemisinin-based combination therapy (ACT) is recom-mended as first-line therapy against uncomplicated Plasmo-dium falciparum malaria worldwide (1). The artesunate and amo-diaquine (AQ) combination (ASAQ), which has proven efficacious in Africa (2), is one of the essential ACTs. AQ and its slowly elimi-nated active metabolite desethylamodiaquine (DEAQ) are 4-amino-quinolines structurally related to chloroquine (CQ). AQ has been used previously in monotherapy for uncomplicated P. falciparum malaria in parts of Africa, where it has remained relatively efficacious despite the similarities and putative cross-resistance with CQ (3,4).Several genetic alterations have been associated with tolerance/ resistance to different long-acting ACT partner drugs. Resistance to CQ, AQ, and DEAQ has been associated with the K76T muta-tion encoded in the P. falciparum CQ resistance transporter gene (pfcrt) and with the N86Y mutation encoded in the P. falciparum multidrug resistance 1 gene (pfmdr1) (5–13). Further, the D1246Y mutation encoded in pfmdr1 (pfmdr1 D1246Y) has been selected for after treatment with AQ monotherapy and ASAQ combina-tion therapy in East Africa (8,14).
Mutations may also affect parasite fitness, however. Biological fitness is essentially defined as the ability of an organism to survive and propagate its genes to the next generation (15). It has been shown for several organisms that the wild-type genotype is nor-mally the most viable and that mutations that are advantageous for surviving environmental challenges are acquired at a fitness cost (16–19). This may also apply to drug resistance in malaria, where mutations might be disadvantageous in the absence of drug pressure. This is supported by an in vitro study where transfected isogenic parasites with a triple mutation in the pfmdr1 gene pro-duced fewer viable merozoites (20). Further, lower parasite
den-sities in vivo were associated with T at position 76 encoded by pfcrt (pfcrt 76T) and Y at position 86 encoded by pfmdr1 (pfmdr1 86Y) in Guinea Bissau (21), and their prevalences decreased after dis-continued use of CQ in Malawi (22).
The beneficial effect of resistance and a possible fitness cost counteract each other. The eventual effect on parasite growth and a possible selection varies upon different settings of malaria ende-micity and local drug policies. Mathematical models suggest that an important factor determining the spread of drug resistance is the proportion of infected people being treated, i.e., the fraction of the total parasite population under drug pressure (23). In areas of low endemicity, such as South-East Asia, where a majority of the infected individuals are symptomatic and treated, the resulting high-drug-pressure environment is favorable for the selection and spread of drug-resistant mutated parasites (24,25). Conversely, in area of high endemicity, such as sub-Saharan Africa, a large pro-portion of malaria-infected individuals are semi-immune and asymptomatic and thus are not treated with antimalarial drugs. In the latter areas, mutated parasites with significantly reduced
fit-Received 8 May 2012 Returned for modification 11 July 2012 Accepted 26 November 2012
Published ahead of print 3 December 2012
Address correspondence to Gabrielle Fröberg, [email protected]. Supplemental material for this article may be found athttp://dx.doi.org/10.1128
/AAC.00950-12.
Copyright © 2013, American Society for Microbiology. All Rights Reserved.
doi:10.1128/AAC.00950-12
on May 21, 2019 by guest
http://aac.asm.org/
MATERIALS AND METHODS
P. falciparum clones for in vitro analyses. Two P. falciparum clones differing only in the pfmdr1 1246 position were chosen for this study (26). They were obtained through genetic modification of the CQ-sensitive D10 clone from Papua New Guinea, i.e., the transfection control, D10
pfmdr1 SND, representing the wild-type pfmdr1 D1246 clone (D10wt), and D10 pfmdr1 SNY, with a single modification, representing the mu-tated pfmdr1 1246Y clone (D10mut). Both clones (reference no. MRA-563 and MRA-564, respectively) were obtained from the Malaria Research and Reference Reagent Resource Center (MR4). Their respective geno-types were confirmed with PCR-restriction fragment length polymor-phism (RFLP) and genomic DNA (gDNA) sequencing.
Drug susceptibility analyses. The effect of the pfmdr1 D1246Y
muta-tion on parasite susceptibility to CQ, AQ, and DEAQ was determined through an HRP2 enzyme-linked immunosorbent assay (HRP2-ELISA)-based in vitro assay as previously described (27). In vitro-cultured parasite clones (D10wtand D10mut) were diluted to initial parasitemias of 0.05% and aliquoted into microculture 96-well plates predosed with ascending concentrations of 0 to 404 nM CQ, 0 to 67 nM AQ, or 0 to 156 nM DEAQ. After incubation at 37°C for 72 h, the samples were freeze-thawed, trans-ferred, and processed in precoated ELISA plates (Cellabs, Sidney, Austra-lia) for spectrophotometric analysis (Multiskan EX; Thermo Labsystems, Helsinki, Finland) of HRP2 produced during parasite growth. The 50% and 90% inhibitory concentration (IC50and IC90) values were calculated using the software program HN-NonLin V1.05 Beta (H. Noedl, 2001) (http://malaria.farch.net). The IC20values were calculated by applying a polynomial trend line on the average HRP values and solving its equation at y⫽ 80% (SigmaPlot 11.0; Systat Software Inc., Chicaco, IL). All cultures were run in duplicate and independently tested for their drug susceptibil-ities six times.
Relative growth and fitness analyses. The effect of the pfmdr1
D1246Y mutation on relative parasite growth was determined in a com-petition experiment between synchronized ring-staged cultures of D10wt and D10mutclones in vitro. The cultures were initially subcultivated to 0.5% parasitemia. Equal aliquots of each culture were added into a 1:1 mixed culture and run in medium containing drug concentrations corre-sponding to the approximate IC20value (CQ, 15 nM; AQ, 10 nM; or DEAQ, 10 nM) or IC50(CQ, 30 nM; AQ, 20 nM; DEAQ, 20 nM) for the two clones. In the IC20-based cultures, drug exposure was removed after 6 days, while in the IC50-based cultures, drug exposure was removed after 4 days, when the parasite densities had decreased to approximately 0.1%. After drug removal, all cultures were washed thoroughly and then run in drug-free medium until 6 days after the time of parasite recovery, when regrowth of remaining parasites was established. The time of recovery was defined as the day when growing ring-stage trophozoites were first ob-served microscopically after drug removal. In parallel to the drug-exposed cultures, control cultures were run in drug-free medium for a total of 12 days, including a subcultivation to 0.5% parasitemia after 6 days. Blood medium was collected for microscopy and spotted on filter paper (3MM Whatman) for genotyping every second day. All mixed cultures were run in duplicate.
DNA was extracted from the filter papers using a QIAamp DNA mini-kit (Qiagen). Amplification was performed through nested PCR using previously published first primers (28) and specifically designed nest primers, i.e., forward (5=-TTTTCAAACCAATCTGGATCTG-3=) (biotin-ylated) and reverse (5=-CTCTGTTTTTGTCCACCTGATAAG-3=). All
CTACGTCTA. Results were adjusted against a standard curve, derived from a scale of established mixes of the two alleles, and corrected for the allele exchange output, i.e., the presence of two pfmdr1 fragments in the transfected genome (26). All samples were run in triplicate. Thus, all sam-ples were separately run a total of six times for each time point.
Allele selection analysis in vivo. To explore whether a cost-benefit
effect of pfmdr1 D1246Y might be reflected in the parasite selection dy-namics after AQ or ASAQ therapy in vivo, we analyzed the allele frequen-cies in baseline infections compared with those in recurrent and more specifically recrudescent infections during follow-up in three previously conducted drug efficacy trials in children⬍5 years old with uncompli-cated P. falciparum malaria in East Africa. These include an AQ mono-therapy study in Kenya in 2003 (n⫽ 53) (7) and two ASAQ combination therapy studies in Zanzibar in 2002-2003 (n⫽ 198) and 2005 (n ⫽ 174) (14,30). DNA from blood samples collected on filter papers (3MM; Whatman, United Kingdom) had previously been extracted (Bloodprep; Applied Biosystems). pfmsp2 genotyping was performed to distinguish between recrudescent and reinfecting parasites (31). PCR-RFLP was used for pfmdr1 D1246Y genotyping (5,28), and mixed results were excluded since we did not have information on the separate allele proportions within such infections.
Data analysis and statistics. In vitro susceptibilities were compared
using Student’s t test (SigmaPlot 11.0; Systat Software Inc., Chicago, IL). Statistical significance was defined as a P value ofⱕ0.05 and controlled according to the Bonferroni method.
The relative growth rate (g) of the mutant clone in the competition experiment was calculated from the following equation: log(mutt/wtt)⫽ log(mut0/wt0)⫹ [t ⴱ log(g)]. “mut” and “wt” represent the proportions of the mutant and the wild-type alleles initially (t0) and after a defined num-ber (t) of asexual generations during the course of the experiments. g for the wild-type clone was defined as 1.0, whereas g for the mutant clone under drug-free conditions corresponds to the relative fitness (w), and the fitness cost was calculated as 1⫺ w (20,32).
For comparison, the relative absorbance (abs) of the mutant clone in the HRP2-ELISA susceptibility analyses was calculated by normalizing against the background absorbance in the following equation: g⫽(10^abswellAmut/ 10^abs well Hmut)/(10^abs well Awt/10^abs well Hwt).
Ethical considerations. All clinical trials were performed in
accor-dance with the Declaration of Helsinki (33) and ICH good clinical practice (34). Informed consent was obtained from parents/guardians of all en-rolled participants. Ethical approvals were obtained from the Research Ethics Committee at Karolinska Institutet in Stockholm, Sweden (KI Dnr 03-545, KI Dnr 03-753, and KI Dnr 2005/57-31), the Ethical Research Committee, Nyanza Province, Kenya (GN.153, vol. 1/50), and the Zanzi-bar Health Research Council (ZHRC/GC/2002 and ZMRC/RA/2005).
RESULTS
pfmdr1 1246Y is associated with decreased susceptibilities to AQ/DEAQ. In the drug susceptibility analyses, the profiles dif-fered for the three drugs (see Table S1 in the supplemental mate-rial). For CQ, no difference in the IC50was found between the
D10wtand D10mutclones, whereas for AQ and DEAQ,
signifi-cantly higher IC50s (P⬍ 0.001) were found for D10mut(28.7 nM;
95% confidence interval [CI95], 26.8 to 30.6; and 20.5 nM; CI95,
on May 21, 2019 by guest
http://aac.asm.org/
19.4 to 21.5 [respectively]) compared with D10wt(15.1 nM; CI95,
13.1 to 17.1; and 15.3 nM; CI95, 13.5 to 17.0 [respectively]).
The cost-benefit effect of pfmdr1 1246Y on parasite growth varies with the drug concentration. In the competition experi-ments, parasites exposed to IC20drug concentrations grew 10 to
15% less than non-drug-exposed parasites and recovered without delay upon drug removal. Parasites exposed to IC50s of CQ, AQ, or
DEAQ grew 70 to 80% less than non-drug-exposed parasites and did not recover until day 6, 14, or 18 after drug removal, respec-tively.
The fact that the cultures did not grow exactly 20% and 50% less might be a result of an unequal effect of the approximate IC20
or IC50on the D10wtand D10mutclones included in these mixed
cultures.
The relative growth of the D10mutclone differed depending on the degree of drug exposure (Fig. 1; see also Table S2 in the sup-plemental material). In the drug-free control cultures, the propor-tion of D10mutcontinuously decreased, from 48.0% to 30.9% over
the full culture period of 12 days (P⬍ 0.001), which corresponds to a negative relative fitness compared with findings for D10wt
(w⫽ 0.89). In the cultures exposed to IC20values of CQ, AQ, or
DEAQ, the proportions of D10mutalso decreased, but to a lesser
extent, i.e., from 47.3% to 39.3%, 39.5%, or 39.2%, respectively. This also corresponds to negative relative growth rates (g⫽ 0.95 0.95, or 0.94, respectively). In contrast, in the cultures exposed to IC50 concentrations of CQ, AQ, or DEAQ, the proportion of
D10mutincreased, i.e., from 48.8% to 64.2%, 65.0%, or 56.3%, respectively. This instead corresponds to positive relative growth rates (g⫽ 1.11, 1.12, or 1.05, respectively). The observation that D10mutalso increased under CQ exposure might be due to the
similar IC50s between the clones, and under such circumstances,
minimal differences in synchronization may interfere.
Model to assess cost-benefit effect of pfmdr1 1246Y. The rel-ative growth rate of D10mutwas thus negative in the drug-free and
IC20-exposed cultures and positive for the IC50-exposed cultures.
To analyze how the relative growth for D10mutversus that for
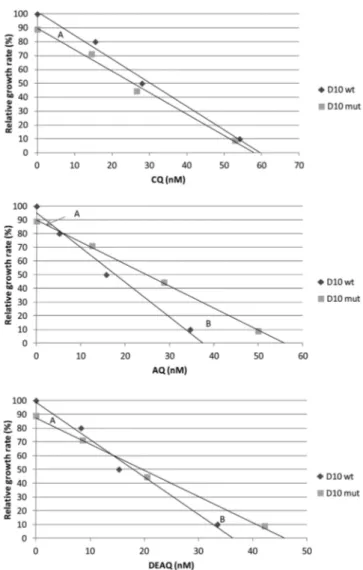
D10wtvaries with the drug concentration, we developed a new comparative cost-benefit graph (Fig. 2). Under drug-free condi-tions, the maximum growth rate for D10wtwas defined as 100% (g⫽ 1.0), and for D10mut, it was defined as 89%, corresponding to
the relative fitness (w⫽ 0.89) derived from the competition
ex-periment. For each clone, the 80%, 50%, and 10% relative growth rates were then plotted against the respective IC20, IC50, and IC90
values derived from the susceptibility analyses.
Applied trend lines showed that D10mutgrew least compared
with D10wt under drug-free conditions. With increasing drug concentrations, the difference in the growth rate continuously de-creased until the trend lines potentially crossed at a breakpoint concentration, after which D10mut grew continuously more.
Hence, the relative growth rates of D10mutparasites were thus negative in drug concentrations lower than the breakpoint con-centration, where the benefit of resistance equals the fitness cost, while in higher concentration the relative growth rates were pos-itive. The areas between the trend lines correspond to the fitness cost (area A) and the benefit of resistance (area B) over the full drug concentration range. The ratio between area B and area A divided by the breakpoint concentration represents a cost-benefit index. This index might correspond to the overall advantage of FIG 1 Proportion (%) (CI95) of the pfmdr1 1246Y allele in the
non-drug-exposed control culture and cultures non-drug-exposed to an approximate IC20(6 days)
or IC50(4 days) of CQ, AQ, or DEAQ. The dashed line is the average original
proportion of the pfmdr1 1246Y allele.
FIG 2 Relative growth rates (%) of D10mutversus D10wtat different
concen-trations of CQ, AQ, and DEAQ (nM). The maximum growth rate for D10mut
without drug exposure was based on the relative fitness (w⫽ 0.89). The other plots are based on the IC20, IC50, and IC90values. The trend line intercept
indicates the breakpoint where the drug resistance benefit equals the fitness cost of pfmdr1 1246Y. Area A represents the fitness cost, and area B represents the drug resistance benefit of pfmdr1 1246Y over the full concentration range.
on May 21, 2019 by guest
http://aac.asm.org/
The results were confirmed experimentally by comparing the relative parasite growth rates with the relative absorbencies de-rived from the HRP2-ELISA susceptibility analyses, where we found a similar pattern (data not shown).
The cost-benefit effect influences the selection of the pfmdr1 D1246Y alleles after AQ/DEAQ exposure in vivo. The treatment outcomes of the AQ and two ASAQ efficacy studies have been described elsewhere (see Table S3 in the supplemental material) (7,14,30). In summary, the crude treatment failure rates were 36%, 40%, and 29%, while the PCR-adjusted treatment failure rates were 19%, 8%, and 9%, respectively. No significant differ-ences in crude or PCR-adjusted treatment failure rates were found between the two ASAQ studies. Aggregate analysis of the pfmdr1 D1246Y allele frequencies over time in all recurrent parasitemias during follow-up after ASAQ therapy showed two selection peaks, i.e., pfmdr1 1246Y on days 8 to 14 and pfmdr1 D1246 on days 22 to 28 (Fig. 3). This was followed by a return to the baseline frequen-cies between days 29 and 42. A similar pattern was also observed in recrudescent infections specifically, although the number of infec-tions was small, and after AQ monotherapy, even though the fol-low-up duration was only 21 days in this study.
The prevalence of children with recurrent parasitemia during the first selection peak of pfmdr1 1246Y was statistically signifi-cantly lower after ASAQ combination therapy (7/294; 2%) than with AQ monotherapy (12/28; 43%) (P⬍ 0,001) (Fig. 3; see also Table S3 in the supplemental material).
DISCUSSION
AQ is an essential ACT partner drug, since ASAQ is presently a first-line treatment of uncomplicated P. falciparum malaria in more than 20 African countries (35), although resistance against AQ/DEAQ both in vitro and in vivo has been described (6–8,10,
11,13,14). The sustained efficacy of AQ as a long-acting partner drug in ACT is therefore a matter of concern. Understanding the pharmacodynamic basis of selecting resistance to this quinoline is thus fundamental. Our in vitro results with allele-exchanged par-asites confirm that pfmdr1 1246Y is associated with decreased sus-ceptibility to AQ and DEAQ. This was further supported by its selection upon drug pressure in the competition experiments. These results, together with our previous findings of its selection after AQ/ASAQ treatment in vivo (7, 14), therefore support pfmdr1 1246Y as a molecular marker associated with resistance to AQ/DEAQ.
In the competition experiments, the fitness cost for parasites carrying the pfmdr1 1246Y mutation was determined to 11% per asexual generation. This cost-benefit effect of the pfmdr1 D1246Y mutation on protein function is supported by results from a re-cent bioinformatic analysis (36). PfMDR1 is located in the mem-brane of the digestive vacuole with its nucleotide binding site fac-ing the parasite cytoplasm (37). Subcellular studies of the distribution of fluorescein derivatives (Fluo-4) (38) suggest that
PfMDR1 is an importer of diverse substrates into this organelle. The localization of pfmdr1 D1246Y in the structure of the trans-porter suggests a functional impact on the influx capacity of the mutated protein (36). This might decrease the import of amino-quinoline compounds and hence their access to their active site inside the digestive vacuole, thus reducing drug susceptibilities (38). However, the effect might vary due to differences in the chemical structure and binding sites, which might interact un-equally with an altered protein structure and function. A reduced capacity may also affect the import of essential substrates. This might affect fundamental processes inside the food vacuole. Con-sequently, parasites carrying the pfmdr1 D1246Y mutation may be less competitive than wild-type parasites in the absence of amino-quinoline drug pressure.
We have herein described a new cost-benefit graph, where the relative growth of parasites with a particular mutation corre-sponds to a concentration-dependent balance between the spe-cific benefit of resistance and the fitness cost. Mutated parasites grow less in low drug concentrations due to a predominating fit-ness cost, but beyond a breakpoint concentration they potentially grow more due to a predominating benefit of increased resistance. Based on the D10mut-versus-D10wtdata, we calculated the cost-FIG 3 Frequencies (%) of the pfmdr1 D1246Y alleles (first axis) in the
pro-portion (%) of children (second axis) with recurrent infections during fol-low-up (days) after AQ monotherapy in Kenya 2003 (n⫽ 53), as well as recurrent and recrudescent infections after ASAQ combination therapy in Zanzibar, 2002-2003 and 2005 (n⫽ 372).
on May 21, 2019 by guest
http://aac.asm.org/
benefit indexes representing the drug-specific advantage of pfmdr1 1246Y in relation to the breakpoint concentrations, which indicate the risk for selection. Pfmdr1 1246Y was most advanta-geous for parasites exposed to AQ and second most for parasites exposed to DEAQ. For parasites exposed to CQ, no similar advan-tageous effect of this mutation could be observed. Such cost-ben-efit indexes may potentially be used as a tool to compare the risk for selection of different mutations associated with tolerance/re-sistance to different ACT partner drugs.
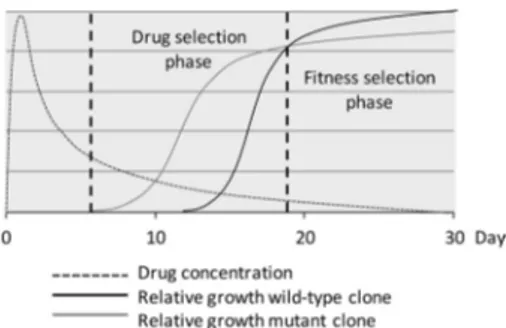
The in vitro findings were consistent with our findings from the clinical trials (Fig. 3). AQ is rapidly and extensively metabolized by the hepatic enzyme system CYP2C8 to DEAQ, with the peak con-centration in plasma within 4 to 6 h and a half-life in plasma of 10 to 14 days (39). Due to the longer half-life, it is probable that DEAQ is mainly responsible for the antimalarial activity. AQ/ DEAQ, as well as CQ, has large volumes of distribution, and con-centrations in blood have been shown to vary significantly (7). A pharmacokinetic study of ASAQ in vivo, however, registered av-erage maximum DEAQ concentrations of 350 to 400 ng/ml on day 3 and 40 to 50 ng/ml on day 14 after treatment (40). This suggests that the registered selection of pfmdr1 1246Y during the first 14 days after AQ/ASAQ treatment is associated with a higher concen-tration of DEAQ, defining the drug selection phase (correspond-ing to area B in vitro). The selection of pfmdr1 D1246 dur(correspond-ing the following 14 days suggests an association with lower concentra-tions of the drug, defining the fitness selection phase (correspond-ing to area A in vitro). This phase extends beyond the follow-up under drug-free conditions. The breakpoint concentration in vitro would thus correspond to the intercept between the two selection phases in vivo.
Mutations associated with drug resistance might be supported by compensatory and/or synergistic mutations (14, 41). In our cost-benefit graph, this will hypothetically result in a decreased fitness cost (area A) and/or increased resistance benefit (area B), along with a leftward motion of the breakpoint concentration, i.e., toward a lower concentration, as well as an increased cost-benefit index in vitro (Fig. 4). An equivalent rightward motion of the selection intercept is expected to happen in vivo, as well as an increased drug selection phase (Fig. 5). However, if synergistic mutations are associated with a further fitness cost, the breakpoint concentration in vitro and selection intercept in vivo might be unaffected, and they may not be more selected for.
The frequency of recurrent parasitemias during the critical drug selection phase was significantly lower after ASAQ than with
AQ monotherapy (Fig. 3; see also Table S3 in the supplemental material). This may suggest that the addition of artesunate reduces the risk of a pfmdr1 1246Y selection, which eventually may result in an overall selection of the wild-type allele in the population. These results may explain our findings from a recent study in Zanzibar in 2010, where the frequency of pfmdr1 1246Y in base-line infections actually had decreased despite 7 years’ use of ASAQ as a first-line treatment (42).
In summary, the results indicate that pfmdr1 1246Y is associ-ated with decreased susceptibility to AQ/DEAQ but at a significant fitness cost to the parasite. Pfmdr1 1246Y is clearly selected for after AQ/ASAQ therapy during the drug selection phase, while artesunate seems to decrease such selection through the effective reduction of early recurrent parasitemias. In addition, pfmdr1 1246Y appears to incur a too-substantial fitness cost to the parasite to be sustained in competition with wild-type parasites in the ab-sence of treatment (drug pressure) (23). This may prevent a selec-tion of pfmdr1 1246Y in the parasite populaselec-tion and development of resistance, possibly supporting AQ as a valuable and potentially sustainable partner drug option for ACT in East Africa.
Finally, the described model may be useful to evaluate the cost-benefit effects of other mutations associated with resistance to ACT partner drugs to predict their potential risk for selection in different malaria transmission settings. Such prediction is impor-tant for future optimized use of partner drugs and as such the conditions for sustained ACT efficacy.
ACKNOWLEDGMENTS
This work was supported by the Swedish International Development Agency, Department for Research Cooperation (SIDA/SAREC) (grant numbers SWE-2005-027/2006-2007 and SWE-2005-027/2008-2009).
We thank the patients and health staff of the different health care centers in Zanzibar for their participation in the clinical studies.
REFERENCES
1. WHO. 2006. Guidelines for the treatment of malaria. WHO, Geneva, Switzerland.
2. Zwang J, Olliaro P, Barennes H, Bonnet M, Brasseur P, Bukirwa H,
Cohuet S, D’Alessandro U, Djimde A, Karema C, Guthmann JP, Hamour S, Ndiaye JL, Martensson A, Rwagacondo C, Sagara I, Same-Ekobo A, Sirima SB, van den Broek I, Yeka A, Taylor WR, Dorsey G, Randrianarivelojosia M. 2009. Efficacy of artesunate-amodiaquine for
treating uncomplicated falciparum malaria in sub-Saharan Africa: a multi-centre analysis. Malar J. 8:203. doi:10.1186/1475-2875-8-203. 3. Childs GE, Boudreau EF, Milhous WK, Wimonwattratee T, Pooyindee
FIG 4 Hypothetical graph of relative growth of a wild-type clone compared
with that of a mutant clone (mutant X). The breakpoint concentration (X to Z) moves toward lower concentrations with the addition of synergistic mutations resulting in an increased resistance benefit (mutant Y) and/or compensating mutations resulting in a decreased fitness cost (mutant Z).
FIG 5 Hypothetical graph of the relative growth rate for a wild-type clone and
a mutant clone in relation to the drug concentration over days after treatment
in vivo. The mutant clone benefits during higher concentrations due to
de-creased drug susceptibility (drug selection phase), while during lower concen-trations beyond the cost-benefit breakpoint, it forfeits due to a fitness cost (fitness selection phase).
on May 21, 2019 by guest
http://aac.asm.org/
tyrosine-86 allele of the pfmdr 1 gene of Plasmodium falciparum by chlo-roquine and amodiaquine. Parasitology 114(Part 3):205–211.
7. Holmgren G, Gil JP, Ferreira PM, Veiga MI, Obonyo CO, Bjorkman A. 2006. Amodiaquine resistant Plasmodium falciparum malaria in vivo is associated with selection of pfcrt 76T and pfmdr1 86Y. Infect. Genet. Evol.
6:309 –314.
8. Humphreys GS, Merinopoulos I, Ahmed J, Whitty CJ, Mutabingwa TK,
Sutherland CJ, Hallett RL. 2007. Amodiaquine and
artemether-lumefantrine select distinct alleles of the Plasmodium falciparum mdr1 gene in Tanzanian children treated for uncomplicated malaria. Antimi-crob. Agents Chemother. 51:991–997.
9. Lakshmanan V, Bray PG, Verdier-Pinard D, Johnson DJ, Horrocks P,
Muhle RA, Alakpa GE, Hughes RH, Ward SA, Krogstad DJ, Sidhu AB, Fidock DA. 2005. A critical role for PfCRT K76T in Plasmodium
falcip-arum verapamil-reversible chloroquine resistance. EMBO J. 24:2294 – 2305.
10. Nsobya SL, Kiggundu M, Nanyunja S, Joloba M, Greenhouse B,
Rosenthal PJ. 2010. In vitro sensitivities of Plasmodium falciparum to
different antimalarial drugs in Uganda. Antimicrob. Agents Chemother.
54:1200 –1206.
11. Picot S, Olliaro P, de Monbrison F, Bienvenu AL, Price RN, Ringwald
P. 2009. A systematic review and meta-analysis of evidence for correlation
between molecular markers of parasite resistance and treatment outcome in falciparum malaria. Malar. J. 8:89. doi:10.1186/1475-2875-8-89. 12. Sidhu AB, Verdier-Pinard D, Fidock DA. 2002. Chloroquine resistance
in Plasmodium falciparum malaria parasites conferred by pfcrt muta-tions. Science 298:210 –213.
13. Warhurst DC. 2003. Polymorphism in the Plasmodium falciparum chlo-roquine-resistance transporter protein links verapamil enhancement of chloroquine sensitivity with the clinical efficacy of amodiaquine. Malar. J.
2:31. doi:10.1186/1475-2875-2-31.
14. Holmgren G, Hamrin J, Svard J, Martensson A, Gil JP, Bjorkman A. 2007. Selection of pfmdr1 mutations after amodiaquine monotherapy and amodiaquine plus artemisinin combination therapy in East Africa. Infect. Genet. Evol. 7:562–569.
15. Orr HA. 2009. Fitness and its role in evolutionary genetics. Nat. Rev. Genet. 10:531–539.
16. Bjorkman J, Andersson DI. 2000. The cost of antibiotic resistance from a bacterial perspective. Drug Resist Updat. 3:237–245.
17. Fohl LM, Roos DS. 2003. Fitness effects of DHFR-TS mutations associ-ated with pyrimethamine resistance in apicomplexan parasites. Mol. Mi-crobiol. 50:1319 –1327.
18. Lu J, Sista P, Giguel F, Greenberg M, Kuritzkes DR. 2004. Relative replicative fitness of human immunodeficiency virus type 1 mutants re-sistant to enfuvirtide (T-20). J. Virol. 78:4628 – 4637.
19. Mariam DH, Mengistu Y, Hoffner SE, Andersson DI. 2004. Effect of rpoB mutations conferring rifampin resistance on fitness of Mycobacte-rium tuberculosis. Antimicrob. Agents Chemother. 48:1289 –1294. 20. Hayward R, Saliba KJ, Kirk K. 2005. pfmdr1 mutations associated with
chloroquine resistance incur a fitness cost in Plasmodium falciparum. Mol. Microbiol. 55:1285–1295.
21. Ursing J, Kofoed PE, Rodrigues A, Rombo L. 2009. No seasonal accu-mulation of resistant P. falciparum when high-dose chloroquine is used. PLoS One 4:e6866. doi:10.1371/journal.pone.0006866.
22. Kublin JG, Cortese JF, Njunju EM, Mukadam RA, Wirima JJ, Kazembe
PN, Djimde AA, Kouriba B, Taylor TE, Plowe CV. 2003. Reemergence
modulates sensitivity and resistance to multiple antimalarials in Plasmo-dium falciparum. Nature 403:906 –909.
27. Noedl H, Bronnert J, Yingyuen K, Attlmayr B, Kollaritsch H, Fukuda
M. 2005. Simple histidine-rich protein 2 double-site sandwich
enzyme-linked immunosorbent assay for use in malaria drug sensitivity testing. Antimicrob. Agents Chemother. 49:3575–3577.
28. Cox-Singh J, Singh B, Alias A, Abdullah MS. 1995. Assessment of the association between three pfmdr1 point mutations and chloroquine resis-tance in vitro of Malaysian Plasmodium falciparum isolates. Trans. R. Soc. Trop. Med. Hyg. 89:436 – 437.
29. Cheesman S, Creasey A, Degnan K, Kooij T, Afonso A, Cravo P, Carter
R, Hunt P. 2007. Validation of pyrosequencing for accurate and high
throughput estimation of allele frequencies in malaria parasites. Mol. Biochem. Parasitol. 152:213–219.
30. Martensson A, Stromberg J, Sisowath C, Msellem MI, Gil JP,
Mont-gomery SM, Olliaro P, Ali AS, Bjorkman A. 2005. Efficacy of artesunate
plus amodiaquine versus that of artemether-lumefantrine for the treat-ment of uncomplicated childhood Plasmodium falciparum malaria in Zanzibar, Tanzania. Clin. Infect. Dis. 41:1079 –1086.
31. Snounou G, Zhu X, Siripoon N, Jarra W, Thaithong S, Brown KN,
Viriyakosol S. 1999. Biased distribution of msp1 and msp2 allelic variants
in Plasmodium falciparum populations in Thailand. Trans. R. Soc. Trop. Med. Hyg. 93:369 –374.
32. Hartl DL, Clark AG. 1997. Principles of population genetics Sinauer Associates, Sunderland, MA.
33. World Medical Association. 2008. WMA Declaration of Helsinki— ethical principles for medical research involving human subjects. World Medical Association. http://www.wma.net/en/30publications/10policies /b3/index.html.
34. ICH. 1996. Good clinical practice. ICH, Geneva, Switzerland.http://www .ich.org/products/guidelines/efficacy/efficacy-single/article/good-clinical -practice.html.
35. WHO. 2011. Country antimalarial drug policies. WHO, Geneva, Switzer-land.
36. Ferreira PE, Holmgren G, Veiga MI, Uhlen P, Kaneko A, Gil JP. 2011. PfMDR1: mechanisms of transport modulation by functional polymor-phisms. PLoS One 6:e23875. doi:10.1371/journal.pone.0023875. 37. Duraisingh MT, Cowman AF. 2005. Contribution of the pfmdr1 gene to
antimalarial drug-resistance. Acta Trop. 94:181–190.
38. Rohrbach P, Sanchez CP, Hayton K, Friedrich O, Patel J, Sidhu AB,
Ferdig MT, Fidock DA, Lanzer M. 2006. Genetic linkage of pfmdr1 with
food vacuolar solute import in Plasmodium falciparum. EMBO J. 25: 3000 –3011.
39. Krishna S, White NJ. 1996. Pharmacokinetics of quinine, chloroquine and amodiaquine. Clinical implications. Clin. Pharmacokinet. 30:263– 299.
40. Stepniewska K, Taylor W, Sirima SB, Ouedraogo EB, Ouedraogo A,
Gansane A, Simpson JA, Morgan CC, White NJ, Kiechel JR. 2009.
Population pharmacokinetics of artesunate and amodiaquine in African children. Malar J. 8:200. doi:10.1186/1475-2875-8-200.
41. Le Bras J, Durand R. 2003. The mechanisms of resistance to antimalarial drugs in Plasmodium falciparum. Fundam. Clin. Pharmacol. 17:147–153. 42. Froberg G, Jornhagen L, Morris U, Shakely D, Msellem MI, Gil JP,
Bjorkman A, Martensson A. 2012. Decreased prevalence of Plasmodium
falciparum resistance markers to amodiaquine despite its wide scale use as ACT partner drug in Zanzibar. Malar. J. 11:321. doi:10.1186/1475-2875-11 -321.