Food Science and Technology
DO:
D https://doi.org/10.1590/fst.15017
OSSN 0101-2061 (Print) OSSN 1678-457X (Dnline)
1 Introduction
Sugarcane (Saccharum spp.) chemical composition varies considerably according to several factors like climate, maturation stage, culture physiological age, physical, chemical and microbiological soil properties, agricultural practices and cultivar. Freshly produced sugarcane juice, known in Brazil as ‘garapa’ is a popular non-alcoholic beverage and according to Yusof et al. (2000) can be stored at 5 °C for four days. The soluble solids content varies from 15 to 25 ºBrix and its pH is between 5 and 6. Cane juice is highly perishable because of the high sugar concentration, the elevated water activity (Aw = 0.99) and the low acidity. The soil and vegetable microorganisms, transferred during harvesting and cutting, are the most relevant, mainly yeasts and filamentous fungi, lactic bacteria and spores. Therefore, shorter processing times in harvesting, decontamination and juice extraction allow for lower effects of microbial activity within the cane stalks and consequently higher quality juices (Dliveira et al., 2007).
Cane juice is typically an opaque liquid with a brown to dark green color. Sugarcane composition affects color due to the presence of anthocyanins, carotenoids, flavonoids, melanoidins, melanins and products from the alkaline degradation of fructose in different amounts, while color influences consumer acceptance. After extraction, several mechanisms can cause juice browning like oxidation of chlorophyll and polyphenols (Prati et al., 2005) and enzymatic browning by polyphenol oxidase (PPD) and peroxidase (PDD) (Bucheli & Robinson, 1994). Besides
the aforementioned chemical and biochemical browning mechanisms, growth of microorganisms can also affect juice color (Dliveira et al., 2007).
Chauhan et al. (2002) studied eight sugarcane cultivars grown in Ondia, based on their suitability for juice production. Juice yields were recorded and samples were subjected to physicochemical and sensory evaluation. On that study, additives were incorporated into the cane juice which was then pasteurized.
Thakar (2012) reported a research work where a cane cultivar was selected for preparing sugarcane juice beverage on the basis of yield and sensory attributes for the storage and processing. Regarding the biochemical parameters and sensory evaluation, the findings showed that the pasteurized juice could be stored safely up to 45 days and used as a nutritious packaged pasteurized sugarcane juice drink alternative to other sugar added drinks.
Nevertheless, the aforementioned authors did not study the color change kinetics of the freshly extracted juice.
Though there are studies that investigate color variation of sugarcane juice, no studies have focused on the influence of cultivar on color nor how it varies during storage of refrigerated unprocessed juice. On this study, physicochemical, microbiological and enzymatic parameters of freshly extracted unprocessed sugarcane juice from four different Brazilian cultivars kept at refrigerated storage for six days were evaluated. Juice instrumental
Cultivar affects the color change kinetics of sugarcane juice
Laura de Queiroz BDMDESPACHD1, Bianca Tanahani Ribeiro da SOLVA1, Judite Lapa-GUOMARÃES1,
Cynthia DOTCHFOELD1, Rodrigo Rodrigues PETRUS1*
Received 12 May, 2017 Accepted 18 July, 2018
1 Departamento de Engenharia de Alimentos, Faculdade de Zootecnia e Engenharia de Alimentos, Universidade de São Paulo – USP, Pirassununga, SP, Brasil
*Corresponding author: [email protected] Abstract
This study evaluated the influence of different Brazilian cultivars (RB867515/C1, SP813250/C2, RB92579/C3 and CTC02/C4) on unprocessed sugarcane juice quality by physicochemical, microbiological and enzymatic analysis. Color parameters were determined during six days at 10 °C. The experimental design was completely randomized with four treatments (cultivars) and three replicates. Significant differences were observed (p ≤ 0.05) among the juice samples from different cultivars. The pH values ranged from 5.09 to 5.25, soluble solids content from 14.13 to 18.60 ºBrix and titratable acidity from 0.035 to 0.120% of citric acid. Counts of mesophiles, psychrotrophs and molds and yeasts varied between 4.8 and 6.2 logCFU mL-1, 3.2 and 4.6 logCFU mL-1
and 3.3 and 4.8 logCFU mL-1, respectively. Polyphenol oxidase and peroxidase activities ranged from 8 to 15 U mL-1 and between
6 and 40 U mL-1, respectively. The initial (t0) lightness varied from 21 to 37 among cultivars, and final values, after six days
of storage (t6), between 22 and 41. Principal components analysis showed that the juice of different cultivars is characterized by different parameters. Considering its lighter color and smaller color variation during storage, juice extracted from cultivar RB867515 presented the greatest potential for consumer acceptance.
color was monitored daily and the influence of these parameters was analyzed.
2 Materials and methods 2.1 Raw material
Four sugarcane cultivars – Saccharum spp. (RB867515 (C1), SP813250 (C2), RB92579 (C3) and CTC02 (C4)) were obtained from the region of Pirassununga/SP, donated by Companhia Muller de Bebidas, Porto Ferreira/SP and Baldin Bioenergia SA, Pirassununga/SP. Harvest occurred a few days before juice extraction.
2.2 Sugarcane juice extraction
The canes were selected, cut and scraped then sanitized by immersion in a peracetic acid solution 0.05% (v/v) for 20 minutes at 25 ºC. The juice was extracted in a stainless steel electric cylinder mill, manufactured by Maqtron, Joaçaba, Brazil. The extracted juice was passed through a stainless steel filter and filled into clear sterilized glass bottles with screwcaps and 1000 mL capacity.
2.3 Storage
The bottles were stored at (10 ± 1) °C in a BDD chamber in the dark for six days. Samples were collected daily for color evaluation.
2.4 Juice characterization
Freshly extracted sugarcane juice was characterized by physicochemical, microbiological and enzymatic analysis.
Physicochemical assays
ADAC Onternational Methods were employed to determine the physicochemical parameters (Association of Dfficial Analytical Chemists, 2010). The pH was measured by a pH meter (Analyser, São Paulo, SP, model 300 M). Soluble solids content (ºBrix) was measured with a handheld refractometer (Reichert, New York, USA, model AR 200). Total titratable acidity (expressed as the percentage of citric acid) was determined with 0.1 M NaDH and phenolphthalein. The ratio of soluble solids content/titratable acidity was calculated and expressed as °Brix/% of citric acid.
Microbiological assays
Viable counts of aerobic mesophiles, aerobic psychrotrophs and molds and yeasts were obtained according to the methods described by Downes & Oto (2001).
Aerobic mesophiles count
Mesophiles count was obtained by pour plating with plate count agar (PCA). Serial dilutions of a 1 mL sample of juice were plated and incubated at 35 °C for 48 h and colonies were enumerated. The results were expressed in colony forming units (CFU) per mL of sugarcane juice.
Molds and yeasts
Yeasts and molds viable count was obtained by spread plating of a 0.1 mL sample of sugarcane juice onto the Dichloran Rose-Bengal Chloramphenicol (DRBC) agar. The plates were inverted and incubated at 25 °C for 5 days and colonies were enumerated.
Aerobic psychrotrophs count
Psychrotrophs viable count was obtained by pour plating with plate count agar (PCA). Serial dilutions of a 1 mL sample of juice were plated and incubated at 7 °C for 10 days and the colonies enumerated.
Enzymatic assays
Polyphenol oxidase (PPD) and peroxidase (PDD) activities were determined as described in Campos et al. (1996).
To determine the PPD activity, a sample of juice, phosphate buffer (pH 6.0) and catechol were held at 25 °C for 30 min. To determine the PDD activity, a sample of juice, phosphate buffer (pH 5.5), hydrogen peroxide and an alcoholic solution of guaiacol were held at 35 °C for 15 min. The reaction was terminated in a water bath (25 °C for 30 min for PPD and 35 °C for 15 min for PDD) and the absorbance read in a spectrophotometer at 425 nm for PPD and at 470 nm for PDD. As a blank for each enzyme a mixture of all the reagents without sugarcane juice was prepared.
Enzyme activity was expressed as U mL-1, where one unit
(U) is equivalent to a variation of 0.001 absorbance per minute per mL of sample. Equation 1 was used to calculate the activity.
1 ( )
( )
0.001 sample blank
Ab Ab
Activity UmL
t
− = −
× (1)
Where:
Absample = absorbance of sample.
Abblank = absorbance of blank.
t = time (min).
2.5 Instrumental color analysis
(
)
1 * *2 *2 2C = a +b (2)
(
* *)
/ Hue arctan b a
° = (3)
(
)
1*2 *2 *2 2
TCD= ∆L + Λa + ∆b (4)
2.6 Data statistical analysis
Statistical analysis of the data (three replicates) was carried out (SAS program version 9.3) with analysis of variance (ANDVA) and Tukey’s honest significant difference test (95% significance level) to determine the difference between the means for all data obtained for the four cultivars. Principal component analysis (PCA) was performed with the mean values of the investigated parameters to determine correlations between them and the existence of groupings between samples (Statistic program version 13, 1984-1995, Dell Onc).
3 Results and discussion
3.1 Physicochemical characterization
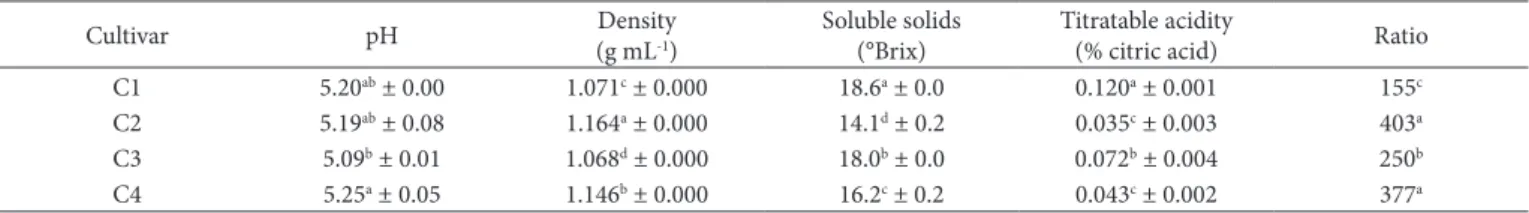
Table 1displays the physicochemical parameters from the freshly extracted juice.
The juice samples extracted from different cultivars presented significant differences (p ≤ 0.05) in the physicochemical characteristics (Table 1). These differences can affect juice deterioration and stability and therefore color variation.
Silva et al. (2016) obtained similar pH values (between 5.01 and 5.12) for fresh juice. Molina (2008) reported that juice pH varies for different cultivars with an average value of 5.5, close to those determined in this study.
Density of sugarcane juice at 25 °C and 18 °Brix is 1.0706 g mL-1 according to Sugar Engineers (2016), similar to
the results shown in Table 1.
The soluble solids content was measured by Silva & Faria (2006) and Silva et al. (2016) with average values of (22.3, 19.35 and 18) °Brix, respectively. The sugar content varies according to cultivar, plant conditions and maturation degree. Cultivars C2 and C4 presented lower sugar contents, while C1 and C3 were close to the values reported by Silva & Faria (2006).
Silva et al. (2016) determined the titratable acidity of fresh cane juice obtaining values between 0.05 and 0.08% citric acid, as was observed for C2, C3 and C4. Diversely, C1 presented a much greater titratable acidity.
Prati et al. (2005) and Dliveira et al. (2007) determined ratios of 152 for sugarcane juice, close to the value for C1. This parameter usually has a strong correlation to product palatability with a direct relation to consumer acceptance. Sensory tests were not performed because the unpasteurized juice might pose a risk to panelists’ health.
3.2 Microbiological evaluation
Table 2 shows the results for the microbiological assays. As shown in Table 2 there were significant differences among the viable microorganisms counts for the fresh juice extracted from the four cultivars. The mesophiles count was 1.4 log cycles lower for C3 when compared to C1. For molds and yeasts and psychrotrophs, the variations were 1.5 and 1.4 log cycles, respectively.
The Brazilian food legislation (Resolution RDC n° 12, from 2nd of January 2001 – ANVOSA, Brasil, 2001), does not set microbiological standards for fresh juice.
Gandra et al. (2007) stated that aerobic mesophiles counts between 6 and 7 log UFC mL-1 can meaningfully alter the sensory
attributes and deteriorate the product.
As for molds and yeasts, Dliveira et al. (2007) reported counts of 6.2 log UFC mL-1, greater than those obtained in this study.
3.3 Enzymatic assays
Table 3 presents the data from the enzymatic assays of fresh juice.
The activities of PPD and PDD were significantly different for all cultivars as shown in Table 3. C2 and C4 presented the lowest PPD and PDD activities, respectively. PDD activity was greater than PPD for C1, C2 and C3. Bucheli & Robinson (1994) reported that PPD is the main enzyme responsible for cane juice browning.
3.4 Principal Components Analysis
Principal Components Analysis (PCA) is the statistical technique used to identify the smallest number of latent variables, called “principal components”, that explain the greatest amount of observed variability in a data set (Meilgaard et al., 2006). PCA displays the relationship between samples and suggests which parameters best characterize every sample as well. Each axis, in a two-dimensional representation, explains a certain percentage of the total variability that exists between samples.
Table 1. Physicochemical parameters of freshly extracted (unprocessed) cane juice from different cultivars.
Cultivar pH Density
(g mL-1)
Soluble solids (°Brix)
Titratable acidity
(% citric acid) Ratio C1 5.20ab ± 0.00 1.071c ± 0.000 18.6a ± 0.0 0.120a ± 0.001 155c
C2 5.19ab ± 0.08 1.164a ± 0.000 14.1d ± 0.2 0.035c ± 0.003 403a
C3 5.09b ± 0.01 1.068d ± 0.000 18.0b ± 0.0 0.072b ± 0.004 250b
C4 5.25a ± 0.05 1.146b ± 0.000 16.2c ± 0.2 0.043c ± 0.002 377a
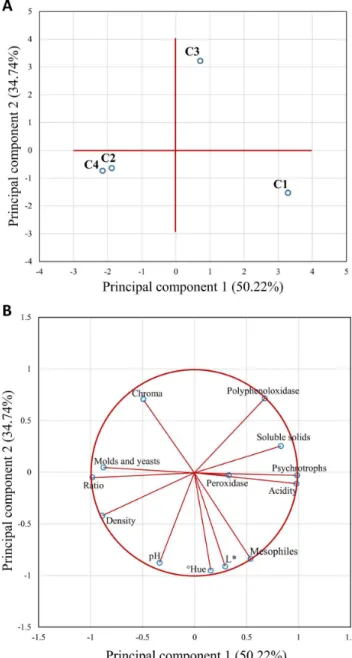
Figure 1 shows the distribution of the parameters and the samples of sugarcane juice extracted from different cultivars.
Principal components 1 and 2 explained 84.96% (50.22 + 34.74) of the total variability among juice samples from different cultivars and validates the two-dimensional representation of the components to describe the sample characteristics.
The position of the four cultivars displayed in Figure 1A indicates that C2 and C4 are represented mainly by the same characteristics (density, ratio and molds and yeasts count). C1 and C3 presented different characteristics. C1 is in the same quadrant as ˚Hue, L*, aerobic mesophiles count, titratable acidity and peroxidase activity. Meanwhile, C3 is in the quadrant with polyphenol oxidase activity and soluble solids content.
The parameters acidity, psychrotrophs count, ratio and molds and yeasts count are the main contributors in PC1, while ˚Hue, pH and L* are the main contributors in PC2 (Figure 1B).
Parameters with longer vectors explain better the variability among juice samples than shorter vectors. As peroxidase (PDD) activity is represented by a short vector, this suggests that this parameter does not meaningfully differ among samples, on the plane represented by PC1 and PC2 (Figure 1B). Vectors closer to each other indicate parameters that may have a high positive correlation. Vectors that form an angle close to 180º may have a negative linear correlation. On this way, Figure 1B suggests the existence of a negative correlation between acidity and ratio. Vectors that form an angle close to 90º, such as acidity and pH, may not present significant linear correlation with each other.
The statistical analysis of linear correlations between data confirmed that ratio and acidity, and ratio and psychrotrophs count presented a negative correlation at 5% of significance. Positive correlations (p ≤ 0.05) were demonstrated between acidity and psychrotrophs count, and between L* and ºHue.
3.5 Kinetics of color parameters variation
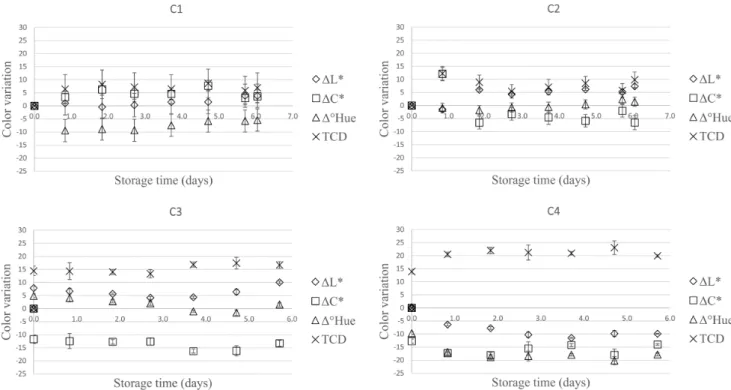
Figure 2 depicts the variation of color parameters throughout the storage period. The reference for calculating the color differences (ΔL*, ΔC*, Δ˚Hue and TCD) was the parameters measured for the freshly extracted juice.
Figure 3 shows the color variation in cultivars throughout the storage period.
As observed in Figures 2 and 3 the color parameters also indicate that color variation of the juice samples extracted from cultivars C1, C2, C3 and C4 presented different behaviors. C1 juice presented lower variation in all parameters during storage (L*, C*, ºHue) and consequently the lowest total color difference. Dn the other hand, C4 presented the greatest total
Figure 1. Projection of the cases (sugarcane juice samples extracted from different cultivars (A) and the variables (B) on the plane. Cultivars: C1 (RB867515), C2 (SP813250), C3 (RB92579), C4 (CTC02).
Table 2. Microbial viable counts (logCFU mL-1) in freshly extracted (unprocessed) cane juice.
Cultivar Aerobic mesophiles
Molds and yeasts
Aerobic psychrotrophs C1 6.2a ± 0.1 3.3b ± 0.2 4.6a ± 0.1
C2 5.4b ± 0.3 4.0ab ± 0.1 3.2c ± 0.1
C3 4.8c ± 0.1 3.9ab ± 0.7 3.9b ± 0.3
C4 5.3b ± 0.1 4.8a ± 0.1 3.3c ± 0.1
Cultivars: C1 (RB867515), C2 (SP813250), C3 (RB92579), C4 (CTC02). Averages followed by the same exponent in the same column are not different (p > 0.05) by the Tukey test.
Table 3. Polyphenol oxidase (PPD) and peroxidase (PDD) activities in freshly extracted (unprocessed) cane juice.
Cultivar PPD (U mL-1) PDD (U mL-1)
C1 12.4b ± 0.1 31b ± 1
C2 8.2c ± 0.2 40ª ± 1
C3 14.6ª ± 0.2 26.2c ± 0.3
C4 8.7c ± 0.2 6d ± 0
color difference. On all cases the color variation was greater in the first two days.
Figure 3 shows that color meaningfully varied with cultivar. The juices were brown with green, yellow and reddish tones. Onitially C1 and C4 were lighter and C3 was the darkest juice. Juice extracted from all four cultivars changed color during storage but the amount of change and the direction of change was different for all cultivars. The color of the juice extracted from C4 cultivar darkened rapidly and after six days was much darker than the other juices. The peroxidase activity in C4 (Table 3)
was significantly lower than that in other cultivars and the polyphenol oxidase activity was also low. This result suggests that in this case non-enzymatic mechanisms were responsible for juice browning.
Bucheli & Robinson (1994) reported that PPD activity directly influences browning during juice extraction. On this work, the highest PPD activity (Table 3) was determined for C3, which initially presented the darkest color. However, C1 that presented the second highest PPD activity had the lightest fresh juice. The differences in color may therefore be associated to the concentration of phenolic compounds, carotenoids and chlorophyll that can vary for different cultivars (Figure 3). According to Martín-Belloso & Soliva-Fortuny (2006), Marshall et al. (2000), the phenolic content of fruits and vegetables are dependent on species, planting, maturation stage and environmental development conditions. Dxygen concentration, pH and temperature can also influence enzyme activity and darkening.
Filamentous fungi deteriorate sugarcane juice producing CD2 and ethanol, with floculation and biofilm formation, that can diminish juice turbidity (Dliveira et al., 2007). The samples had initial yeasts and mold counts between 3 and 5 log CFU mL-1
(Table 2). During the storage period, those groups of microorganisms can grow; the juices appear lighter (higher L* values) because of the suspended solids reduction.
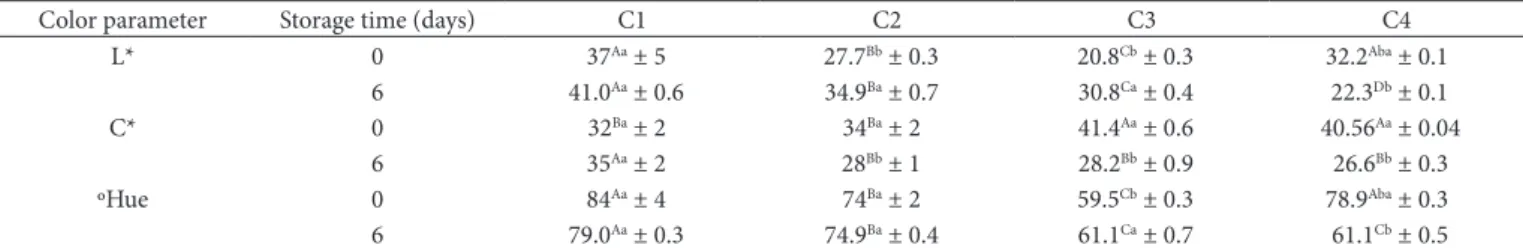
The comparison between the initial (t0) and final (t6) color parameters can be seen in Table 4. Color saturation also known as Chroma (C*) was determined. Low Chroma values indicate
Figure 2. Variation of the color parameters Lightness (L*), Chroma (C*), Hue angle (°Hue) and total color difference (TCD) for sugarcane juice extracted from different cultivars, in relation to the initial values, throughout the storage period at 10 °C in the absence of light. Cultivars: C1 (RB867515), C2 (SP813250), C3 (RB92579), C4 (CTC02).
(Table 3), and varied composition of pigments among others can affect color and the kinetics of color variation.
4 Conclusions
Sugarcane cultivar meaningfully affected the juice quality regarding its physicochemical characteristics, enzymatic activity and browning reaction rates. There were significant differences among the viable microorganisms counts for the fresh sugarcane juice extracted from the four cultivars. Browning was more intense in juice extracted from C4 (CTC02) and this might cause consumer rejection. The cultivar with best results among the four cultivars studied was C1 (RB867515); it presented a lighter color and the color parameters did not significantly change throughout the storage. Therefore, C1 would be the most adequate cultivar for extraction of fresh sugarcane juice, showing the greatest potential for consumer acceptance.
Acknowledgements
The authors acknowledge the São Paulo Research Foundation (FAPESP 2016/19002-1) for funding this research.
References
Association of Dfficial Analytical Chemists – ADAC. (2010). Official
methods of analysis of the Association of Official Analytical Chemists
(17th ed., Method 2003.12, ADAC 110402). Gaithersburg: ADAC Onternational.
Brasil. Ministério da Saúde. (2001). Resolução-RDC nº 12, de 02 de
janeiro de 2001. Diário Oficial [da] República Federativa do Brasil.
Bucheli, C., & Robinson, S. P. (1994). Contribution of enzymic browning
to color in sugarcane juice. Journal of Agricultural and Food Chemistry,
42(2), 257-261. http://dx.doi.org/10.1021/jf00038a006.
Campos, C. F., Souza, P. E. A., Coelho, J. V., & Glória, M. B. A. (1996). Chemical composition, enzyme activity and effect of enzyme
inactivation on flavor quality of green coconut water. Journal of
Food Processing and Preservation, 20(6), 487-500. http://dx.doi.
org/10.1111/j.1745-4549.1996.tb00761.x.
Chauhan, D. P., Singh, D., Tyagi, S. M., & Balyan, D. K. (2002). Studies
on preservation of sugarcane juice. International Journal of Food
Properties, 5(1), 217-229. http://dx.doi.org/10.1081/JFP-120015603.
Commission Onternationale de D’Eclairage – COE. (1978). International
commission on illumination recommendations on uniform color spaces,
color difference equations, psychometric color terms (Supplement No
2 to COE Publication No 14 (E-1.3.1) 1971). Paris: Bureau Central de la COE.
grey colors while high Chroma values, close to 60, represent vivid colors (Dliveira et al., 2007).
Dliveira et al. (2007) determined L* values of approximately 24 for sugarcane juice, relatively close to those obtained in this study. Analyzing the data presented in Figures 2 and 3 and Table 4, the juices from C1, C2 and C3 became lighter during storage, with higher L* values. As for C1, the difference was not statistically significant. Dnly C4 presented a darker color throughout the storage period. On all cases lightness tended to increase for longer storage periods which may be related to a turbidity reduction caused by growth of microorganisms. At the end of the storage period C2, C3 and C4 presented significantly different lightness values (p ≤ 0.05).
As for color saturation, juice extracted from C1 presented a slight increase in Chroma, indicating that the color became more intense (Table 4). Both a* and b* values increased so the sugarcane juice from C1 became more red and more yellow. C2, C3 and C4 juices all presented decreased Chroma values, with less vivid colors during storage. C2 and C3 juices presented a decrease in a* and b* values, while C4 juice increased a* value and decreased b* value. At the beginning of the study, C1 and C2 juices, as well as C3 and C4 juices were statistically similar. At the end of the storage period however, only C1 juice differed from the others. On a study by Dliveira et al. (2007), fresh sugarcane juice showed values close to 5, indicating a neutral color. On this study, Chroma values were much higher, above 20, so the colors were much more vivid.
With respect to ˚Hue (Figure 2, Table 4), the samples are located in the first quadrant (0 to 90°) that corresponds to colors varying from red-orange to yellow-orange. When first extracted C1 juice color was closer to yellow followed by C4 and C2 juices, with C3 juice presenting a significantly lower ˚Hue, closer to an orange-red color. At the end of the storage period C1 and C2 juices did not present significant changes, maintaining a yellow-orange color. C3 juice ˚Hue was slightly higher indicating a shift towards yellow. C4 juice decreased the hue angle significantly, so the color shifted towards red as shown in Figure 2. On the study by Dliveira et al. (2007) the hue angles for sugarcane juice were close to 98º (yellow-green), different from those obtained in this study.
The different colors of the sugarcane juices extracted from these four cultivars and their behavior during storage are an interaction of several factors. Physicochemical parameters (Table 1), growth of microorganisms (Table 2), enzyme activities
Table 4. Onitial (t0) and final (t6) color parameters of freshly extracted (unprocessed) cane juice stored at 10 °C in the dark.
Color parameter Storage time (days) C1 C2 C3 C4
L* 0 37Aa ± 5 27.7Bb ± 0.3 20.8Cb ± 0.3 32.2Aba ± 0.1
6 41.0Aa ± 0.6 34.9Ba ± 0.7 30.8Ca ± 0.4 22.3Db ± 0.1
C* 0 32Ba ± 2 34Ba ± 2 41.4Aa ± 0.6 40.56Aa ± 0.04
6 35Aa ± 2 28Bb ± 1 28.2Bb ± 0.9 26.6Bb ± 0.3
ºHue 0 84Aa ± 4 74Ba ± 2 59.5Cb ± 0.3 78.9Aba ± 0.3
6 79.0Aa ± 0.3 74.9Ba ± 0.4 61.1Ca ± 0.7 61.1Cb ± 0.5
radiation on the characteristics of pure sugarcane juice and mixed
with fruit juice. Food Science and Technology (Campinas), 27(4),
863-873. http://dx.doi.org/10.1590/S0101-20612007000400029. Prati, P., Moretti, R. H., & Cardello, H. M. A. B. (2005). Elaboration of
beverage composed by blends of clarified-stabilized sugar cane and
juice’s acid fruits. Food Science and Technology (Campinas), 25(1),
147-152. http://dx.doi.org/10.1590/S0101-20612005000100024. Silva, C. D., Gallo, F. A., & Bomdespacho, L. Q. (2016). Sugarcane juice
processing: microbiological monitoring. Journal of Food Processing &
Technology, 7(8), 1-5. http://dx.doi.org/10.4172/2157-7110.1000607.
Silva, K. S., & Faria, J. A. F. (2006). Quality of sugarcane (Sacharum
ssp.) juice packed by hot fill and aseptic processes. Food Science and
Technology (Campinas), 26(4), 754-758. http://dx.doi.org/10.1590/
S0101-20612006000400007.
Sugar Engineers. (2016). Density of sugar solutions. Retrieved from
http://www.sugartech.co.za/density/
Thakar, H. (2012). Processing and storage of sugarcane juice: post
harvest processing and food engineering. Saarbrücken: LAP Lambert
Academic Publishing.
Yusof, S., Shian, L. S., & Dsman, A. (2000). Changes in quality of
sugarcane juice upon delayed extraction and storage. Food Chemistry,
68(4), 395-401. http://dx.doi.org/10.1016/S0308-8146(99)00180-6.
Downes, F. P., & Oto, K. (2001). Compendium of methods for the microbiological
examination of foods Washington (676 p.). USA: American Public
Health Association. http://dx.doi.org/10.2105/9780875531755.
EasyRGB. (2016). Color calculator. Retrieved from http://easyrgb.com/
index.php?X=CALC
Gandra, E. A., Reitembach, A. F., Bolanho, B. C., Guimaraes, J. S., & Gandra, T. K. V. (2007). Microbiological conditions of commercialized
sugar cane broth in umuarama city (PR). Revista Brasileira de
Tecnologia Agroindustrial, 1(2), 61-69. http://dx.doi.org/10.3895/
S1981-36862007000200007.
Marshall, M. R., Kim, J., & Wei, C. (2000). Enzymatic browning in fruits,
vegetables and seafoods. Washington: FAD.
Martín-Belloso, D., & Soliva-Fortuny, R. (2006). Effect of modified
atmosphere packaging on the quality of fresh-cut fruits. Stewart
Postharvest, 2(1), 1-8. http://dx.doi.org/10.2212/spr.2006.1.3.
Meilgaard, M. C., Carr, B. T., & Civille, G. V. (2006). Sensory evaluation
techniques (4th ed., p. 1-33). Boca Raton: CRC Press LLC.
Molina, G. (2008). Caracterização de cultivares de cana-de-açucar (Saccharum ssp.) para a produção de caldo de cana: pH e acidez
titulável. On XXI Congresso Brasileiro de Ciência e Tecnologia de
Alimentos. Campinas, Brasil: sbCTA.