i i
“main” — 2015/3/10 — 12:26 — page 371 — #1
i i
Revista Brasileira de Geof´ısica (2014) 32(3): 371-381 © 2014 Sociedade Brasileira de Geof´ısica ISSN 0102-261X
www.scielo.br/rbg
OCEANIC INDICES AND THEIR RELATIONS WITH THE MONTHLY PRECIPITATION
IN RIO GRANDE DO SUL STATE, BRAZIL
Eliane Barbosa Santos
1and Gilberto Barbosa Diniz
2ABSTRACT.Climatic indices were obtained from the Sea Surface Temperature (SST) in the Atlantic and Pacific oceans, available on the website of the Earth System Research Laboratory (ESRL), which belongs to the Physical Science Division (PSD) of the National Oceanic and Atmospheric Administration (NOAA). These indices were created to represent the variations of SST in the Southwest Atlantic, Equatorial Pacific and South Pacific, with the aim of studying their influence on precip-itation variability in the state of Rio Grande do Sul (RS), Brazil. The precipprecip-itation dataset was obtained from the National Institute of Meteorology – Instituto Nacional de Meteorologia (INMET – 8◦Distrito de Meteorologia – Porto Alegre) and State Foundation for Agricultural Research – Fundac¸˜ao Estadual de Pesquisas Agropecu´arias (FEPAGRO). Afterwards, there were made cross-correlations between the indices, and correlations between the indices and the precipitations of the RS for the period 1948-2009. The precipitation correlations were simultaneous and lagged, with the indices preceding the precipitation up to 2 months, to determine the predictive power of the indices, and estimate the evolution of this variable in the spatiotemporal domain. The index of the Southwest Atlantic SST was not significant for the precipitation of RS in the months from November to February. The highest degree of association between the indices of the Equatorial Pacific and South Pacific with precipitation were found in November. In general, it was observed that the significant coefficients in the simultaneous correlations remained until lag 2, i.e., the SST in the Equatorial Pacific and South Pacific can be good predictors of the rain quality for the state of the RS, up to 2 months in advance.
Keywords: Equatorial Pacific, South Pacific, Southwest Atlantic, correlation analysis.
RESUMO.Foram determinados ´ındices clim´aticos obtidos da Temperatura da Superf´ıcie do Mar (TSM) nos oceanos Atlˆantico e Pac´ıfico, dispon´ıveis na p´agina da internet do Earth System Research Laboratory (ESRL), pertencente `a Physical Science Division (PSD) da National Oceanic and Atmospheric Administration (NOAA). Esses ´ındices foram criados para representar as variac¸˜oes de TSM no Atlˆantico Sudoeste e Pac´ıfico Equatorial e Sul, com o objetivo de estudar suas influˆencias na variabilidade da precipitac¸˜ao do Estado do Rio Grande do Sul (RS). Os dados de precipitac¸˜ao foram obtidos do Instituto Nacional de Meteorologia (INMET, 8◦Distrito de Meteorologia – Porto Alegre) e Fundac¸˜ao Estadual de Pesquisas Agropecu´arias (FEPAGRO). Posteriormente, foram realizadas correlac¸˜oes cruzadas entre os ´ındices, e correlac¸˜oes entre os ´ındices e as precipitac¸˜oes do RS para o per´ıodo de 1948-2009. As correlac¸˜oes com as precipitac¸˜oes foram simultˆaneas e com defasagem, com os ´ındices precedendo a precipitac¸˜ao em at´e 2 meses, para determinar o car´ater preditivo do ´ındice em quest˜ao, e estimar a evoluc¸˜ao dessa vari´avel no dom´ınio espac¸o-temporal. O ´ındice das TSM do Atlˆantico Sudoeste n˜ao foi significativo para as precipitac¸˜oes do RS nos meses de novembro a fevereiro. O maior grau de associac¸˜ao entre os ´ındices do Pac´ıfico Equatorial e Sul com as precipitac¸˜oes foi encontrado em novembro. No geral, foi observado que os coeficientes significativos nas correlac¸˜oes simultˆaneas, permaneceram at´e o lag 2, ou seja, as TSM do Pac´ıfico Equatorial e Sul podem ser bons previsores da qualidade da chuva para o Estado do RS, com at´e 2 meses de antecedˆencia.
Palavras-chave: Pac´ıfico Equatorial, Pac´ıfico Sul, Atlˆantico Sudoeste, an´alise de correlac¸˜ao.
1Universidade Federal do Rio Grande do Norte, Post-graduate Program on Climate Sciences, Campus Universit´ario Lagoa Nova, P.O. Box 1524, 59078-970 Natal, RN, Brazil. Phone: +55(84) 3342-2479 – E-mail: [email protected]
2Universidade Federal de Pelotas, Department of Meteorology, Campus Universit´ario, P.O. Box 354, 96010-900 Pelotas, RS, Brazil. Phone/Fax: +55(53) 3277-6767 – E-mail: [email protected]
INTRODUCTION
The pluvial precipitation variability is considered one of the greatest risks for agriculture in the state of Rio Grande do Sul (RS), as a whole set of activities is closely associated to the plu-vial regime and these activities are severely affected by extreme events, like droughts or floods. The pluvial precipitation average values in RS present regularities along the year, but large vari-ations along them. Berlato et al. (1995) and ´Avila et al. (1996) showed that there is a large interannual variability of this variable which becomes the main limitative factor of the Spring-Summer cultures that represent about 90% of the entire grain production of RS.
To study the precipitation variability, it should be considered the ocean influence, which is a determining role for the sensible and latent heat flows, as these are the flows that provide humidity and heat for the atmosphere and are essential for the convection and precipitation patterns (Tao & Simpson, 1991). Many recent studies provided evidences that the Atlantic and Pacific oceans play a significant role on the climatic fluctuations that occur in the South region of Brazil (Diaz et al., 1998; Grimm et al., 1998, 2000; Cardoso & Silva Dias, 2004; Firpo, 2012). However, it is still little known about how both ocean influences are developed and how they can be explored to improve the climatic prognostic.
In this context, one of the most important variability scales is the interannual. Most of the atmosphere variability is related to the tropical oceans and the most important mode of the in-terannual variability of the ocean atmosphere system is the El Ni˜no-Southern Oscillation (ENSO) (Kayano & Andreoli, 2007). The ENSO phenomenon effects are observed in global scale and mainly alter the pluviometric and thermic regime in many regions of the world (Ropelewski & Halpert, 1987; Kiladis & Diaz, 1989), including RS, with a strong signal (Firpo, 2012).
The ENSO is an oceanic-atmospheric phenomenon that, when the ocean interacts with the atmosphere, modifies the field of atmospheric pressure at sea level and the wind field over the Equatorial Pacific, changing their patterns in the regional and global scales. The oceanic component is characterized by the Sea Surface Temperature (SST) change in the Equatorial region of the Pacific Ocean and presents two distinctive phases, called El Ni˜no and La Ni˜na.
Besides ENSO, other SST patterns also affect the climate variability in RS. In this context, it is noteworthy the importance of the Atlantic, specially the Southwest Atlantic (SWA). The SWA stands out for the proximity to the RS state, extending along its east coast and being the route of the transient systems that af-fect it (Pezzi et al., 2009). It is also one of the most energetic ocean zones (Pezzi & Souza, 2009) as it is a cyclogenetic region
(Gan & Rao, 1991), where the Brazil-Malvinas confluence occurs (Gordon, 1989), and an area where there is the presence of the South Atlantic Convergence Zone (SACZ) (Kousky, 1988).
According to Diaz et al. (1998), SST positive (negative) anomalies in the SWA are associated to precipitation positive (negative) anomalies in the extreme south of Brazil and Uruguay. However, Haylock et al. (2006) suggested that the SWA SST do not present a direct relation to the precipitation extreme events occurred over South America and Brazil.
The Equatorial Pacific SST during La Ni˜na events, regardless the year season, are significantly associated to the SST below the normal in the SWA. During El Ni˜no events, significantly in-fluences with temperatures above the normal in the SWA were observed in Summer (simultaneous) and in Autumn (1 quarter lagged) (Silva, 2001).
Soppa et al. (2011) observed ENSO influences over the ther-mic oscillations in the SWA. The results indicate a statistically expressive time lagged correlation between ENSO and thermal anomalies in the SWA, but without a direct association between El Ni˜no (La Ni˜na) warm (cold) events and positive (negative) SST anomalies. In general, the ENSO warm phase may cause an ex-cess of precipitation in RS, and the opposite is expected during the ENSO cold phase. Grimm et al. (1998, 2000) showed that the El Ni˜no and La Ni˜na events significantly influence the seasonal pre-cipitation in the south region of Brazil, specially during the Spring and Autumn months, and, in the year after the ENSO warm events, the precipitation anomalies may be influenced by the SWA SST.
The South Pacific SST may also affect the precipitation in RS. According Cardoso (2005), the South Pacific SST anomalies, in the South Pacific Convergence Zone (SPCZ) region, may act as forcing and directly affect the precipitation regimes in the South and Southeast of Brazil.
The precipitation behavior analysis may help in the diagnosis of extreme precipitation events and contribute to a better strate-gic planning; minimizing then the risk of occurring loses, espe-cially in the productive sector (particularly those related to agri-culture, generation and distribution of electric power industry). Thus, the purpose of this paper is to study the influence of indices obtained from the Pacific and Atlantic ocean SST in the pluvial precipitation variability in the state of the RS and to analyze the possibility of the pluvial precipitation predictability with some months in advance.
METHODOLOGY Datasets
The monthly precipitation dataset was obtained from the National Institute of Meteorology – Instituto Nacional de Meteorologia
i i
“main” — 2015/3/10 — 12:26 — page 373 — #3
i i
SANTOS EB & DINIZ GB
373
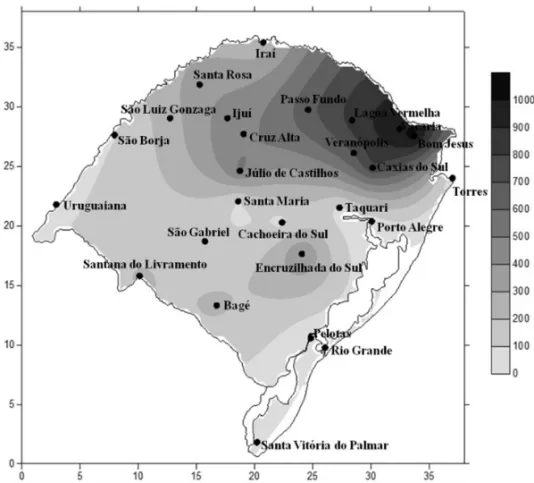
Figure 1 – Spatial distribution and altitude (grey scale) of the meteorological stations of the state of the RS used in this paper.
(INMET – 8◦Distrito de Meteorologia – Porto Alegre) and State Foundation for Agricultural Research – Fundac¸˜ao Estadual de Pesquisas Agropecu´arias (FEPAGRO). These data are consistent and the failures were filled up using statistical techniques, accord-ing to the methodology proposed by Diniz (2002). It was used as a criterion to choice the stations, the availability and uniformity of long time series data, in the corresponding period from 1948 to 2009. As a result, 26 stations were selected (Fig. 1), distributed in the state of the RS.
Besides the precipitation dataset, the SST data, spaced in a 2.0◦× 2.0◦grid, were used for both oceans, Atlantic and Pacific. These data are available at the site of the Earth System Research Laboratory (ESRL), which belongs to the Physical Science Divi-sion (PSD) of the National Oceanic and Atmospheric Administra-tion (NOAA).
Methods
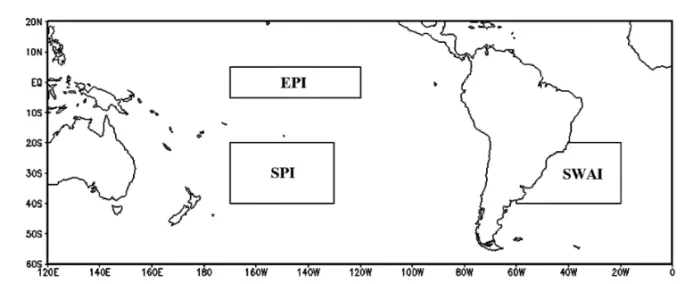
To represent the variations of SST in the Southwest Atlantic, Equatorial Pacific and South Pacific, SST monthly indices were determined. Figure 2 shows the regions obtained for the indices calculus.
Southwest Atlantic Index (SWAI): it was calculated using the Southwest Atlantic region between 20◦S to 40◦S and 20◦W to 60◦W. This region was chosen based on the regions used in
previous papers (Sansigolo et al., 2004; Cardoso, 2005; Pezzi et al., 2009; Firpo, 2012).
Equatorial Pacific Index (EPI): the most used region for re-search and monitoring of the Equatorial Pacific SST is the Ni˜no 3.4 region (Bunge & Clarke, 2009). Ni˜no 3.4 is, in general, cho-sen due to, in this region, the SST variability possesses a strong effect on the displacement of the Western Pacific precipitation which in turn modifies the location of the heating source that controls/modulates the general atmospheric circulation. Thus, the index was obtained in the region corresponding to Ni˜no 3.4, between 5◦S to 5◦N and 120◦W to 170◦W.
South Pacific Index (SPI): it was determined using the South Pacific region between 20◦S to 40◦S and 130◦W to 170◦W, the area corresponding to SPCZ (Barros & Silvestri, 2002; Firpo, 2012).
The indices were elaborated for the 1948 to 2009 period, cal-culating the average and the standard deviation of the SST series of each region. These deviations were standardized and consti-tuted index time series, that is, to determine the indices it was used the formula:
SI = xij− xj
sj (1)
where: SI = standardized index, xij = the value found for a given year (i) and month (j), xj= the average value for a given month (j) and sj= standard deviation for a given month (j).
Figure 2 – Spatial domain of the used data, indicating the SST time series regions for the index calculus.
To verify the possibility of trend occurrence in the studied time series (indices obtained from the SST and the precipitation series), it was used the Mann-Kendall (MK) non-parametric sta-tistical test, according to the methodology proposed by Sneyers (1992). Goossens & Berger (1986) assert that the Mann-Kendall test is the most appropriate method to analyze the climate changes in climatologic series. However, it is needed to highlight that the significative presence of seasonalities or autocorrelations affects the sensitivity of this method (Hamed & Rao, 1998; Bayazit & ¨On¨oz, 2007). The presence of these two factors amplify the prob-ability of detecting false increasing trends (Blain, 2010).
The MK test considers that, in case of a time series stability, the value succession occurs independently, and the probability distribution must always remain the same (random and simple). Among the benefits of using this method, it is the capacity to iden-tify the trend direction and starting point. Besides, the data do not need to belong to a specific distribution, and its result is not af-fected by extreme values, since the calculus is based on the sig-nal and not on the difference values of the test variable ( ¨On¨oz & Bayazit, 2003).
The time series randomness was evaluated by the non-test of sequences of adherence to the normal distribution, called runs tests, which checks whether the elements of the series are inde-pendent of each other. Was adopted a 5% significance level for the test. The non rejected series in these tests were submitted to the MK test. For the rejected series in the Runs Tests, it was used the Seazonal Mann-Kendall (SMK) test, the method proposed by Hirsch et al. (1982) and Hirsch & Slack (1984) with the purpose to adapt the MK for autocorrelated series, as well as to deal with difficulties imposed by possible seasonalities.
Considering the 5% significance level, significative trends were removed from the time series, making successive differences of the original series.
To verify the dependence between the Pacific and Atlantic ocean SST, simultaneous and lagged correlations, among the SST indices, were performed. The SST indices were also used to obtain the monthly correlation with the standardized precipitation of the 26 meteorological stations of RS, in the months from November to February, which are considered important months for the grain production in RS. These climatic indices were correlated with the precipitation in the same months, that is, with lag 0, the Novem-ber pluvial precipitation with the NovemNovem-ber index and so on for the other months. These simultaneous analyses are valid to identify areas in the region that present greater relation with the index, but do not indicate a pluvial predictability in these months. For this reason, correlations with lags were also analyzed, with indices up to 2 months ahead, i.e., preceding the precipitation, since an as-pect that there is not a general agreement yet is which lag time, or lag, would be in the response that the precipitation would present, if it occurs SST changes in the Pacific and/or Atlantic.
For the correlation calculus, it was used the Pearson correla-tion method, known as ordinary correlacorrela-tion or linear correlacorrela-tion, which is a simple and efficient tool to estimate the relationship ranking among any variables.
The correlation coefficient significance level was defined us-ing the Student’s t test.
RESULTS AND DISCUSSION
In the study of the precipitation series of the 26 used station, the trend (positive) was significant (at 5% level) for 15. For the series of the indices obtained from the SST, all of them showed signifi-cant trends (positive).
After removing the trends, the time series were used to obtain relations among them. To show the relation between the SST of the Pacific and Atlantic oceans, cross correlations among the in-dices (SWAI, EPI and SPI) were performed. In Figure 3 it can be
i i
“main” — 2015/3/10 — 12:26 — page 375 — #5
i i
SANTOS EB & DINIZ GB
375
Figure 3 – Cross-correlation among the indices: (a) SPI and SWAI; (b) EPI and SWAI; and (c) EPI and SPI.
noticed that the SWAI showed low coefficients with the EPI and SPI indices. Its values in the simultaneous and lagged correla-tions were about –0.1 to 0.17. The indices that showed greater coefficients of simultaneous and lagged correlation were the EPI and SPI. In the first EPI and SPI correlations with lags (lag –4 to lag 10), the values were negative, showing an inverse relation among the indices, that is, the Equatorial Pacific SST anomalies were positive (negative) when the South Pacific SST anomalies were negative (positive).
In the positive lags, the EPI is lagged in relation to the SPI and its highest coefficient was about –0.49 in the lags 2, 3 and 4. In the negative lags, the EPI is ahead in relation to the SPI and its highest coefficient was about 0.29 in lags –10 and –11.
In Figures 4, 5 and 6 there is a spatial distribution of the correlation coefficients, among the precipitations and the SWAI, EPI and SPI indices, respectively. The shade highlights, through Student’s t test, the regions with statistically expressive correla-tions, at 5% significance level.
Although the SWAI represents a region near the state of the RS and is also the route of the transient systems that affect it (Pezzi et al., 2009), it was not representative for the precipitations in RS in the months from November to February, showing few significant coefficients (Fig. 4). The best results were found in the simultaneous correlations in December and January.
In the correlations of the precipitation series with the EPI (Fig. 5), the significant coefficients found in the simultaneous correlations remained until lag 2. All significant coefficients were positive, indicating that SST anomalies in the IPE influence the precipitation in RS in a direct way. As the EPI values are in Ni˜no 3.4 region, then the EPI positive and negative values are, in gen-eral, indicators of the occurrence of El Ni˜no and La Ni˜na events, respectively, attesting, in principle, that it rained more (less) in El Ni˜no (La Ni˜na) years in this regions.
For agriculture in RS, El Ni˜no and La Ni˜na winds, besides losses, may cause benefits. Berlato et al. (2005) found a strong trend of El Ni˜no to favor the corn cultivation, promoting high
Figure 4 – Correlation between the monthly precipitation of the state of the RS and the SWAI, for the months from November to February, with lags from 0 up to
i i
“main” — 2015/3/10 — 12:26 — page 377 — #7
i i
SANTOS EB & DINIZ GB
377
Figure 5 – Correlation between the monthly precipitation of the state of the RS and the EPI, for the months from November to February, with lags from 0 up to 2
Figure 6 – Correlation between the monthly precipitation of the state of the RS and the SPI, for the months from November to February, with lags from 0 up to 2
i i
“main” — 2015/3/10 — 12:26 — page 379 — #9
i i
SANTOS EB & DINIZ GB
379
productivity, and, in La Ni˜na years, found high frequency of lowproductivity. In El Ni˜no occurrence, in general, the Summer cul-tures (soya and corn, particularly) are benefitted, because there are not water shortages (Cunha, 1999). Thus, the significative co-efficients found in the correlations between the RS precipitations and the EPI (Fig. 5) are important for handling many cultivations. Although the ENSO influence occurs during all period of these event action, there are periods in the year that are more af-fected by the ENSO phases, and the beginning of Summer (Oc-tober, November and December) is one of them. November was the month that presented the best results of the correlations be-tween the precipitations and the EPI, and 1% significative val-ues were found in almost all RS regions. These results are in ac-cord with Lopes et al. (2007) that found the greatest coefficients of correlation among the precipitations in the state of the RS and the Ni˜nos region SST and the ENSO multivariate index, in October-November and November-December quarters.
Among the four studied months, January was the sole month that did not present any region with significative coefficients, in the simultaneous correlations of the EPI with precipitation, as well as in the lagged correlations of the EPI with precipitation.
Like the correlations performed with the EPI, the SPI also pre-sented its greatest coefficients in November (Fig. 6). The signifi-cant coefficients in November were negative in the simultaneous and lagged correlations, that is, the South Pacific SST anomalies were positive (negative) when the precipitation anomalies were negative (positive). As the EPI and SPI indices showed a signi-ficative inverse relation, and the EPI is very representative for the precipitation of RS in November, it was already expected that in November the correlations between the SPI and the precipitations were negative.
The IPS was defined using the area corresponding to SPCZ. This Convergence Zone occurs during the ENSO cold (La Ni˜na) and neutral phases, and in the warm phase (El Ni˜no) this con-vergence zone disappears, i.e., in the simultaneous occurrence of the La Ni˜na and South Pacific positive anomalies, the possibilities of occurring negative anomalies precipitation increase.
In the other months (December, January and February), the IPS with precipitation correlation showed significant coefficients in small regions, and these regions expanded with the lag in-crease. In December and February, all correlation values were negative, however, in January, regions with significant positive coefficients were found.
The results found in the correlations between the precipita-tions and the SPI attest the results of Cardoso (2005), that the South Pacific SST anomalies may affect the precipitation regime in the state of the RS.
CONCLUSIONS
The simultaneous and with lag correlations among the indices obtained from the SST indicate that there is a dependence re-lation between the patterns of the Equatorial Pacific and South Pacific SST.
In the correlations between the SST indices and the state of the RS precipitation, the lowest correlation coefficients were found in the SWAI. This index presented few significative coef-ficients, and it is not representative for RS precipitation in the months from November to February in simultaneous and up 2 month lagged correlations. However, this index may be represen-tative in other months and/or in correlations with greater lags.
Among the four studied months, November was the month that showed the greatest correlation coefficients with the IPE and IPS, that is, the precipitation in RS seems to have the highest degree of association with the Pacific anomalies in November.
The SST variations in the Equatorial and South Pacific ocean produce noticeable impacts in the precipitation of RS, showing correlations that exceed the confidence level of 95 and 99% in many regions.
The EPI and SPI indices may be good predictors of the rain quality for the state of the RS, with up to 2 months in advance. And any index that is representative of the SST variations may be used like a potential predictor.
The found results may serve to reduce losses or to improve the use of favorable climatic conditions for handling many cultures. It is worth noting that the SST anomaly impacts over agriculture depend on the kind of culture.
REFERENCES
AVILA AMH, BERLATO MA, SILVA JB & FONTANA DC. 1996. Probabi-lidade de ocorrˆencia de precipitac¸˜ao pluvial mensal igual ou maior que a evapotranspirac¸˜ao potencial para a estac¸˜ao de crescimento das cul-turas de primavera-ver˜ao no Estado do Rio Grande do Sul. Pesquisa Agropecu´aria Ga´ucha, Porto Alegre – RS, 2(2): 149–154.
BARROS VR & SILVESTRI GE. 2002. The relation between sea surface temperature at the subtropical south-central Pacific and precipitation in southeastern South America. J. Climate, 15(3): 251–267.
BAYAZIT M & ¨ON ¨OZ B. 2007. To prewhiten or not to prewhiten in trend analysis? Hydrol. Sci. J., 52(4): 611–624, doi: 10.1623/hysj.52.4.611. BERLATO MA, FONTANA DC & BONO L. 1995. Tendˆencia temporal da precipitac¸˜ao pluvial anual no Estado do Rio Grande do Sul. Rev. Bras. Agrometeorologia, Santa Maria – RS, 3: 111–113.
BERLATO MA, FARENZENA H & FONTANA DC. 2005. Associac¸˜ao en-tre El Ni˜no oscilac¸˜ao Sul e a produtividade de milho no Estado do Rio Grande do Sul. Pesquisa Agropecu´aria Brasileira, 40: 423–432.
BLAIN GC. 2010. Detecc¸˜ao de tendˆencias mon´otonas em s´eries mensais de precipitac¸˜ao pluvial do estado de S˜ao Paulo. Bragantia, Campinas – SP, 69(4): 1027–1033.
BUNGE LA & CLARKE J. 2009. A verified estimation of the El Ni˜no index Ni˜no-3.4 since 1877. J. Climate, 22: 3979–3992.
CARDOSO AO. 2005. Relac¸˜oes entre a TSM nos oceanos Atlˆantico e Pac´ıfico e as condic¸˜oes clim´aticas nas Regi˜oes Sul e Sudeste do Brasil. Doctorate thesis on Meteorology, Instituto de Astronomia Geof´ısica e Ciˆencias Atmosf´ericas, Universidade de S˜ao Paulo, USP, S˜ao Paulo – SP, Brazil, 158 pp.
CARDOSO AO & SILVA DIAS PL. 2004. Identificac¸˜ao de trimestres ex-tremos no regime Pluviom´etrico do Sul e Sudeste do Brasil e relac¸˜ao com anomalias de TSM. Rev. Bras. Meteorol., 19(1): 149–162.
CUNHA GR. 1999. El Ni˜no – Oscilac¸˜ao Sul e perspectivas clim´aticas aplicadas no manejo de culturas no Sul do Brasil. Rev. Bras. Agromete-orologia, Santa Maria – RS, 7(2): 277–284.
DIAZ AF, STUDZINSKI CD & MECHOSO CR. 1998. Relationships be-tween precipitation anomalies in Uruguay and southern Brazil and sea surface temperature in the Pacific and Atlantic oceans. J. Climate, 11(2): 251–271.
DINIZ GB. 2002. Preditores visando `a obtenc¸˜ao de um modelo de pre-vis˜ao clim´atica de temperaturas m´axima e m´ınima para regi˜oes ho-mogˆeneas do Rio Grande do Sul. Doctorate thesis on Agrometeorology, Post-graduate Program on Phytotechnics, Universidade Federal do Rio Grande do Sul, UFRGS, Porto Alegre – RS, Brazil, 196 pp.
FIRPO MAF. 2012. Influˆencia Remota da TSM dos Oceanos Pac´ıfico e Atlˆantico e da Oscilac¸˜ao Ant´artica na Variabilidade Clim´atica interanual no Rio Grande do Sul e suas inter-relac¸˜oes. Doctorate thesis on Meteo-rology, Instituto Nacional de Pesquisas Espaciais, S˜ao Jos´e dos Campos – SP, Brazil, 200 pp.
GAN MA & RAO VB. 1991. Surface Cyclogenesis over South America. Mon. Weather Rev., 119(5): 1293–1302, doi:
10.1175/1520-0493(1991)119<1293:SCOSA>2.0.CO;2.
GOOSSENS CH & BERGER A. 1986. Annual and Seasonal Climatic Variation over the Northern Hemisphere and Europe during the Last Century. Ann. Geophys., 4: 385–400.
GORDON AL. 1989. Brazil-Malvinas Confluence– 1984. Deep Sea Res., 36(3): 359–405.
GRIMM AM, FERRAZ SET & GOMES J. 1998. Precipitation anomalies in Southern Brazil associated with El Ni˜no and La Ni˜na events. J. Climate, 11(11): 2863–2880, doi:
10.1175/1520-0442(1998)011<2863:PAISBA>2.0.CO;2.
GRIMM AM, BARROS VR & DOYLE ME. 2000. Climate variability in Southern South America associated with El Ni˜no and La Ni˜na events.
J. Climate, 13: 35–58, doi:
10.1175/1520-0442(2000)013<0035:CVISSA>2.0.CO;2.
HAMED KH & RAO AR. 1998. A modified Mann-Kendall trend test for autocorrelated data. J. Hydrol., 204: 182–196, doi: 10.1016/S0022-1694(97)00125-X.
HAYLOCK MR, PETERSON TC, ALVES LM, AMBRIZZI T, ANUNCIAC¸˜AO YMT, BAEZ J, BARROS VR, BERLATO MA, BIDEGAIN M, CORONEL G, CORRADI V, GARCIA VJ, GRIMM AM, KAROLY D, MARENGO JA, MARINO MB, MONCUNILL DF, NECHET D, QUINTANA J, REBELLO E, RUSTICUCCI M, SANTOS JL, TREBEJO I & VINCENT LA. 2006. Trends in Total and Extreme South American Rainfall in 1960-2000 and Links with Sea Surface Temperature. J. Climate, 19: 1490–1512, doi: 10.1175/JCLI3695.1.
HIRSCH RM & SLACK JR. 1984. A nonparametric trend test for seasonal data with serial dependence. Water Resour. Res., 20(6): 727–732, doi: 10.1029/WR020i006p00727.
HIRSCH RM, SLACK JR & SMITH RA. 1982. Techniques of trend analy-sis for monthly water quality data. Water Resour. Res., 18(1): 107–121, doi: 10.1029/WR018i001p00107.
KAYANO MT & ANDREOLI RV. 2007. Relations of South American sum-mer rainfall interannual variations with the Pacific Decadal Oscillation. Int. J. Climatol., 27: 531–540, doi: 10.1002/joc.1417.
KILADIS GN & DIAZ HF. 1989. Global climate anomalies associated with extremes in the Southern Oscillation. J. Climate, 2: 1069–1090, doi: 10.1175/1520-0442(1989)002<1069:GCAAWE>2.0.CO;2. KOUSKY VE. 1988. Pentad outgoing longwave radiation climatology for the South American sector. Rev. Bras. Meteorol., 3: 217–231. LOPES FZ, DINIZ GB & MARQUES JR. 2007. Relac¸˜ao entre o Multivari-ate Enso Index (MEI) e a TSM das Regi˜oes dos Ni˜nos com a Precipitac¸˜ao em Regi˜oes Homogˆeneas do Estado do Rio Grande do Sul. Anu´ario do Instituto de Geociˆencias – UFRJ, 30(2): 11–22.
¨ON¨OZ B & BAYAZIT M. 2003. The Power of Statistical Tests for Trend Detection. Turk. J. Eng. Environ. Sci., 27: 247–251.
PEZZI LP & SOUZA RB. 2009. Variabilidade de Mesoescala e interac¸˜ao oceano-atmosfera no Atlˆantico Sudoeste. In: CAVALCANTI IFA, FER-REIRA NJ, JUSTI DA SILVA MGA & SILVA DIAS MAF. Tempo e Clima no Brasil. S˜ao Paulo: Ed. Oficina de Textos, Cap. 24: 387–405. PEZZI LP, SOUZA RB, ACEVEDO O, WAINER I, MATA MM, GARCIA CAE & CAMARGO R. 2009. Multiyear measurements of the Oceanic and Atmospheric Boundary Layers at the Brazil-Malvinas Confluence Region. J. Geophys. Res., 114, D19103, doi: 10.1029/2008JD011379. ROPELEWSKI CF & HALPERT MS. 1987. Global and regional scale precipitation patterns associated with the El Ni˜no/Southern Oscillation. Mon. Weather Rev., 115: 1606–1626, doi:
i i
“main” — 2015/3/10 — 12:26 — page 381 — #11
i i
SANTOS EB & DINIZ GB
381
SANSIGOLO CA, PEREIRA CS & SILVA IR. 2004. Relac¸˜oes entre as precipitac¸˜oes regionais no Sul do Brasil e as temperaturas da superf´ıcie dos oceanos Atlˆantico e Pac´ıfico. Rev. Bras. Meteorol., 19(1): 5–11. SILVA IR. 2001. Variabilidade sazonal e interanual das precipitac¸˜oes na regi˜ao Sul do Brasil associadas `as temperaturas dos oceanos Atlˆantico e Pac´ıfico. Master dissertation on Meteorology, Instituto Nacional de Pesquisas Espaciais, S˜ao Jos´e dos Campos – SP, 98 pp.
SNEYERS R. 1992. On the use of Statistical Analysis for the Objective
Determination of Climatic Change. Meteorol. Zeitschrift. 1: 247–256. SOPPA MA, SOUZA RB & PEZZI LP. 2011. Variabilidade das anomalias de temperatura da superf´ıcie do mar no Oceano Atlˆantico sudoeste e sua relac¸˜ao com o fenˆomeno El Ni˜no-Oscilac¸˜ao Sul. Rev. Bras. Meteorol., 26(3): 375–391.
TAO WK & SIMPSON J. 1991. Numerical simulation of a subtropical squall line over Taiwan Strait. Mon. Weather Rev., 119: 2699–2723.
Recebido em 13 setembro, 2012 / Aceito em 21 agosto, 2014 Received on September 13, 2012 / Accepted on August 21, 2014
NOTES ABOUT THE AUTHORS
Eliane Barbosa Santos. Bachelor degree in Meteorology at Universidade Federal de Alagoas, UFAL (2005-2008), Master degree in Meteorology at Universidade
Federal de Pelotas, UFPel (2009-2010). Currently, is a Ph.D. student in Climate Sciences at Universidade Federal do Rio Grande do Norte, UFRN. Has experience in Geosciences with emphasis on Climatology, Statistical Climatology and Extreme Rainfall.
Gilberto Barbosa Diniz. Bachelor degree in Meteorology at Universidade Federal da Para´ıba, UFPB (1979), Master degree in Meteorology at UFPB (1994), Doctorate
degree in Agrometeorology at Universidade Federal do Rio Grande do Sul, UFRGS (2002). Associated professor IV of the undergratuate and post-graduate courses at Department of Meteorology, Universidade Federal de Pelotas, UFPel. Has experience in Geosciences with emphasis on Climatology, Statistical Climatology and Physical Meteorology.