Diagnostic evaluation of needs in an
environmental education center through data
multiple triangulation
Clemente Rodríguez-Sabiote
1 ORCID: http://orcid.org/0000-0003-3094-9199Abstract
In this paper we try to show the importance involved implement needs assessment processes in order to establish prioritization of claims collected from the implementation of data multiple analytical triangulation processes. The experience has taken as a case study an environmental education center in the province of Granada (Spain) where it will develop an intervention program with people with sensory disabilities. The results obtained and validated with the multiple analytical triangulation strategy has favored the clustering and distribution of needs in large dimensions by the degree of agreement established through percentiles as cut-off marks and groupings of cluster analysis. In this way, we have inferred a first group of high priority corresponding to the Adaptation of Socio-environmental actions for Sensory Disabled. Secondly, we found a group of moderate priority and that could be identified with the Training and Sensitization of Sensory Disabled through Socio-environmental Actions. Finally, we contemplate a third group of low priority that we could call Design and Planning of Socio-Environmental Actions for Sensory Disabled. On the other hand, the fundamental contribution of this work has been to present results and conclusions truly combined with the objective of validating the previously exposed hierarchy of Socio-environmental needs.
Keywords
Needs assessment – Data triangulation – Environmental education centers – Methodological advance.
1- Universidad de Granada, Granada, España. Contacto: [email protected]
Introduction
As reflected in the title of this work, its fundamental purpose is to validate a diagnosis of needs through a complex process of methodological triangulation. From this perspective, we find the three elements that compose the gears of this methodological experience of an environmental nature, namely:
a) diagnosis in socio-environmental needs; b) in an environmental education centre; and
c) through multiple methodological triangulation as a strategy of validation and legitimation in its approach as convergence.
Let us remember in this regard that the diagnosis of general needs can be considered as “a planned action aimed at obtaining information about the problem to be treated or the situation that we wish to modify with an educational or assistance intervention” (ÁLVAREZ ROJO, 2002, p. 54). For Álvarez Rojo (2002, p. 57-58), the main reasons for recommending needs assessment when a future social intervention is to be carried out are to:
•offerbasicinformationforthedeterminationofexistinggapsandopportunities
for action;
• encourage the decision-making process from the intended objectives and the
characteristics of the intervention;
•providenecessaryinformationtoinvolvethepeopledirectlyaffectedbytheaction
to be developed; and
•providetheadequateinformationtosociallyandinstitutionallyjustifythesocio --educational action to those directly and indirectly responsible for the intervention.
However, and as the second element of this work, we highlight the term Environmental Education Centre (EEC)2. Before trying to define an EEC, we show some key ideas of another term in which it is intimately incarnated, that is, with the term “environment”.
Turning back to the EEC, we can affirm that the manual’s definitions configure them as establishments in which comprehensive programmes and processes of environmental sensitization are implemented based on knowledge and awareness of the defence of natural values, etc. Therefore, we can affirm that EEC becomes
[…]spacesforreflection,inquiry,researchandcitizenparticipationinenvironmentalawareness processes in order to facilitate knowledge, sensitivity and the development of pro-environmental actions in the effort to minimize the environmental problems of the context where they are inserted. (GRACIA et al., 2013, p.139).
The research that concerns us has as a frame of reference an Environmental Education Centre located in a rural municipality of the province of Granada (Spain), surrounded by a rich natural environment that has numerous facilities, resources and educational programmes that establish guidelines for sustainable intervention and environmental awareness.
The third element in the list is triangulation. It is not strange —indeed, it is typical— to find research reports, articles, papers, and communications of a scientific nature in which it is unashamedly stated to have implemented processes of methodological
triangulationinitsdifferenttypologies.Withoutgoingdeeplyintofundamentalquestions
that could challenge these claims, we agree with Yeasmin and Ferdousour (2012), Torrance (2012) and Van Drie and Dekker (2013) that many of these works do not comply with the logic of triangulation despite the fact that they fly its flag. What usually appears as a work of triangulation becomes what Bericat (1998) calls the strategy or pathway of complementation.
In this sense, complementation is not the same as triangulation because the final product of this type of multi-method design is usually a report with two very different parts, each of which exposes the results achieved by the application of the corresponding research pathways implemented (methods, information-gathering
techniques,informants...).Althoughadegreeofintegrationexists,itisminimalandits
legitimacy is based on verifying the degree to which each angle is capable of revealing different and interesting areas of social reality. Faced with this position, however, in the logic of triangulation, the degree of integration increases in relation to complementation, and legitimacy is based on capturing similar facets of social reality from opposite poles,
obtainingafinalproductinwhichthecomparisonissoughtandisquiteconvergent andquitedivergent.Inourcase,thepretenceofmultipletriangulationimplementedis
the convergent validation in the prioritization of a needs analysis in an environmental facility in the province of Granada (Spain).
Methodological triangulation as a validation strategy
For Erazo (2011), triangulation in qualitative research is one of the basic requirementsofcredibilityoftheobtainedfindings.However,wehavetogobackalong
find triangulation as a plausible strategy for validating results. In essence, triangulation consists of documenting information and contrasting it according to different points
ofview,whichiswhywetalkaboutthetriangulationoftechniques,agents,times,and evenmethodologies.Asacontrasttechnique,itrevealsthecontradiction,inconsistency
or convergence between data obtained by different sources, as proven by, among others, the works of Bjurulf et al. (2013), Brown et al. (2015), Flick (2005), López et al. (2013), Teixeira et al. (2012), Van Drie and Dekker (2013). In addition, with Barusch et al. (2011), Bekhet and Zauszniewski (2012), Beattie et al. (2005), Hind (2017), Newman et al. (2013), Oelinik (2015), Okoe and Boateng (2016), Schraeli et al. (2017), Stutz (2016) and
Torrance(2012),wecanaffirmthattriangulationstrategiesallowtheexerciseofquality control over qualitative research processes, offering confidence tests and guarantees thattheresultsandfindingsproposedtheremeetminimumrequirementsofcredibility,
rigor, veracity and robustness.
Triangulation consists of a procedure by which the researcher takes a series of precautions throughout the planning, design, development and diffusion of the research so that their work does not suffer from serious scientific biases. These strategies do
notexclusivelyaffectthetechniquesandinstrumentsbutalsoaffecttheagentsthat
collect this information, the different moments in which the research is developed and organized, the methods, the different contexts, the sources of documentation, etc. Triangulation has been defined as a way to improve the results that a researcher
obtainsafterapplyingaspecifictechniquetohisorherwork(GORISSENetal.,2012). Therefore,triangulationisastrategyforthequalitycontrolofqualitativeresearch,
which gives us guarantees and confidence regarding the methodological goodness of
ourfindings.Theideaofqualityinqualitativeresearchisgenerallyassociatedwiththe
idea of credibility in the work of researchers (RODRÍGUEZ et al., 1999; SANDÍN, 2000; CRESWELL, 2005; RODRÍGUEZ-SABIOTE; LORENZO-QUILES, 2005; MORAL, 2006; MORSE, 2006; TÓJAR, 2006; BROD, TESLER; CHRISTENSEN, 2009; DENZIN, 2010; OLABUÉNAGA, 2012). Some people, however, consider triangulation as a strategy that is too incomplete and weak compared to what they call crystallization (RICHARDSON, 1997). While the triangle is erected in a rigid figure, fixed in two dimensions […] “the crystal combines symmetry and substance with an infinite variety of shapes, substances, transmutations, multidimensionalities, and angles of approach”(p. 92).
One might ask then if perhaps what this author advocates with an impeccable literary style is not similar to the complex processes of multiple triangulation that combine, contrast, compare, etc., different points and infinite levels of triangulation that comprise a vast and complex structure that can resemble the polyhedral contours that make up the crystallization.
Inthiscontextofquestioning,itisimportantthattheassessmentofqualityin
inrelationtoourinterests,thatthedatacollectionhasbeenadequateandwithout
pitfalls, and that the data analysis procedures have been followed without forcing the results in any tendentious direction. All these strategies constitute fundamental
actionguidelinesforqualityresearch(RODRÍGUEZetal.,1999);inallofthem,the
triangulation processes of information play a key role. “An exclusive trust in a method may polarize or distort the researchers view of the particular slice of reality that he or she is investigating” (COHEN; MANION, 2002, p. 332).
The proposal implemented
To prioritize the analysis of the needs of environmental facilities through multiple analytical triangulation strategies, we propose a procedural model structured in various stages. In its development, we will start with a basic approach by Gracia et al. (2013), whose fieldwork was developed during the spring of 2011 in an environmental facility of the province of Granada (Spain) and that consisted
ofthedeploymentofseveraltechniquesforcollectinginformation:internalfacility
documents, taking photographs and conducting interviews with various agents. These agents (relatives of children with visual needs who visited the facility, environmental education teachers of the facility, and special education teachers not belonging to the facility) were selected by theoretical sampling strategies related to such environmental facilities. In this work, the authors proposed a process of multiple triangulation for the analysis and prioritization of the environmental facility needs of the province of Granada (Spain) that were addressed in a basic manner and in which conclusions were presented. Although this approach is legitimate, we have considered that it could be improved with the methodological triangulation model in phases proposed by Sabiote and Gutiérrez-Pérez (2005) and Rodríguez-Sabiote et al. (2006) and that we will now detail.
The development of some type of methodological triangulation
Initially, it is obvious that it is necessary to implement some type of methodological triangulation in its different typologies. It is true that the logic of the model contemplated
favoursqualitativemethodologiesandtechniques,giventhatitisbasedonpresences vs.absencesoftheneedsandlessonthequantitativedimensionofthoseneeds.Inour
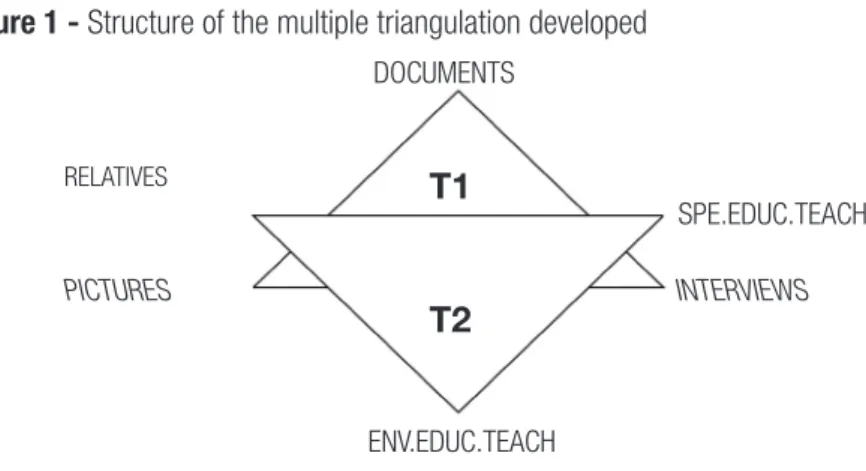
example, Gracia et al. (2013) proposed a nested multiple triangulation with two points of triangulation (T1 and T2) and various levels of triangulation:
Triangulation point 1 (T1):Techniques:Internaldocuments(Centreproject),other documents, photographs and interviews (4 levels of triangulation).
Figure 1 - Structure of the multiple triangulation developed
Source: Own elaboration.
Results
Analysis of the information collected at the various points and levels of triangulation
The detailed analysis of the information collected, which is not appropriate for the present work and which the interested reader can consult in Gracia et al. (2013), gave as a result the verification (or lack thereof) of the needs contemplated in each of the levels of triangulation. In this sense, the presence or absence of the evaluated needs was
consideredandthereforethedegreetowhichtheseneedswereverified,quantitatively speaking.However,regardlessofthequalitativetraditioninwhichtheworkisincarnated,
we know that the authors implemented the strategy suggested by Boeije (2009), Gibss (2012), Gibson (2009), Rodríguez et al. (1999) and Saldaña (2013) based on the already-classical assumptions stated by Miles and Huberman (1994, p. 429), namely, reduction of information, disposition and transformation of data and, finally, formulation and verification of conclusions. Therefore, it is not strange that our third phase, once the analysis phase is over, is the disposition and transformation of the data.
Disposition and transformation of the data obtained in triangulation points in a matrix of presences vs. absences
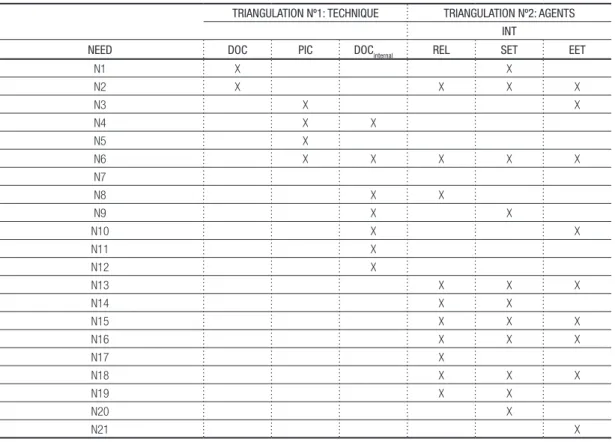
Once the presence or absence of the need has been confirmed at the triangulation points, after the relevant analysis processes to which the information collected has been submitted, Gracia et al. (2013) arranged a double-entry data matrix through which, with an “x” for presence and a blank cell for absence, the disposition of the needs is indicated in the triangulation points and levels. In more detail, the following was the detailed matrix:
T1
T2
SPE.EDUC.TEACH
INTERVIEWS RELATIVES
PICTURES
Table 1- Matrix of presences vs. absences of socio-environmental needs in the different levels of triangulation
TRIANGULATION Nº1: TECHNIQUE TRIANGULATION Nº2: AGENTS INT
NEED DOC PIC DOCinternal REL SET EET
N1 X X
N2 X X X X
N3 X X
N4 X X
N5 X
N6 X X X X X
N7
N8 X X
N9 X X
N10 X X
N11 X
N12 X
N13 X X X
N14 X X
N15 X X X
N16 X X X
N17 X
N18 X X X
N19 X X
N20 X
N21 X
Key: DOC: Internal documents and others documents; PIC: Pictures; INT: Interviews; REL: Relatives; SET: Special Education Teachers; EET: Environmental Education Teachers.
Source: Gracia et al. (2013, p. 135).
Now, we turn to the initial contribution of these authors. Its final result was this matrix of presences vs. absences of the needs observed in an environmental facility as a previous step in its hierarchy during the implementation of an intervention programme with people with sensory needs.
Alone, this double-entry matrix is not entitled to a process of multiple methodological
triangulation,althoughitstartedfromadoubletriangulationofagentsandtechniques
The creation of the coverage or coverage map
Asubsequentevolution,thatistosay,whatiscalledtransformationoftheinitial
data, is the percentage presence of each need when crossed with each level of triangulation
(horizontallogic).Thesedataintuitivelyrevealtheimportancethateachneedacquires
when being judged from different prisms. For this, we have calculated an index, the coverage index, with two modalities: ratio and percentage. The coverage index is defined as follows:
a) Ratio: IDen = number of levels of triangulation in which the need is the present/ number of total levels of triangulation considered; and
b) Percentage: IDen% = number of levels of triangulation in which the need is the present/number of total triangulation levels considered x 100.
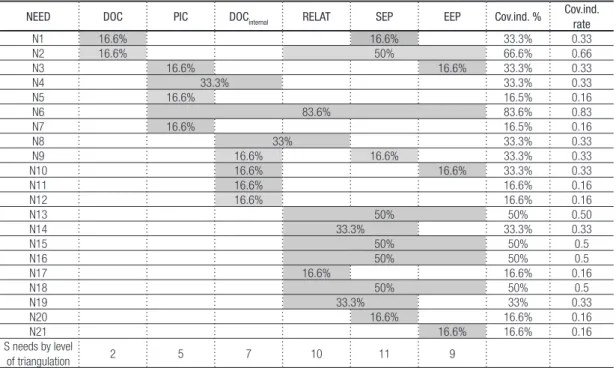
With this, we are also configuring what we have called the coverage map, which is nothing more than the greater or lesser presence percentage of each need by levels of triangulation through the allocation of shading using a horizontal layout. The coverage map of the example that concerns us in its entirety would be the following:
Table 2- Map of coverage of socio-environmental needs in the different levels of triangulation, along with their corresponding index and coverage percentage
NEED DOC PIC DOCinternal RELAT SEP EEP Cov.ind. % Cov.ind.
rate
N1 16.6% 16.6% 33.3% 0.33
N2 16.6% 50% 66.6% 0.66
N3 16.6% 16.6% 33.3% 0.33
N4 33.3% 33.3% 0.33
N5 16.6% 16.5% 0.16
N6 83.6% 83.6% 0.83
N7 16.6% 16.5% 0.16
N8 33% 33.3% 0.33
N9 16.6% 16.6% 33.3% 0.33
N10 16.6% 16.6% 33.3% 0.33
N11 16.6% 16.6% 0.16
N12 16.6% 16.6% 0.16
N13 50% 50% 0.50
N14 33.3% 33.3% 0.33
N15 50% 50% 0.5
N16 50% 50% 0.5
N17 16.6% 16.6% 0.16
N18 50% 50% 0.5
N19 33.3% 33% 0.33
N20 16.6% 16.6% 0.16
N21 16.6% 16.6% 0.16
S needs by level
of triangulation 2 5 7 10 11 9
Caption: DOC: Internal documents and other documents; PIC: Pictures; INT: Interviews; RELAT: Relatives; SEP: Special Education Professionals; EEP: Environmental Education Professionals; Cov.ind.%:Coverage index (percentage); Cov.ind.: Coverage index (rate).
The prioritization of needs based on the coverage indexes and the coverage or coverage map
The final step, once the previous steps have been implemented, is to determine which needs are more or less important from the coverage indexes and the map of presences vs. absences. As a result (their comparison), both determinations will a final analytical-type triangulation (T3).
The prioritization of needs based on coverage indexes
To determine which needs are more or less priority based on the coverage indexes, we recommend the use and calculation of position measurements in their various modalities
(percentiles,quartiles…)withtheobjectiveofestablishingthreesimilargroupsofneeds,
according to their priority level. In the case that concerns us, we have calculated the 33rd and 66th percentiles in the column of the coverage indexes (it does not matter if it is in ratio mode or percentage mode because the results will be identical). The following results are obtained: P33 = 0.20 and P66: 0.33. With these results, we can establish a first prioritization of needs, taking the two cut-off values of 0.20 and 0.33 and classifying them as follows:
a) Low prioritygroup, needs with IDen < 0.20 (< P33);
b) Moderate priority group, needs with IDen between 0.20 and 0.33 (between P33 and P66); and
c) High priority group, needs with IDen > 0.33 (> P66).
With these assigning criteria, the needs will be classified and therefore hierarchical in three priority groups, namely,
Table 3- Classification of each socio-environmental need in priority groups according to their location in the percentiles considered (P33 and P66)
Code NEEDS Priority group: 1: low; 2:
moderate; 3: high
1 Initiate an EA project on ecological teaching gardens for people with visual and/or auditory disabilities
to facilitate their integration and the acquisition of knowledge. 2 2 Carry out an EA project on ecological teaching gardens for the entire population to raise awareness
with this group. 3
3 Carry out an EA project on an ecological teaching garden in the Centre. 2 4 Create a project on organic gardens to instil participants with a general idea of organic farming. 2 5 Take advantage of available spaces with the creation of an ecological teaching garden. 1 6 Adapt certain spaces in the Centre with the appropriate signage to encourage the independent
movement of visually impaired visitors. 3 7 Ensure that participants know the difference between ecological and non-ecological products. 1 8 Adapt the pedagogical project to people with visual or hearing disabilities. 2 9 Promote the use of ecological agriculture among the participants through activities, information
sessions, etc. 2
10 Adequate training and knowledge on the part of the Centre’s pedagogical team on visual and auditory
11 Respond to the specific educational-support needs (LOE, 2006) of these groups from the Centre’s
pedagogical project. 1
12 Adapt didactic materials such as booklets, guides, etc., to Braille for blind people or increase the size of
the letters for people with poor vision. 1 13 Carry out activities parallel to the project, but intimately related to it. 2 14 Offer prior information sessions, explanations, etc., on organic farming. 2 15 Ensure that the stay in the Centre for participation in the project does not exceed 3-4 days. 3 16 Ensure that the groups that attend are heterogeneous for the integration of people with auditory-visual
disability. 3
17 Engage in meticulous and detailed project planning. 1
18 Ensure that the project is carried out in the spring months. 3 19 Ensure that the price of the stay does not exceed approximately150 euros. 2
20 Use appropriate materials for garden-related tasks. 1
21 Carry out a high-quality campaign to disseminate the project. 1 Source: Own elaboration.
The prioritization of needs from the matrix of presences vs. absences
Another alternative for the prioritization of needs is an analysis of the map of the matrix of the presence vs. the absence of needs. Taking its binary arrangement as 0 = absence and 1 = presence, an ideal method to address its few execution restrictions is called cluster analysis. In our case, we have implemented the hierarchical cluster analysis
using the Ward method and taking the quadratic Euclidean distances as dissimilarity
measures. The main results after its implementation, the tree diagram (dendogram) and the membership table are shown below. However, before assigning each need to a type of priority cluster, we must calculate its coverage index averages at the ratio and percentage level based on the cluster table initially provided by the inferred model. Once the initial structure of belonging for each need to its corresponding cluster is known, the averages are calculated at the ratio and percentage level with the objective of assigning each need with the same classification used in the percentiles; in other words, we identify the lowest averages with low priority and vice versa.
Table 4- Clusters, according to priority and complementary statistics
Cluster types, according to priority Original membership cluster
Number of needs in the cluster
Needs that make up the cluster
Averages of coverage index
Average% coverage index
cluster 1: low priority 3 6 4,5,7,10,11,12 .2167 21.67%
cluster 2: moderate priority 1 7 1,8,9,14,17,19, .2814 28.14%
cluster 3: high priority 2 8 2,3,6,13,15,16,18,21 .4763 47.63%
Graphic 1- Dendrogram obtained after the application of the cluster analysis implemented
Source: Own elaboration.
Agreement between coverage indices vs. presence vs. absence matrix
The prioritization process can achieve a better legitimacy if we ultimately use a last point of analytical triangulation with two levels (coverage indexes vs. coverage map). To do so, it is essential to create a table in which we specify the place occupied by each need according to one strategy or another. The following table could be useful for such purposes:
Table 5- Classification correspondence of socio-environmental needs, according to coverage index and needs map (clusters)
NEEDS Priority groups by coverage indexes (percentiles) Priority groups by clusters
1 2 2
2 3 3
3 2 3
4 2 1
5 1 1
6 3 3
7 1 1
8 2 2
9 2 2
10 2 1
11 1 1
12 1 1
13 2 3
14 2 2
15 3 3
16 3 3
17 1 2
18 3 3
19 2 2
20 1 2
21 1 3
Legend: Group 1: low priority; 2: moderate priority; 3: high priority.
0 5 10 15 20 25
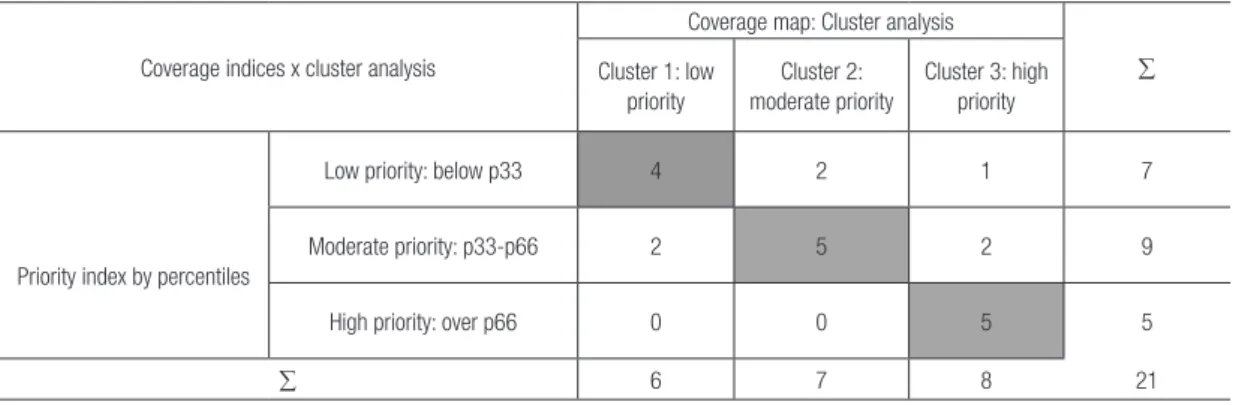
To determine the number of agreements and disagreements, we have transformed the above table into a 3x3 two-dimensional contingency table, which we explain below considering the coverage and cluster index dimensions.
Table 6- Contingency table when comparing the classifications of the coverage indices and the cluster analysis
Coverage indices x cluster analysis
Coverage map: Cluster analysis
∑
Cluster 1: low priority
Cluster 2: moderate priority
Cluster 3: high priority
Priority index by percentiles
Low priority: below p33 4 2 1 7
Moderate priority: p33-p66 2 5 2 9
High priority: over p66 0 0 5 5
∑ 6 7 8 21
Source: Own elaboration.
As shown in the table above, the number of agreements amounts to 14 (diagonal of the table), whereas the disagreements amount to half (7). To assess whether this 66.6% agreement is significant and, furthermore, not random, we must obtain the value of Cohen’s Kappa coefficient and complementary statistics as follows:
Table 7- Cohen’s kappa value and complementary statistics
Value Asymp. Std. Error * Approx. t** Approx. Sig.
Measure of agreement Kappa .603 .151 3.355 .001
N of valid cases 21
* Assuming the alternative hypothesis.
** Using the standard asymptotic error based on the null hypothesis. Source: Own elaboration.
As seen, the classification agreement of the needs by analytical strategies can be considered satisfactory, given that 14 report agreement and half (7) disagreement. To assess whether the 66.6% agreement is significant and, moreover, not random, we must obtain the value of Cohen’s Kappa coefficient that amounts to κ = .603.
Therefore, we reject the null hypothesis, and we can affirm that the agreement achieved in the manner in which both analysis strategies (percentiles vs. cluster analysis) prioritize the needs of the environmental facility is globally similar.
Conclusions
From the results obtained, we can infer two types of conclusions. On the one hand, we make what we can call methodological findings, and on the other hand, we make findings that are strictly related to the object of diagnosis, in our case, the needs of the environmental facility related to the unavoidable task of implementing an intervention project for visitors with sensory impairment. In any case, both are clearly related and it is impossible to understand one without the other.
Of the first, that is, those of a strictly methodological nature, we must bear in mind that the basic objective of this work has been the diagnosis of needs from an actionable research perspective to prioritize the demands presented when beginning the multiple triangulation processes. However, the premise of the approach has been multiple methodological-analytical triangulation as convergence. We have attempted to bring together—from different prisms— the degree of concordance or agreement established in terms of its importance given the needs highlighted in the diagnosis prior to the intervention project.
In this sense, as seen from the agreement coefficient finally obtained ( = .603), it can be said that an agreement has been established consisting of how different agents or
participantsanddifferentinformationcollectiontechniqueshavehighlightedtheneeds that,initsopinion,weremoreimportantinanenvironmentalfacility.Consequently,this
legitimates the hierarchy of needs established as useful for the intervention project put in
place.Wemustnotforgetthatinthequalitativemethodology,oneofthemostpowerful
strategies to validate our conclusions is triangulation in its different typologies.
Until now, the problem has been that even though triangulation processes are used and there have been many research reports, only a few of those reports have presented totally combined results. That is, it is typical to conclude that there are watertight findings from the different levels and points of triangulation that are commented on and discussed separately. Thus, in our example, starting from three levels with two triangulation points (3Nx2P), we would obtain results A1/A2 + B1/B2 + C1/C2 and, therefore, conclusions A1/A2 + B1/B2 + C1/C2. From this perspective, our proposal lies in obtaining combined results: A1/2 B1/2 C1/2andconsequently,conclusions:A1/2B1/2C1/2 intimately confronted in search of a possible or probable consensus.
Last but not least is to determine the degree to which the results obtained by the different views considered are similar, provided that the initial premise is both triangulation and convergence. In this sense, the triangulation model implemented will have greater validation power the greater the agreement reached.
Thus, even with all the limitations of this study, we can confirm that methodological
triangulationisausefultooltovalidateandlegitimizeresultsbasedonqualitativequality
Second, we find what we have called findings or conclusions related to the object and research objectives of the study. In this sense, we can affirm that there is a justified consensus that establishes three degrees of importance in which the 21 prioritized needs in this diagnosis are grouped in the following dimensions: there is a group of high priority needs that involve the importance of carrying out intervention projects related to gardens and their adaptation to spaces, resources and the timing of actions. We could call this high-priority group the Adaptation of Socio-environmental Actions for the Sensory Disabled.
However, there is a second level or group of needs of moderate priority related to the importance of developing actions on ecological teaching gardens to promote training, environmental awareness and knowledge of organic farming from processes adapted to the visually disabled group to encourage their integration. We could call this group the Training and Awareness for the Sensory Disabled through Socio-environmental Actions.
Finally, we find a group of low-priority needs that derive from the planning, execution and adaptation of the spaces and the intervention for the development of these socio-environmental initiatives. We could call this group of needs Design and Planning of Socio-Environmental Actions for the Sensory Disabled.
We can conclude, therefore, that to make feasible and develop relevant socio-environmental interventions in socio-environmental education facilities, a good needs diagnosis
isrequiredthatcanbesupportedatamethodologicallevelinprocessesinvolvingthe
methodological-analytical triangulation of data that validate the demands derived from said process.
References
ALVAREZ ROJO, Victor. Diagnóstico pedagógico. Archidona: Aljibe, 2002.
BACA, Laura; BOSKER, Judith. Léxico de la política. México D.F: Fondo de Cultura Económica, 2000.
BARUSCH, Amand et al. Rigor in qualitative social work research. A review of strategies used in published articles National Association of Social Workers (NASW). Social Work Research, Oxford, v. 35, n. 1, p. 11-19, 2011.
BEATTIE, Rona et al. Utilizing methodological pluralism to develop theory: analytical triangulation enhancing understanding of managerial effectiveness in supporting learning, United Kingdom: [s. n.], 2005. Disponible en: <http://search.proquest.com/docview/62073797?accountid=14542>. Acceso en: 28 my. 2008.
BEKHET, Abi; ZAUSZNIEWSKI, Jaclene Annette. Methodological triangulation: an approach to understanding data. Nurse Researcher, Ohio, v. 20, n. 2, p. 40-43, 2012.
BJURULF, Staffan et al. A triangulation approach to impact evaluation. Evaluation, New York, v. 19, n. 1, p. 56-73, 2013.
BOEIJE, Hennie. Analysis in qualitative research. London: Sage, 2009.
BROD, Meryl, TESLER, Laura; CHRISTENSEN, Torten. Qualitative research and content validity: developing best practices based on science and experience. Quality of Life Research, Amsterdam, v. 18, n. 9, p.1263-1278, 2009.
BROWN, Judith et al. Measuring teamwork in primary care: triangulation of qualitative and quantitative data. Families Systems & Health, Washington, DC., v. 33, n. 3, p. 193-202, 2015.
BUSTAMANTE, Jorge. Derecho ambiental: fundamentación y normativas. Buenos Aires: Habedlo-Perrot, 1995.
CABANILLAS, Antonio. La reparación de los daños al medio ambiente. Madrid: Aranzadi, 1996.
CAMPBELL, Donald; FISKE, Donald. Convergent and discriminant validity multitrait-multimethod matrix. Psychological Bulletin, Washington, DC., v. 56, n. 2, p. 81-105, 1959.
COHEN, Louis; MANION, Louis. Métodos de investigación educativa. Madrid: La Muralla, 2002.
CRESWELL, John. Research design: qualitative, quantitative and mixed methods approaches. Thounsand Oaks: Sage, 2005.
DENZIN, Norman. Moments, mixed methods, and paradigm dialogs. Qualitative Inquiry, New York, v. 16, n. 6, p. 419-427, 2010.
DENZIN, Norman. The research act. New York: McGraw-Hill, 1978.
ERAZO, María Soledad. Rigor científico en las prácticas de investigación cualitativa. Ciencia, Docencia y Tecnología, Ente Ríos, v. 22, n. 42, p. 107-137, mayo, 2011.
ESPAÑA. LOE - Ley Orgánica 2/2006, de 3 de mayo, de Educación. Boletín Oficial del Estado, Madrid, n. 106, p. 17158-17207, 4 mayo 2006.
FLICK, Udo. Triangulation. Weinheim: Deutscher Studien Verlag, 2005.
GIBSON, Will. Working with qualitative research. London: Sage, 2009.
GIBSS, Graham. El análisis de datos cualitativos en investigación cualitativa. Madrid: Morata, 2012.
GRACIA, Paloma et al. Ve escuchando, escucha viendo: el huerto de los sentidos. In: TOJAR-HURTADO, Juan Carlos (Coord.). La formación de educadores ambientales a nivel Máster: propuestas profesionales y trabajos de investigación. Archidona: Aljibe, 2013. p. 127-144.
HIND, Daniel. Using a logic model and a triangulation protocol for integrating quantitative and qualitative research data in a mixed-methods feasibility study incorporating an external pilot RCT. Trials, New York, v. 18, n. 1, p. 46-67, 2017.
JICK, Todd. Mixing qualitative and quantitative methods: triangulation in action. Administrative Science Quarterly, Cornell, v. 24, n. 4, p. 602-611, 1979.
LANDIS, Richard; KOCH, Gary. The measurement of observer agreement for categorical data. Biometrics, Hoboken, v. 33, p. 159-174, 1977.
LÓPEZ, Andrea, et al. Interdisciplinary mixed methods research with structurally vulnerable populations: case studies of injection drug users in San Francisco. International Journal of Drug Policy, London, v. 24, n. 2, p. 101-109, 2013.
MILES, Matthew; HUBERMAN, Michael. Data management and analysis methods. In: DENZIN, Norman; LINCOLN, Yvona (Ed.). Handbook of cualitative research. London: Sage, 1994. p. 429-444.
MORAL, Cristina. Criterios de calidad de la investigación cualitativa. Revista de Investigación Educativa, Murcia, v. 24, n. 1, p. 147-166, 2006.
MORSE, Janice. Insight, inference, evidence, and verification: creating a legitimate discipline. International Journal of Qualitative Methods, Edmonton, v. 5, n. 1, p. 1-7, 2006. Disponible en: <http://www.ualberta. ca/~iiqm/backissues/5_1/html/morse.htm>. Acceso en: 11 jun. 2010.
NEWMAN, Isadore et al. Content validity using a mixed methods approach: its application and development through the use of a table of specifications methodology. Journal of Mixed Methods Research, Ann Arbor, v. 7, n. 3, p. 243-260, 2013.
OELINIK, Anton. On content analysis of images of mass protests: a case of data triangulation. Quality & Quantity, Amsterdam, v. 49, n. 5, p. 2203-2220, 2015.
OKOE, Abednego Feehi; BOATENG, Henry. Two-way communication on bank websites in Ghana: a data triangulation approach. Information Development, New York, v. 32, n. 5, p. 1471-1484, 2016.
PEREIRO, María Delia. Daño ambiental en el medio ambiente urbano: un nuevo fenómeno económico en el siglo XXI. Buenos Aires: Fondo Editorial de Derecho y Economía, 2001.
RAE. Real Academia de la Lengua Española. Diccionario de la Lengua Española. Madrid: Espasa Calpe, 2002.
RICHARDSON, Laurel. Fields of play: constructing an academic life. New Brunwick: Rutgers University Press, 1997.
RODRÍGUEZ, Gregorio et al. Metodología de la investigación cualitativa. Archidona: Aljibe, 1999.
RODRÍGUEZ-SABIOTE, Clemente et al. La triangulación analítica como recurso para la validación de estudios de encuesta recurrentes e investigaciones de réplica en Educación Superior. Revista de Investigación y Evaluación Educativa, Valencia, v. 12, n. 2, p. 1-18, 2006.
RODRÍGUEZ-SABIOTE, Clemente; GUTIÉRREZ-PÉREZ, José. Un modelo de validación de estudios empíricos en investigación educativa mediante procedimientos de triangulación: aplicación a un estudio de caso sobre disfunciones y desajustes asociados a la reforma de un plan de estudios universitario. Revista Portuguesa de Pedagogía, Coimbra, n. 39, p. 135-157, 2005.
RODRÍGUEZ-SABIOTE, Clemente; LORENZO-QUILES, Oswaldo. Teoría y práctica del análisis de datos cualitativos: proceso general y criterios de calidad. Sociotam, Ciudad Victoria, v. 15, n. 2, p. 133-154, 2005.
RUIZ OLABUÉNAGA, José Ignacio. Teoría y Práctica de la Investigación cualitativa. Bilbao: Universidad de Deusto, 2012.
SALDAÑA, Johnny. The coding manual for qualitative researchers. Thousand Oaks: Sage, 2013.
SANDÍN, Mari Paz. El rigor científico en la investigación cualitativa. Revista de Investigación Educativa, Murcia, v. 18, n. 1, p. 223-242, 2000.
SCHRAELI, Marianne et al. Interprofessional collaboration from nurses and physicians: a triangulation of quantitative and qualitative data. Pflege, Göttingen, v. 30, n. 2, p. 53-63, 2017.
STUTZ, Ulrike. Art and science: an empirically grounded construction of types through interdisciplinary data triangulation of pictures and texts in an ethnomethodological research in early childhood art education. International Journal of Qualitative Methods, Edmonton, v. 15, n. 1, p. 1-8, 2016.
TEIXEIRA, Juliana Cristina et al. Triangulation method in administration studies: generating conversations between paradigms or mere “convergent” validations? Revista de Administração Pública, Rio de Janeiro, v. 46, n. 1, p. 191-220, 2012.
TÓJAR, Juan Carlos. Investigación cualitativa: comprender y actuar. Madrid: La Muralla, 2006.
TORRANCE, Harry. Triangulation, respondent validation, and democratic participation in mixed methods research. Journal of Mixed Methods Research, Ann Arbor, v. 6, n. 2, p. 111-123, 2012.
VAN DRIE, Jannet; DEKKER, Rikje. Theoretical triangulation as an approach for revealing the complexity of a classroom discussion. British Educational Research Journal, London, v. 39, n. 2, p. 338-360, 2013.