UNIVERSIDADE DA BEIRA INTERIOR
Ciências da Saúde
Molecular Modelling of a novel G-quadruplex
structure and its interaction with ligands
Rui Pedro Abrantes Carrilho
Dissertação para obtenção do Grau de Mestre em
Ciências Biomédicas
(2º ciclo de estudos)
Orientador: Prof. Carla Cruz
Co-orientador: Prof. Fani Sousa
iii
Agradecimentos
Firstly, I must thank my supervisor, Dr. Carla Cruz, and my co-supervisor, Dr. Fani Sousa, for all the help they gave me. Without their patience, guidance, support, and advice provided throughout the year, this work would never have seen fruition.
To the great Tiago Santos and Josué Carvalho, who stuck with me throughout the year, lending me aid whenever I needed, and without whom this work would not be half as good as it has any right to be, I give my sincerest thanks. Gentlemen, it’s been an honor.
To the many people who helped me see this year through. Whether it was the “Icons” Nádia, Ricardo and Elizabete, who put up with me down at the lab, or Zé, Duarte and Bruno over at the old Masters students room, or Vanessa, with our online chats, or my fantastic lab bro, Henrique, with a flawless taste in anime and strategy games: you made long hours fly, and I wouldn’t have had it any other way.
To my family, especially my Mom, Dad, Filipe and grandparents. For their enduring support, guidance, and help, and giving me the chance I needed to finish this, I thank you.
To my grandpa. I wish you could have seen this work to the end. I hope you’re looking down at this with a smile on your face. I did it.
v
Resumo alargado
O ADN pode existir sob a forma de diversas estruturas, contrariamente ao que a vasta maioria da população pensa, ao imaginar a dupla hélice de Watson e Crick. Uma das formas que tem sido mais investigada ultimamente consiste no G-quadruplex. Esta estrutura não canónica do DNA ocorre quando guaninas se emparelham e organizam em estruturas cíclicas através de pontes de hidrogénio Hoogsteen, chamadas G-quartetos. Estas estruturas formam-se por empilhamento π-π entre elas próprias, originando o G-quadruplex, desde que haja um catião (preferivelmente K+) para assumir uma localização central entre todos os quartetos.
Estas estruturas desempenham funções importantes a nível de regulação da transcrição e replicação do DNA. Alguns estudos indicam também que podem ser relevantes a nível de manutenção do DNA, e que várias secções do DNA humano se encontram num estado de equilíbrio entre a forma de G-quadruplex e duplex. São também considerados alvos para certas abordagens terapêuticas a nível do cancro. Por exemplo, vários oncogenes como c-kit e c-myc têm a capacidade de formar G-quadruplexes nos seus promotores. Controlando a forma que estes genes assumem, seria possível controlar a sua transcrição, e possivelmente impedir a formação de cancro. Outra possibilidade cinge-se à inibição da telomerase, uma enzima responsável pela replicação celular, que está sobreexpressa em células cancerígenas. Se uma parte do telómero assumir uma estrutura em G-quadruplex, a ação desta enzima fica inibida, efetivamente parando a progressão do cancro.
Portanto, torna-se necessário induzir e estabilizar a formação de estruturas do G-quadruplex. A estratégia é utilizar ligandos que interajam por interações intermoleculares de forma a estabilizar a estrutura do G-quadruplex, e outra topologia que esteja em equilíbrio. No entanto, analisando a literatura, conclui-se que apenas alguns grupos de ligandos são efetivamente ligandos de G-quadruplex.
Este trabalho de investigação teve como objetivo comparar 7 ligandos promissores da estrutura de G-quadruplex designada por pre-miR-149 literatura. Os ligandos selecionados foram macrociclos derivados de fenantrolina ([16]phenN2, [32]phen2N4, Phen-DC3, e derivados de
laranja de acridina C8 e C8-NH2. Determinou-se a afinidade e a estabilização destes ligandos
com a estrutura do RNA G-quadruplex, a pre-miR-149. Isso será feito em duas etapas principais. Primeiro, foram realizadas simulações computacionais para determinar quais os ligandos mais promissores e quais os seus métodos de interação com a estrutura G-quadruplex. Estas dividiram-se em três passos: primeiro, foram geradas as estruturas da sequência e de cada ligando em software adequado. Segundo, foram feitas simulações de docking de modo a averiguar os locais de ligação de cada ligando ao G-quadruplex, e a conformação e interações entre o ligando e o quadruplex, sendo também calculadas energias de ligação entre o ligando e o G-quadruplex. Finalmente, foram feitas simulações de dinâmica molecular sobre como essa
vi
conformação evoluiria num ambiente fisiológico simulado e calculadas novas energias de ligação, que comparadas entre si, revelam diferenças de afinidades entre os ligandos. Após estas técnicas computacionais, foram executadas técnicas biofísicas, como espetroscopia de dicroísmo circular e estudos de desnaturação térmica, e espectroscopia de fluorescência para determinar experimentalmente as afinidades de cada ligando para com a estrutura escolhida. Foram também executadas experiências de cromatografia de afinidade para determinar o comportamento de um ligando para com sequência do RNA G-quadruplex, a pre-miR-149. O programa usado para avaliar as conformações iniciais gerou estruturas demasiado rígidas e pouco flexíveis com os ligandos macrocíclicos [16]phenN2 e [32]phen2N4. As energias de ligação
obtidas revelaram a nível de afinidade a seguinte ordem decrescente: piridostatina > [32]phen2N4 > [16]phenN2 > PhenDC3 > L-arginina > C8 > C8-NH2. Esta tendência não foi a mesma
verificada experimentalmente, e logo, foi descartada. A nível destas experiências, retiram-se maioritariamente apenas as conformações dos ligandos que não são macrociclos.
A nível das experiências de dicroísmo circular mencionadas, as variações de temperatura de desnaturação térmica ligando-quadruplex foram diferentes,verificando-se a seguinte ordem: C8
> piridostatina > C8-NH2 > [16]phenN2. Seguidamente, foram realizadas titulações por
espectroscopia de fluorescência as quais revelaram a seguinte tendência: C8 > C8-NH2 >
[16]phenN2. De notar que apenas quatro dos sete ligandos ([16]phenN2, [32]phen2N4, C8 and C8
-NH2) possuíam fluorescência intrínseca, e que desses, apenas estes três puderam ser
selecionados. Estes resultados mostraram que a piridostatina, e derivados de laranja de acridina C8 e C8-NH2 apresentaram maior afinidade para esta estrutura de G-quadruplex.
Por último, os resultados de cromatografia de afinidade revelaram que o ligando C8-NH2 tem
maior afinidade com o RNA G-quadruplex pre-miR-149 . Das seis sequências testadas, três delas (c-myc, c-kit e pre-miR-149) formam G-quadruplexes com topologia paralela, e tiveram tempos de retenção mais altos. Outras sequências (TBA e AG23) formam G-quadruplexes com topologia antiparalela, e mostram tempos de retenção mais baixos. A sequência ds26 (duplex) teve o tempo de retenção mais baixo. Conclui-se que este ligando tem maior especificidade para com G-quadruplexes com topologia paralela em detrimento do duplex. As simulações de docking corroboram esta conclusão.
Deste modo, conclui-se que os melhores ligandos a nível de afinidade para com a sequência pre-miR-149 são os derivados de laranja de acridina C8 e C8-NH2 e a piridostatina, de modo que
futura investigação nesta área deve considerar estes três como fortes candidatos a ligandos de RNA G-quadruplex.
vii
Abstract
DNA can exist under many different forms. Lately, G-quadruplexes, which are one example of the non-canonical DNA forms, have been getting a lot of attention due to the role they play in certain biological processes and as potential targets for therapeutic interventions. For example, these structures can exist in certain parts of the telomeres, structures responsible for cell replication. In cancer cells, if the enzyme telomerase could be inhibited, by inducing the formation of a G-quadruplex structure in guanine-rich telomere sequences, the spread of cancer cells would cease. For this and other reasons, it becomes important to be able to induce the formation of G-quadruplex structures and/or stabilize them, and one of the ways of doing so consists of targeting these sequences with ligands that have good affinity to G-quadruplex structures. However, few G-quadruplex ligands demonstrated the needed properties to fulfill the clinical needs, and further efforts to determine which would be better suited to target any particular sequence are needed. This work aimed at comparing the affinity to the pre-miR-149 G-quadruplex structure of seven promising ligands found in the literature, through the latest techniques fit for that purpose. The seven ligands tested were: [16]phenN2, [32]phen2N4,
phen-DC3, pyridostatin, acridine orange derivatives C8 and C8-NH2 and L-arginine. Firstly, they
underwent computational tests, with the molecular structure of the quadruplex and the ligand being simulated, and their optimal binding site and conformation found. Their binding energies were compared, and they underwent molecular dynamics runs to simulate their behavior in an environment with solvent, followed by another binding energy comparison. The trend obtained in order of decreasing binding affinity was: pyridostatin > [32]phen2N4 > [16]phenN2 > Phen-DC3
> L-arginine > C8 > C8-NH2. Biophysical techniques were then performed, to determine the
binding affinities experimentally. First, circular dichroism spectroscopy and melting studies (performed on four ligands) established the following trend: C8 > pyridostatin > C8-NH2 >
[16]phenN2. Fluorescence spectroscopy titration (performed on three) revealed a similar trend:
C8 > C8-NH2 > [16]phenN2. Lastly, affinity chromatography experiments were held to test how
other DNA sequences would bind to C8-NH2. The results revealed that the ligand has better
binding affinity with parallel quadruplexes over antiparallel ones, and poor binding with a duplex sequence. Overall, the best ligands identified for binding to the G-quadruplex structure were the acridine orange derivatives C8 and C8-NH2, and pyridostatin. These three ligands should
be considered prime candidates for further research in this area.
Keywords:
G-quadruplex; pre-miR-149; Molecular modelling; Circular dichroism; Fluorescence spectroscopy; Affinity chromatography
ix
Table of Contents
Chapter I ... 1
1.1 - DNA history... 1
1.2 - Definition and structure of G-quadruplex (G4) ... 2
1.2.1 - RNA G4s compared to DNA G4s ... 5
1.3 - Biological relevance of G4 ... 5
1.4 - G4s aptamers ... 8
1.5 - Targeting the G4 with small ligands ... 8
1.6 - G4 structure and binding characterization ... 9
1.6.1 - Circular dichroism spectroscopy... 10
1.6.2 - Fluorescence spectroscopy ... 10
1.6.3 - High-resolution magic angle spinning (HRMAS) NMR technique ... 11
1.6.4 – Chromatography experiments ... 11 1.6.5 - Docking ... 12 1.7 - Work summary ... 16 Chapter II ... 17 Chapter III ... 19 3.1 - Materials ... 19 3.2 - Methods ... 19
3.2.1 - Synthesis of affinity chromatography supports ... 19
3.2.2 - Circular dichroism (CD) spectroscopy ... 20
3.2.3 - Fluorescence spectroscopy binding studies ... 20
3.2.4 – HRMAS NMR spectroscopy ... 21 3.2.5 – Affinity chromatography ... 22 3.2.6 - Molecular dynamics ... 22 3.2.6.1 - Model construction ... 22 3.2.6.2- Model stabilization ... 22 3.2.6.3 - Molecular docking ... 23 3.2.6.3.1 - Parameter preparation ... 23
x
3.2.6.3.2 - Docking performance and results extraction/analysis... 24
3.2.6.3.3 - Molecular dynamics runs ... 24
3.2.6.3.4 - Mdrun results analysis ... 25
Chapter IV ... 27
4.1 - Docking experiments ... 27
4.1.1 – Docking conformation analysis ... 29
4.1.2 - RMSD graph analysis ... 31
4.1.3 - Cluster analysis ... 34
4.1.4 - MM/PBSA analysis ... 41
4.2 - Circular dichroism ... 43
4.3 – Fluorescence essays ... 49
4.4 - Incongruencies between computational and biophysical experiments ... 53
4.5 - Affinity chromatography ... 54
Chapter V ... 57
Chapter VI ... 59
xi
Figures List
Figure 1 – The arrangement of guanine bases in a G-quartet, with a centrally placed metal ion.
Adapted from [12]. ... 3
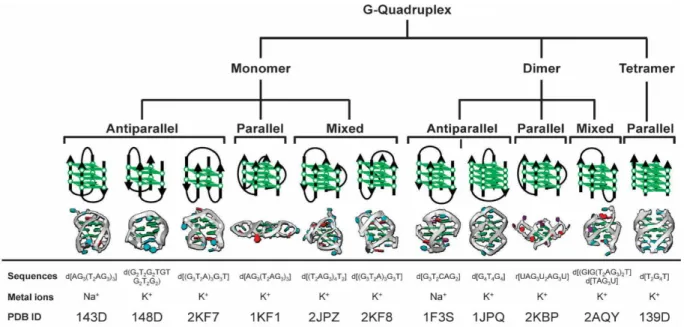
Figure 2 – Different G4 structures, according to number of strands, strand polarity, and ion channel nature. Adapted from [14]. ... 4
Figure 3 - Differences between DNA G4s and RNA G4s. Adapted from [15] ... 5
Figure 4 – The formation of a G4 structure by stabilizing it with a ligand inhibits telomerase activity. Adapted from [26]. ... 7
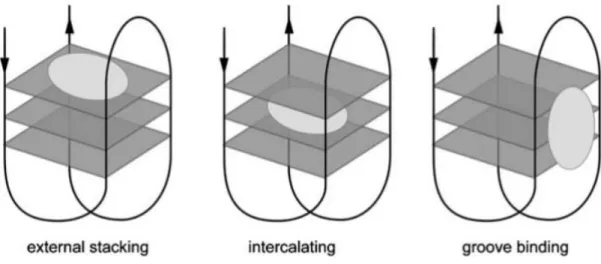
Figure 5 – The different binding modes in a ligand-G4 complex, with (from left to right) external stacking, intercalating and groove binding. [37] ... 9
Figure 6 – Two adducts in a simulation approach, with the ligand and target separated by some distance, interacting through H-bonds. [55] ... 13
Figure 7 – A shape complementarity approach, with the shape of the ligand and the macromolecule being fitted for interactions according to their geometry. [55] ... 14
Figure 8 – Best docking conformations obtained between the pre-miR-149 G4 structure and a) Pyridostatin; b) Phen-DC3; c) C8; d) C8-NH2; e) L-arginine; f) [32]phen2N4; g) [16]phenN2. Ligand shown in orange for each case, hydrogen bonds shown in red. ... 29
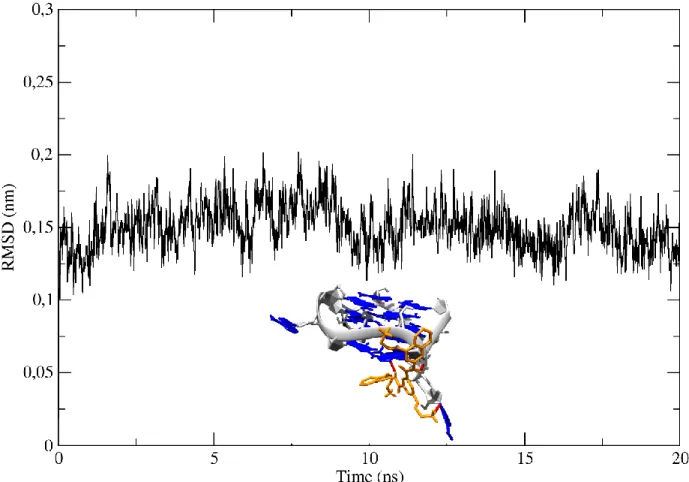
Figure 9 – RMSD graphs of the ligand a) Pyridostatin; b) Phen-DC3; c) C8; d) C8-NH2; e) L-arginine; f) [32]phen2N4; g) [16]phenN2, quadruplex and complex throughout the simulation. Ligand-quadruplex complex RMSD shown in black, G4 in red, ligand in green ... 32
Figure 10 – Representative structure of the main cluster of structures of the ligand pyridostatin MD run. ... 34
Figure 11 – Representative clusters of the ligand Phen-DC3. ... 35
Figure 12 – Representative clusters of the ligand C8. ... 37
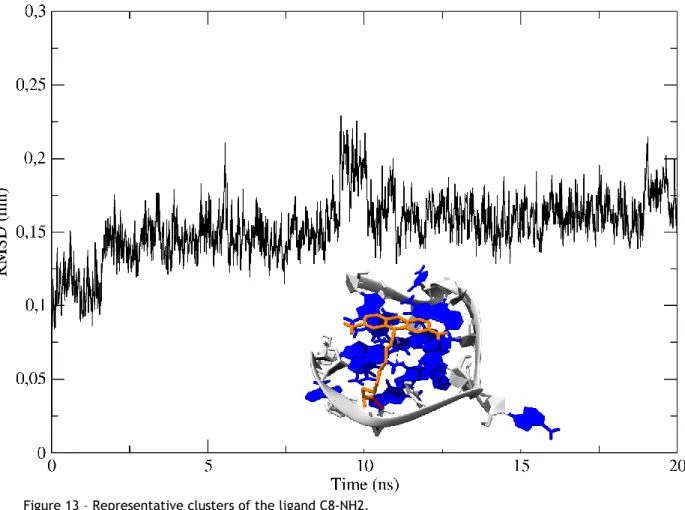
Figure 13 – Representative clusters of the ligand C8-NH2. ... 38
xii
Figure 15 – Representative clusters of the ligand [32]phen2N4. ... 40
Figure 16 – Representative clusters of the ligand [16]phenN2. ... 41
Figure 17 – Spectral data (left) and melting temperature variation spectra (right) for K+. ... 44 Figure 18 – Spectral data (left) and melting temperature variation spectra (right) for Na+. .. 45 Figure 19 - Spectral data (left) and melting temperature variation spectra (right) for pyridostatin. ... 46 Figure 20 - Spectral data (left) and melting temperature variation spectra (right) for C8. ... 47 Figure 21 - Spectral data (left) and melting temperature variation spectra (right) for C8-NH2. ... 47 Figure 22 - Spectral data (left) and melting temperature variation spectra (right) for [16]phenN2. ... 48
Figure 23 – Fluorescence emission spectra of C8-NH2. Fitting graph is shown at the top right corner. ... 50 Figure 24 - Fluorescence emission spectra of C8. Fitting graph is shown at the top right corner. ... 51 Figure 25 - Fluorescence emission spectra of [16]phenN2. Fitting graph shown near the top left
corner. ... 52 Figure 26 – NMR spectra of the C8-NH2 ligand bound to Sepharose 6B. ... 54 Figure 27 – Chromatographic spectrum for every sequence tested. Every sequence shown in different color, with retention times shown at the top of each peak. ... 55
xiii
Tables List
Table 1 – Binding energy, in kJ/mol, of the most favorable ligand-quadruplex complexes obtained in AutoDockTools. ... 28 Table 2 – Binding energy obtained per ligand, in KJ/mol. Presented in the same order as the previous one. ... 42 Table 3 – Melting temperature variation values obtained per ligand ... 49 Table 4 – Dissociation constants (KD) per ligand. ... 52
xv
Acronym List
A Adenine
A-DNA A-form of DNA B-DNA B form of DNA
bp Base pairs
C Cytosine
C8 10-(8-(4-iodobenzamide)octyl))-3,6-bis(dimethylamine) acridinium iodide
C8-NH2 3,6-diamino-10-(8-aminooctyl)acridin-10-ium
CD Circular dichroism
c-Kit V-kit Hardy-Zuckerman 4 feline sarcoma viral oncogene homolog
cm centimeter
c-Myc V-myc avian myelocytomatosis viral oncogene homolog DNA Deoxyribonucleic acid
Duplex DNA double strand
EDTA Ethylene diamine tetra-acetic acid
G Guanine
g gram
G4 G-quadruplex
h hours
kbp Kilo base pairs
KD Affinity constant
KRAS Kirsten rat sarcoma viral oncogene homolog
L liter ln linear M Molar min Minutes mL milliliter mM Millimolar
mRNA Messenger RNA
NMR Nuclear magnetic resonance
ºC Celsius
pre-miR-149 Pre micro RNA-149 RCF Relative centrifugal force RNA Ribonucleic acid
rpm Rotations per minute
Tris Tris(hydroximethyl)methylamine UV Ultraviolet light
xvi
μg microgram
1
Chapter I
Introduction
1.1 - DNA history
The history of DNA began in 1869, when Friedrich Miescher successfully isolated the hereditary material. Miescher, a Swiss Physician who did not have enough recognition, discovered DNA by accident upon isolating it from leucocytes, and termed it “nuclein”, as it was obtained from the nucleus of cells. Further analysis on the precipitated “nuclein” revealed the molecular building blocks of DNA, with high amounts of phosphorous. He also believed that nuclein played an important part in fertilization, but due to the low information at the time, he was unable to determine the biological implications of his discovery. [1]
Other scientists followed up Miescher’s work by attempting to discover the chemical nature of “nuclein”. The most prominent was Phoebus Levene, a Russian physicist turned biochemist. A prolific researcher, Levene discovered many new things about nucleic acids, namely, the structure of a nucleotide (phosphate-sugar-base), the carbohydrate components of RNA and DNA (ribose and deoxyribose, respectively), and most importantly, a “polynucleotide” model of the structure of nucleic acids. [2]
Around 75 years later, in 1944, Oswald Avery, along with his colleagues Maclin McCarty and Colin MacLeod, delivered the next discovery in this area. Upon doing numerous experiments involving a “transforming principle” in pneumococcus bacteria, they concluded that this transforming principle consisted of desoxyribonucleic acid, or DNA. In other words, unlike what was currently believed at the time, genes consisted of DNA, not protein. [3]
Chargaff built upon this knowledge by inventing a new paper chromatography method, which allowed him to separate and identify small amounts of organic material. This allowed him to discover two important facts about DNA: the fact that different species had different nucleotide compositions, and that, regardless of species, the amounts of adenine and thymine was often equal, as well as the amounts of guanine and cytosine (first parity rule of Chargaff). [4] Over the next years, genes began to undergo a paradigm shift in the minds of researchers the world over. Prominent researchers, such as Nobel-Prize-winning physicist Erwin Schrödinger, Kurt Stern, Erwin Chargaff began to argue the role of genes as a “code”, a means of “transmitting information” – partly due to that being the main paradigm in the scientific world during and after the Second World War. [5]
2
In 1953, Watson and Crick delivered the next piece of the puzzle by revealing the structure of DNA. Based on the previously described works, as well as important X-ray crystallography studies performed by Maurice Wilkins and Rosalind Franklin, the authors discovered the famous double helical structure of DNA. [6]
This structure has been further studied by other scientists, who discovered different conformations of the double helix. The most common conformation discovered by Watson and Crick in living cells was the B-DNA. There are other conformations, namely A-DNA (a dehydrated conformation seldom found in normal biological circumstances) and Z-DNA (a left-handed conformation that often comes about temporarily as a response to some biological activity). [7] In 1910, a German chemist named Ivar Bang, discovered that guanylic acid forms a gel at certain concentrations. More than 50 years later, in 1962, Gellert and colleagues determined the molecular structure that resulted of that gel. X-ray diffraction studies revealed it to consist of tetrameric units assembled into large helical structures, more specifically consisting of four guanine residues connected by cyclic hydrogen bonds at the center. The overall structure is helical, with 4 units per turn of helix. [8]
After this discovery, there were few others until the late 1980’s, when Elizabeth Blackburn discovered that telomeric DNA could form non-Watson Crick structures, with guanine-guanine base pairs, with much relevance for telomere function. [9] After that, James Williamson and others raised considerable interest in this area, when they discovered that some telomeric sequences in Oxytricha and Tetrahymena could form G-quadruplexes (G4)s in certain ionic conditions. [10] Since then, the interest in this area has grown.
1.2 - Definition and structure of G-quadruplex (G4)
G-quadruplexes (G4)s are DNA/RNA single-stranded secondary structures, formed by guanine-rich sequences. These structures are a result of the self-stacking of G-quartets (4 guanines arranged in a planar quartet, where every base is connected to 2 others through Hoogsteen base pairing).
The G4 are stabilized by monovalent ions (K+ > Na+ > NH
4+ > Li+, in decreasing order of strength
of stabilization), as long as the ionic radius fits inside the G4 core. The ions intercalate into the anionic core of a G-tetrad, as well as bind between quartets, in order to stabilize the structure. The larger the ion, more oxygens can coordinate, and enhance the stabilizing effect. [11]
3 Figure 1 – The arrangement of guanine bases in a G-quartet, with a centrally placed metal ion. Adapted from [12].
The G4 structure can be defined according to numerous parameters, mostly being: number of strands involved, helical parameters of twist and rise, backbone strand polarity, connecting loop length and type, guanine glycosidic angles, groove widths and the nature of the ion channel. [12], [13]
A G4 is formed by one, two or four strands of DNA (or RNA), being respectively classified as monomeric, dimeric or tetrameric. Overall, a G4 consists of at least two stacked G-quartets, bound by loops consisting of mixed-sequence nucleotides not involved in the tetrads directly. Unimolecular G4s usually can be described with the expression Gm Xn Gm Xo Gm Xp Gm, where m
is the number of residues in each G tract, and Xn, Xo, Xp can be any combination of residues
(including G) forming the loops. Di-molecular and tetramolecular G4s are less studied, but usually follow similar rules, except for the fact that the sequence of each strand does not necessarily have to be equal (though they often are).
The backbone polarity of any G4 refers to whether the strands are parallel or anti-parallel. If a single strand is anti-parallel to the others, the G4 has an antiparallel polarity, and otherwise, it would be parallel. Depending on the polarity, the G4 may end up adopting different loop types.
Parallel polarities exhibit propeller loops. These loops, also called “double chain reversal” have a shape, as the name indicates, like a propeller. Antiparallel polarities have two more loop type possibilities, in addition to propeller loops. They can also have lateral or edgewise loops (which join adjacent G4s strands). These loops can be located on the same or different faces of a G4, and the polarity of these strands may vary, as long as one of them is anti-parallel. The
4
other loop type is the diagonal loop, which joins opposing G4 strands. In this type of loop, there is always one anti-parallel strand and a parallel one.
Guanine glycosidic angles also tend to vary between different types of G4s, more specifically, due the strand polarity of the G4. In parallel G4s, every guanine glycosidic angle is in an anti conformation. Anti-parallel G4s can have both syn and anti glycosidic angles, although the arrangements of these angles depend on the topology and set of strand orientations of the G4, since the positions of the four strands in any topology differ between themselves.
Every G4 structure has four grooves, which are defined as the cavities bounded by the phosphodiester backbones. Their dimensions vary, according to the G4 topology and loop type. On G4s with only lateral or diagonal loops, the grooves are structurally simple, with walls bounded by monotonic sugar phosphodiester groups. G4s with propeller loops are more complex however, with more complex structural features, since the variable sequence loops are inserted into the grooves.
Regarding the ion channel, as was mentioned, G4s require monovalent cations in order to be formed and maintain stability. This is due to a strong negative electrostatic potential created by the guanine O6 oxygen atoms, forming a central channel which contains the ions in the center of the G-tetrad stack. Depending on the nature of the ion, their placement in the channel is different.
K+ ions for instance are always equidistant from each tetrad plane, making the eight oxygen
atoms assume a symmetrical tetragonal bipyramidal configuration. Na+ ions on the other hand
are on a plane with the G-tetrads. [12], [13]
Figure 2 – Different G4 structures, according to number of strands, strand polarity, and ion channel nature. Adapted from [14].
5
1.2.1 - RNA G4s compared to DNA G4s
RNA G4s are different from DNA G4s in many ways. Firstly, the structure observes the same differences that exist between DNA and RNA in their natural forms, with the replacement of thymine for uracyl, and that of the deoxyribose sugar for a ribose sugar, respectively.
The presence of the extra 2 – OH’ group in the ribose sugar results in more intramolecular interactions, as well as an added likeliness of bringing in more water molecules, making the structure more stable when compared to DNA G4s. The presence of uracyl instead of thymine in RNA G4s presumably also has an important stabilizing effect, as it improves the stability and decreases the hydration within the loop around the grooves. These factors make it so that RNA G4s have a greater thermodynamic stability, as well as being more compacted and less hydrated than DNA G4s.
Figure 3 - Differences between DNA G4s and RNA G4s. Adapted from [15]
1.3 - Biological relevance of G4
There are guanine-rich domains in many regions of the human genome. This raises the possibility of these regions containing sequences that could form G4s. Huppart and Balasubramanian investigated how many sequences that could potentially form G4s, dubbed putative G4 sequences (PQS), existed in the human genome. They devised a “folding rule”, which could determine whether it could form a G4 structure or not. By using an algorithm they created, the “quadparser”, they identified 188.836 G-patterns and 187.610 C-patterns (a G-pattern in a complementary strand), which add up to 376.446 PQS throughout the entire human genome. [14] Remarkably, many of these PQS are not in random regions of the genome, but rather in specific ones, such as telomeric DNA, promotor regions of oncogenes, untranslated regions of RNA and immunoglobulin class switch regions. [15]
6
This would suggest that G4s are connected to many biological processes, predominantly around DNA replication and transcription, and indeed, many studies have confirmed it. Thus, G4s present themselves as important targets to improve genome stability andcontrol gene expression. [16]
One of the primary ways they are targeted is through the use of G4 ligands. These ligands are small synthesized or natural molecules that have high affinity and preference for the G4 structure over other DNA structures. They can bind to the G4 structure in a multitude of ways, that fit into three types: stacking, groove binding, or mixed binding (a mix between the two previous binding modes). They can affect the biological function of G4s in many ways. [17] In regards to G4s abilities as a transcription regulator, several studies have shown that G4 motifs in the promotors of a certain gene can be targeted in order to modulate the transcription of the gene. Whether these changes are caused by G4 stabilization and subsequent mediation effects on the gene, or whether G4-ligand binding causes DNA damage is unclear however. [18] Several studies revealed that the physiological role of G4s in diseased states is altered such as in cancer. For instance, many hallmark genes of cancer have their expression regulated by RNA G4s. As such, it has been suggested that these structures could pose an interesting therapeutic target for diagnosis and therapy of cancer, as well as other diseases, such as immune deficiency and development disorders. [19]
Certain studies suggest that G4s play an important role in maintaining DNA stability, as they can impede the progression of DNA polymerases. Further studies reveal that cancer genomes likely possess more G4 structures than normal ones, increasing their potential value as either cancer biomarkers and/or therapeutic agents. [18]
Indeed, Cogoi et al. suggested that some guanine-rich domains in an human oncogene, KRAS, exist in an equilibrium between a double-stranded and a folded G4 form. The G4 form inhibited the transcription of the gene, while the double-stranded form promoted it. Inhibiting the transcription of an oncogene carries an enormous potential in being able to prevent the progression of cancer. [20] Many important oncogenes, such as c-kit, c-myc and bcl-2 have already been singled out as potential targets for such therapies, with promising early results. [21]–[24]
Another possible way in which G4 can play a part in antitumor therapies is the inhibition of telomerase. This enzyme is overexpressed in cancer cells, with an activity that is 85-90% higher in cancer cells than in normal cells. The principle of this approach is that, by stabilizing the G4 structure that can be formed in many telomeric DNA sequences, telomerase activity can be inhibited, thus halting cancer growth. [25]
7 Figure 4 – The formation of a G4 structure by stabilizing it with a ligand inhibits telomerase activity. Adapted from [26].
Another way in which G4s can play a part in anticancer therapies lies in processes involving microRNAs (miRNAs). These miRNAs consist of short RNA sequences that play an important role in regulating gene expression, as well as maintaining the homeostasis of the cell. Their biogenesis involves Dicer-mediated cleavage, and this step is critical for the regulation of miRNA levels at a cellular level, with many disease conditions, such as cancer, being correlated with faulty regulation. [26], [27]
The biogenesis of miRNA involves a series of highly coordinated enzymatic cleavages that convert the primary forms of miRNAs (pri-miRNA) to a premature intermediate form (pre-miRNA), and finally into the final miRNA form. Pre-miRNAs assume a stem-loop/hairpin form, and this form is recognized by Dicer, which then proceeds to cleave it. If the stem-loop structure is somehow modified, as is the case of the G4 forming pre-miRNA sequence, the ensuing Dicer activity is significantly reduced. As such, there is a lower miRNA formation, and their regulatory effects are unremarkable. Thus, these pre-miRNAs are considered very good targets for therapeutic action against diseases caused by the aforementioned deregulations. [26], [27]
Arachchilage et al. tested what were the effects that the G4 formation has on the stem-loop structure of the pre-miRNA. Firstly, they identified 298 pre-miRNAs with a high likelihood of developing a G4 structure. They determined that in the presence of K+, as opposed to the
absence of the same ion, or the presence of Li+, the G4 is formed, and there is an ensuing
increase in the cleavage of the pre-miRNA. This proved that there is an unwinding of the stem loop structure when the G4 is formed. These findings suggest that the formation of G4s could indeed be related to pre-miRNA maturation, and thus could play a significant role in normal
8
cellular functions, as pre-miRNAs are involved in the silencing of many genes, such as cancer suppressor ones. [26]
1.4 - G4s aptamers
Oligonucleotide aptamers are a class of nucleic acids that bind to various targets. So far, they have shown great potential in being able to diagnose and/or treat several diseases. They are similar to antibodies in this regard, but show numerous advantages, such as their stability at room temperature, and low immunogenicity and toxicity. [28]
Some G4 aptamers have shown great potential as effective therapeutic agents, with promising anticancer and anti-HIV activity. For example, the G4 aptamer AGRO100 (also called AS1411) is a 26-mer oligonucleotide which forms a mixture of G4 structures and has cancer selective anti-proliferative activity, as it binds to nucleolin, a protein highly present in the surface of cancer cells. Numerous research groups have used it as a targeting agent for cancer cells, using it to deliver nanoparticles, oligonucleotides, and small ligands into them. [29]
The aptamers T30695 and 93del can inhibit HIV-1 integrase in vitro, being regarded as potential anti-HIV therapeutic agents. Both AGRO100 and T30865 were found to be hemin-binders, increasing their range of biomedical applications. [30] Thrombin-binding aptamers (TBAs), the most widely studied G4 forming aptamer class, can bind to α-thrombin, which can help to prevent thrombosis, and G4 stability and conformation details contribute greatly to the pharmacological properties of these aptamers. [31]
These aptamers’ properties can be improved in many ways, such as by changing the backbone, sugars and bases of the aptamers in specific locations in the chain. [32] Overall, the biophysical and biological properties of the aptamers have been determined to stem from the G4s conformation and stability. [33]
1.5 - Targeting the G4 with small ligands
As abovementioned, many possible anticancer, anti-HIV, and other therapeutic strategies rely on the stabilization of G4 structures. Additionally, the stabilization of the aptamer’s G4 structure may enhance its biological properties.
Many G4 binding ligands have been identified as having potential antiviral activity, such as: Braco-19 (which has shown anticancer activity in vivo via telomerase inhibition, along with antiviral activity against EBV and HIV-1), TMPyP4 (which also shows similar activities, despite being less selective than Braco-19), perylenes and naphthalene diimides (very versatile, suitable for chemical modifications to improve their pharmacological properties), pyridostatin (with excellent specificity to G4s but not duplex-DNA, also shown to have excellent anticancer properties in cell lines, along with antiviral applications against EBV) and bisquinolinium
9
derivatives (Phen-DC3, the best representative of this class has shown antireplicative activity against EBV and KSHV). [34]
Different ligands bind to G4 structures in different ways, as presented in Figure 5. The most frequently found binding mode is end-stacking, which many ligands adopt, such as porphyrins, telomestatin, cyanine dyes, quinazoline derivatives and others. Another form of binding often reported is groove-binding, with BMVC, distamycin-A, and other ligands, although they are fewer in number than the end-stackers. [35]
Figure 5 – The different binding modes in a ligand-G4 complex, with (from left to right) external stacking, intercalating and groove binding. [37]
One of the main challenges in targeting G4s with small ligands in vitro is that the ligand must bind exclusively to the G4 structure, perhaps only to a certain sequence, while avoiding G4s with different sequences and duplex DNA that may be present in far more abundant quantities. G4s are very geometrically different from B-DNA, and molecules tend to bind with the later via intercalation with the base-pairs, groove-binding, and electrostatic interaction with the backbone. [36]
Throughout the past 20 years, different ligands have been studied, with different properties. [37] One of the main parameters used to classify them comes from their elemental components – mostly, they are either organic or metal-based. Within these groups, they are also classified based on other parameters, such as, for organic ligands, ring structure or positive charge introduction into the scaffold, or in the case of metal ligands, the geometry and type of metal present in the ligand. [37]
1.6 - G4 structure and binding characterization
There are many techniques that can be used to study G4s’ structure, and its interactions with a ligand, in order to evaluate thermodynamic, conformational, and other aspects of the ensuing G4-ligand complex. [18]
10
In the context of this dissertation, we focused on biophysical essays, namely circular dichroism and fluorescence spectroscopy. High-resolution magic angle spinning (HRMAS) NMR technique was also used for characterizing the chromatographic support. Finally, affinity chromatography was used to compare the retention times of different G4-forming sequences, and a duplex sequence using the affinity ligand C8-NH2. Those techniques will now be approached on a
theoretical basis.
1.6.1 - Circular dichroism spectroscopy
Circular dichroism is a commonly used technique for studying many areas of G4s, such as their structure and polymorphisms, cation effect, thermal denaturation, and ligand binding. It is a robust, easy to use, and requires only small amounts of nucleic acid, as low as 25µg. [38],[39] This technique was developed in the second half of the last century with the goal of assigning an absolute configuration of chiral molecules and has now become a means to study subtle conformation changes and supramolecular interactions. [40] It relies on irradiation of either a chiral or achiral complex in a chiral environment with circularly polarized light. With the passing of the light through the sample, there is a differential absorption of right- and left-handed circularly polarized light, resulting in a CD absorption spectrum or signature. [41]
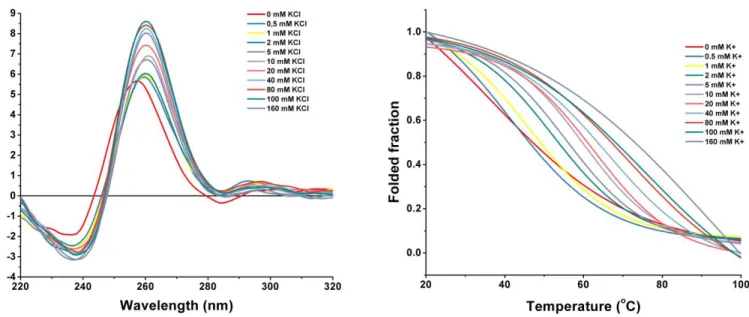
The G4 structure assumes different topologies and have peaks characteristic to them. For example, G4s with an antiparallel topology show a strong negative peak around 260 nm and a strong positive peak at around 295 nm. G4s with a parallel topology show a weak negative peak around 240 nm and a strong positive peak around 260 nm. Some G4s have mixtures of both topologies, called hybrids, in which case the values just described are in a mixture of the above. Circular dichroism can also determine the effects of ligand binding on the G4 structure. Depending on the changes of the G4 spectra after ligand binding, data about the stability of the structure can be inferred. If the peaks in the spectra remain unchanged or undergo enhancement, the ligand can be assumed to have stabilized the structure. If the peak positioning changes somehow (peaks partially/completely disappear, new peaks appear), then the ligand either destabilized the structure or changed it into a new topology. [42]
Melting studies are another way of determining the stability of a complex formed by a G4 and a ligand. These consist of monitoring the absorbance of polarized light at the maximum wavelength of the G4 as the temperature is slowly increased, causing the denaturation of the structure, and a subsequent absorbance decrease. A ligand has a greater stabilizing effect on the G4 the more the melting temperature increases. [43]
1.6.2 - Fluorescence spectroscopy
This technique is based on the physical phenomenon of fluorescence. It consists on the emission of a photon upon relaxation from an electronically excited singlet state after the absorption of
11
a photon by the fluorescent molecule, the fluorophore. This emission process happens much slower than the absorption, meaning that many parameters can alter the fluorescence emission spectrum. Fluorescence, due to its sensitivity to the fluorophore environment, is the most efficient optical spectroscopy to follow ligand binding activity, and shares characteristics with other optical spectroscopies, like being quick, not destructive, not expensive, and requires much lower macromolecule and ligand concentrations compared to other techniques. [44] Many G4 ligands show intrinsic fluorescence activity and usually, that activity changes upon binding to a G4 structure. As such, titration experiments can allow one to track the ligand’s fluorescence activity as a function of G4 concentration. By obtaining the ligand’s fluorescence intensity at the maximum of its emission spectrum, and by plotting it against G4 concentration, a binding curve is obtained. Upon fitting that curve to a suitable binding model, the binding stoichiometry and affinity constant can be obtained. [45]
This method has some disadvantages however. For instance, the changes in fluorescence upon G4 binding are not correlated with the ligand binding mode in a simple way. Often, further experiments are necessary in order to better understand the binding mode occurring in the G4-ligand complex. [44]
1.6.3 - High-resolution magic angle spinning (HRMAS) NMR technique
One method for structure elucidation of the support is High-resolution magic angle spinning (HRMAS) Nuclear Magnetic Resonance (NMR) spectroscopy. This technique overcomes weaknesses of Solution-state NMR, such as not working with large proteins, membrane proteins, or protein complexes as these situations would lead to broadening or disappearance of resonances. This technique overcomes this drawback by spinning the sample at a “magic angle”, leading to broadening resonances (caused by dipolar coupling and chemical shift anisotropy) disappearing. [46]
There are numerous examples in the literature of this technique being used to determine if molecules are immobilized in a matrix. [47] For this work, this technique was used to evaluate if the ligand C8-NH2 is immobilized in a previously activated Sepharose medium. [48]
1.6.4 – Chromatography experiments
Affinity chromatography is a method to separate a molecule/group of molecules from complex mixtures, relying upon specific interactions between the target molecules and a chromatography support. The stationary phase is functionalized with specific molecules (the ligand) while the target molecule is part of the complex mixture, in a mobile phase. The target binds to the ligand in a step called the “capture step”, while the remaining components of the mixture are washed and eluted. This allows for the recovery of the desired molecule, and thus, this processed was often used either for the purification of samples, to concentrate substances
12
present at low concentrations, and separating proteins based on biological function. Recently, this process has become a prized method to study biological interactions. [49]
Chang et al., for instance, used affinity chromatography to test the retention times of different G4 sequences with 4 different affinity matrixes, deducing many important characteristics of G4-ligand binding, such as the role of π-π stacking interacting in selective isolation of G4s, and electrostatic interactions between DNA and matrix. [50] Musumeci et al. created a technique for the screening of G-quadruplex ligands that could be reused several times without loss of efficiency and reproducibility, with promising results. [51]
Thus, affinity chromatography is established as a promising method to examine the interactions between the C8-NH2 support and different G4 sequences versus duplex.
1.6.5 - Docking
Molecular docking has gained much relevancy in the design of new drugs but can also be applied to other purposes. For instance, it can help determine which among a list of ligands would be best suited for a certain macromolecule by comparing binding energies. [52]
Molecular docking is an approach to bioinformatics modelling that simulates the interaction of two or more molecules. It can be done in many ways, but most of them share some elements between them: there is a receptor and a ligand, sampling, and scoring functions. [53]
Overall, the docking process consists of predicting the conformation and orientation of a ligand in a targeted binding site. There are a few parameters involved in this, however, identifying the molecular features responsible for specific biological recognition, and simulating them on a computer is verychallenging. Thus, the process is often split into multiple steps. First, docking algorithms pose the ligand in an active site, sampling the degrees of freedom of said ligand to identify the conformation that best fits the receptor structure. The algorithms are assisted by scoring functions, which are design to evaluate the interactions between ligands and targets and predict ensuing biological activity. [54] There are two different approaches by which the ligand/macromolecule binding activity can be explored, which are, the simulation approach and the shape complementarity approach. Afterwards, sampling algorithms and scoring functions will be approached in more depth.
In the simulation approach, seen in Figure 6, the ligand and target are separated by physical distance, and the ligand is then allowed to bind to the target, through moves in its dimensional space (these moves can be internal, through torsional angle rotations, or external, with translations and rotations of the ligand). The binding energy is calculated in the amount of moves the ligand must do to bind to the ligand in a stable conformation. This approach better reflects ligand flexibility but takes more time and
13 Figure 6 – Two adducts in a simulation approach, with the ligand and target separated by some distance, interacting through H-bonds. [55]
The shape complementarity approach considers the macromolecule and the ligand as a set of features that make them dockable, such as molecular surface descriptors. The macromolecule’s accessible surface area and the ligand’s matching surface description are used for shape-matching, to find a complementary pose that fits them together. This approach is much faster, simpler and less computationally taxing to use, but it often does not portray any dynamic changes in the macromolecule/ligand conformations, such as their movement, or ligand’s flexibility. [55]
14
Figure 7 – A shape complementarity approach, with the shape of the ligand and the macromolecule being fitted for interactions according to their geometry. [55]
The amount of possible binding modes between a ligand and a macromolecule, considering the six degrees of translational and rotational freedom, as well as the conformational degrees of freedom of both, is tremendous. As such, it would be too computationally demanding to generate every possible conformation. Sampling algorithm help to narrow down the best ones and can do so in a variety of ways. We will explore Matching Algorithms (MA), Incremental Construction (IC) methods, Multiple Copy Simultaneous Search (MCSS) methods, LUDI, Monte Carlo methods, Genetic Algorithms (GA), and Molecular Dynamics (MD).
MA’s are based on molecular shape, matching a ligand into an active site of a macromolecule in terms of shape features, such as distances between the atoms of both molecules, which are considered pharmacophores in this method, and chemical information, such as hydrogen-bond donation and acceptance from both parts. These algorithms are fast, and available in a variety of programs (DOCK, FLOG, LibDock, etc.).
IC methods insert the ligand into an active site in a more fragmented and incremental fashion. The ligand is broken up into several fragments, via breaking its rotatable bonds and inserting those fragments into the docking site first one at a time. The biggest fragment, or the piece with more significant functional role or interaction with the macromolecule is placed first, and the remaining fragments are added incrementally, with different orientations, reflecting the flexibility of the ligand.
15
MCSS and LUDI also follow a fragment-based approach. MSCC makes many copies (1000 to 5000) of a functional group and places them randomly in the binding site of interest, subjecting them to simultaneous energy minimization and/or quenched molecular dynamics in the forcefield of the macromolecule (none of the copies interact with each other, only the macromolecule). Based on the interaction energies, favorable binding sites and orientations are mapped. The process is repeated with different functional groups, resulting in a different map. Molecules that match the binding site perfectly are thus designed. LUDI focuses instead on hydrogen bonds and hydrophobic contacts formed between the ligand and the macromolecule, and generates interaction sites (positions in space suitable for the formation of hydrogen bonds and filling hydrophobic pockets) by searching databases or using the rules. Fragments of functional groups are then fitted to those sites, and then collected to form a single molecule.
Monte Carlo methods and GA’s fit under a broader term of stochastic methods, which search the conformational space by randomly modifying a ligand conformation or a population of ligands. Monte Carlo for instance generates poses for the ligand through bond rotation, and tests the conformation achieved with an energy-based selection criterion. If it passes the test, it is saved and modified further, until a certain pre-determined number of conformations is achieved. GA’s, which stem from Darwin’s theory of evolution, encode degrees of freedom of the ligand into binary strings called genes, making a “chromosome” which represents the pose of the ligand. “Mutations” (where the genes change randomly) and “crossovers” (in which genes get exchanged between chromosomes) then occur, resulting in new structures, which get assessed by scoring functions. If they survive, they move on to the next generation.
MD is used as a simulation approach, being one of the most powerful of that kind in the field of molecular modeling. It consists of moving every atom of each molecule separately and assessing the resulting structure stability according to scoring functions. It is the method that most reliably represents the flexibility of the ligand and macromolecule in comparison with other methods, but progress in very small steps and are very computationally demanding. [56] There are many different kinds of scoring functions, with them being divided as force-field based, empirical and knowledge-based. Force-field-based scoring functions assess the binding energy by calculating the sum of non-bonded interactions, such as van der Waals and electrostatics. Empirical scoring functions decompose binding energy into several energy components (hydrogen bonds, ionic interaction, hydrophobic effect and binding entropy). Knowledge-based scoring functions use statistical analysis of already produced crystal structures, based on the principle that the more stable a structure is, the greater the frequency of outcome. [56]
16
1.7 - Work summary
Based on the aforementioned data, we can divide the following work in three parts: i) performing computational docking and molecular modelling analysis on seven promising ligands identified in the literature, to determine their binding modes and most importantly affinity to a predetermined G4-forming sequence; ii) performing biophysical assays to test the binding affinity of the same G4-forming sequence and ligands; and finally, iii) concluding as to the efficacy of using molecular modelling to draw experimental conclusions as towards the binding affinity of ligands.
By using widely available chemical sketching and rendering software, we can simulate the 3D structures of seven ligands and the pre-miR-149 G4 structure computationally. Through molecular docking and molecular dynamics simulation software, we simulate docking interactions between each ligand and the G4 structure, to determine the most favorable binding site, conformation, and pose the ligand can assume while binding to the G4. Most importantly, the free binding energy, which can be used as a measure of the binding affinity between the ligand and G4 can also be obtained. Ligands would be ranked in accordance with their binding energy values, and thus, their affinity towards the pre-miR-149 G4 structure.
Next, biophysical techniques, such as circular dichroism and fluorescence assays are used to test the ligand-G4 binding affinity in an experimental setting. Affinity chromatography experiments could be used to determine if some of the ligands explored could also be used as ligands towards other G4-forming sequences. At the end, ligands would be ranked according to their binding affinities to the G4 structure, as they were in the docking tests. As these results would be experimental, and thus, far more reliable, comparisons could be drawn between the results obtained via docking and molecular dynamics simulations and those obtained experimentally.
The last part would involve assessing these comparisons, and determining whether molecular modelling techniques could be used in the future as reliable methods to determine ligands’ binding affinities towards this or other G4 structures in the future, opening new areas of investigation in this topic.
17
Chapter II
Objectives
The main objective of this dissertation is summarized as follows: test seven different ligands using both computational and biophysical methods in order to determine which have the best binding affinities to the pre-miR-149 RNA G-quadruplex.
This will be approached in the following steps:
1. Computationally generating the structure of a predetermined G4-forming sequence (pre-miR-149) and seven potent ligands described in literature;
2. Running docking simulations between each ligand and the G4 structure, obtaining the best conformation, binding site and free binding energy for each ligand;
3. Running molecular dynamics simulations with each ligand and the G4 structure, to obtain presumably more realistic binding conformations and energy;
4. Using circular dichroism spectroscopy and melting studies to determine the ΔTm ,
5. Using fluorescence spectroscopy techniques to determine the binding affinity between each ligand and the G4 structure;
6. Using affinity chromatography technique to determine if the ligand C8-NH2 retains G4
structures with similar or different conformations;
7. Comparing the binding affinity values obtained from the two different techniques and comparing them to the ones obtained via docking;
19
Chapter III
Materials and Methods
3.1 - Materials
All oligonucleotides were obtained from Eurofins MWG Operon (Ebersberg, Germany), STAB VIDA Genomins Lab (Lisbon, Portugal) and Eurogen ech (Leven, Belgium). The following oligonucleotide sequence used was a DNA sequence, with the following sequence of nucleotides: GGGAGGGAGGGACGG. Stock solutions of approximately 500 µM were prepared using Milli-Q water and stored at -20°C until used. The synthesis and purification of 10-(8-(4-iodobenzamide)octyl))-3,6-bis(dimethylamine) acridinium iodide (C8) and
3,6-diamino-10-(8-aminooctyl)acridin-10-ium (C8-NH2) was performed as described by Pereira et al. [57].
[16]phenN2 and [32]phen2N4 were synthesized as described in previous work [58] [59]. Stock
solutions of the ligands were prepared as 10 mM in DMSO. The dilutions for fluorescence and affinity chromatography were done using an annealing buffer, consisting of 100 mM KCl, 30 mM phosphate buffer (15 mM potassium hydrogen phosphate + 15 mM dihydrogen phosphate).The dilutions for dichroism were done using an annealing buffer, consisting of 2 mM KCl.
3.2 - Methods
3.2.1 - Synthesis of affinity chromatography supports
The affinity chromatography support synthetized was C8-NH2 Sepharose, obtained through the
immobilization of C8-NH2 ligand to the bifunctional oxiranes.
The following steps to produce both supports are:
i) Sepharose activation
Sepharose quantity between 3.5-5 g was weighted and washed on a glass-filter funnel with 500 mL of milli-Q water. For every gram of Sepharose, 1 mL of diglycidyl ether, and 1 mL of a 0.6M sodium hydroxide solution, containing 2 milligrams of sodium borohydride for every sodium hydroxide millilitre was mixed. This suspension was then kept in continuous rotation overnight (>15h) at 25ºC, and then washed with at least 500 mL of milli-Q water on a glass-filter funnel.
ii) Coupling
The ligand C8-NH2 was dissolved in a coupling buffer, consisting of a 2M sodium carbonate
20
medium in a vessel, which was then placed in continuous rotation for 5 days, at 50ºC and 135 rpm.
3.2.2 - Circular dichroism (CD) spectroscopy
CD spectra were obtained in a Jasco J-815 spectrometer (Jaco, Easton, MD, USA), using a Peltier temperature controller (model CDF-426S/15). The induction of G4 formation was assessed by titrating the sample with increasing concentrations of NaCl and KCl, and the quartz rectangular cell used for such purposes had an optical path length of 0.1 cm.
The spectra were acquired at 20ºC using an instrument scanning speed of 10 nm min-1 with a
response time of 1 s over wavelengths ranging from 220 to 340 nm. The recording bandwidth was 1 nm with a step size of 1 nm. Data was collected in quadruplicate, with the average values of the spectrum presented for each sample, after accounting for the buffer contribution. CD data was converted into ellipticity, and noise was smoothed by the Jasco J-815 software, including a fast Fourier transform algorithm, allowing the enhancement of the noisiest spectra without distorting the peak shape.
The CD melting experiments were performed at a temperature range of 20-100 ºC, with a heating rate of 2 ºC per min, monitoring the ellipticity at 260/265 nm.
Spectral acquisition was performed in the presence of 16 molar equivalents of a ligand. The resulting data was converted into fraction folded plots (theta) using the following equation:
𝜃 = 𝐶𝐷 − 𝐶𝐷𝜆
𝑚𝑖𝑛
𝐶𝐷𝜆𝑚𝑎𝑥− 𝐶𝐷 𝜆𝑚𝑖𝑛
With CD being the ellipticity of the monitored wavelength at each temperature, while CDmin
and CDmax are the lowest and highest ellipticity, respectively. Data points were fitted to a
Boltzmann distribution (OriginPro 2015) and the melting temperatures were determined from the two-state transition model using the first derivative method.
3.2.3 - Fluorescence spectroscopy binding studies
Fluorescence spectra were recorded using a Horiba FloroMax4 fluorometer equipped with a temperature control system. Samples and references were scanned using a quartz cuvette with a path length of 1 cm with a volume of 800 µL. All spectra were scanned with an integration time of 0.5 s, emission and excitation slit width of 10 nm, and a step size of 1 nm.
Of the seven different ligands, only four had fluorescence activity and could undergo this technique: [16]phenN2, [32]phen2N4, C8, C8-NH2. The G4 sequence was introduced into a 10mM
21
by a cooling period for 20 minutes in ice, in order to induce the formation of a G4 structure. The interaction of the G4 structure with the ligand was determined by measuring the fluorescence emission values in a titration of the ligand with increasing G4 molar equivalents. Data was corrected to account for the screening effect (the amount of excitation light absorbed by oligonucleotide at 221 nm).
The ligand [16]phenN2 was excited at 270 nm, and emission spectra were acquired between
285-600 nm. The ligand [32]phen2N4 was excited at 272 nm and emission spectra were acquired
between 285-600 nm. The ligand C8 was excited at 498 nm and emission spectra were acquired
between 500-700 nm. The ligand C8-NH2 was excited at 272 nm and emission spectra were
acquired between 530-700 nm.
Fluorescence intensity (F0/F) was plotted against DNA concentration and fitted to the
Stern-Volmer equation to determine binding constants using OriginPro 2017.
Two equations were used depending on the quenching mechanism and resulting curves. 𝐹0
𝐹 = 1 + 𝐾𝑆𝑉[𝑄]
𝐹0
𝐹 = 𝐴𝑒
𝐾𝑆𝑉[𝑄]
, where F and F0 are the fluorescent intensities of the ligand in the presence and absence of
the quencher, respectively, A is the amplitude, KSV is the binding constant and Q is the DNA
concentration.
3.2.4 – HRMAS NMR spectroscopy
All NMR experiments were performed at room temperature using a Bruker Avance III 400 operating at 400.15 MHz for protons, equipped with a 4-mm triple resonance (HNC) HR MAS probehead. Approximately 10 mg of the support sample was placed in a 4-mm MAS zirconia rotor (50 µL). Samples were spun at the magic angle at a rate of 4.0 kHz, and all spectra were acquired under field-frequency locked conditions using that probe channel with the spectrometer’s lock hardware. Spectra were processed using Bruker Topspin 4.1. Unless otherwise stated, all 1H NMR spectra were referenced internally to the residual 1H signal of DMF-d7, which also serves as the swelling agent for the polymer beads (∼0.05 mL). Carr-Purcell-Meiboom-Gill (CPMG) sequence with an echo time of 1.5 ms was used to suppress the broad signals of the polymer, experiments were acquired in 256 transients.
22
3.2.5 – Affinity chromatography
The chromatographic retention times of G4 and duplex sequences were determined through affinity chromatography experiments, performed on a standard 10 mm diameter × 200 mm length column, packed with 2.5 cm (approximately 2 mL) of epoxy-activated Sepharose CL-6B matrix and AO derivative C8-NH2 support. The experiments were performed at room
temperature in a column that was first equilibrated with in a buffer consisting of 10 mM Tris HCl buffer (pH 8.0) at 1 mL/min. A 200 µL volume (10 µg/mL) of the various oligonucleotides samples was loaded onto the column and it was applied a 10 min linear gradient from 0.075 M to 1.5 M KCl or NaCl. The absorbance of the eluate was continuously monitored at 260 nm.
3.2.6 - Molecular dynamics
3.2.6.1 - Model construction
A model of pre-miR-149 was constructed by modifying an existing human telomeric G4 structure (PDB ID: 4G0F), with the sequence AGGGTTAGGGTTAGGGTTAGGG. Using Swiss PDB Viewer, the starting sequence was edited to assume the pre-miR-149 sequence, without destroying the underlying structure. Thus, the thymine residues in positions 5, 6, 11, 12 and 17 were deleted, along with the adenine residue in position 1. The thymine residue in position 18 was mutated to an adenine, and the adenine residue in position 19 was changed to cytosine. In addition, since the starting sequence represents a DNA G4, whereas the final one is an RNA G4, the resulting pdb files were manually edited, adding an O2’ group to every C2’ group of every remaining nitrogen base. As many residues were removed, the structure was left unstable, and further molecular dynamics simulations were undertaken to stabilise it.
3.2.6.2- Model stabilization
The following molecular dynamics simulations were performed with Gromacs 2016.3.
After being submitted to the Amber94 forcefield (in order to generate a topology of the structure), the system was placed in a box containing TIP3P water molecules with an 8Å cut-off value. The total charge of the system was then neutralized by adding 13 K⁺ ions. A 1000-step energy minimization was performed, with the RNA fixed by 500 kcal mol⁻¹ A⁻², followed by a 5000-step minimization with no restraints. Equilibration was then performed. Firstly, a 100 ps equilibration was performed, under a modified Berendsen thermostat, in which the system was heated from 0 to 300 K, with 10 kcal mol⁻¹ A⁻² restraints on the solute, as well as position restraints. Another 100 ps of equilibration were done under both the aforementioned thermostat and a Parrinello-Raman barometer, to make sure that the system was stable under certain pressure conditions.
Finally, 20 ns of MD simulations were carried out, with no restraints on the molecule, in order to allow the structure to assume a form more naturally occurring, and the final structure
23
following that time period was then obtained and used as a starting point for any further experiments.
3.2.6.3 - Molecular docking
Molecular docking simulations were performed with AutoDock 4.0 and Autogrid 4.0, in conjunction with the graphical user interface AutoDockTools (1.5.6). The best conformation was then isolated, and molecular dynamics was performed with Gromacs, followed by cluster analysis, RMSD calculation and other tests.
A total of 7 ligands were tested: L-arginine, C8 and C8-NH2, [16]phenN2, [32]phen2N4, Phen-DC3
and pyridostatin.
The docking process performed with AutoDockTools consisted of two phases: setting the parameters for the process (which includes preparing the ligand and macromolecule for the process), followed by performing the procedure, and extracting the results.
3.2.6.3.1 - Parameter preparation
The G4 structure was pre-processed UCSF Chimera 1.11.2 prior to undergoing the docking procedure. Using the software’s “Dock Prep” tool, hydrogens were added to the structure in a histidine protonation state, Gasteiger charges were added and certain nomenclature changes were enacted (for compatibility between the two programs). In AutoDockTools, to ensure all proper criteria were met, hydrogens were again added, atoms were assigned the AD4 type, Gasteiger charges were computed and non-polar hydrogens were merged. The structure was then saved as a pdbqt file.
The ligand’s molecular structure was created with MarvinSketch, then cleaned in both 2D and 3D in the software. After being examined in Chimera for any structural defects, it was saved as a pdbqt file in AutoDockTools.
The ligand and macromolecule were both rendered in AutoDockTools, and a grid box was created, centered on the G4, being large enough to contain it, but not the ligand. Since the parameters for K+ ions are unknown by the program, they were added manually, and a grid
parameter file (.gpf) was created with all this information.
Then, a docking parameter file (.dpf) was prepared, with the pre-miR-149 G4 structure and ligand defined. A genetic algorithm, more specifically, a Lamarckian GA (4.2) was chosen, with a total of 25 runs being performed. Each run had a high number of evals, corresponding to the “long” software option (25 000 000 evals).
24
3.2.6.3.2 - Docking performance and results extraction/analysis
AutoGrid4 was then run with the .gpf file given as input, generating a grid log (.glg) file. Afterwards, AutoDock4 was run with the .dpf file given as input, generating a docking log (.dlg) file.
Afterwards, using the “Analyse” tool, the .dlg file was analysed, with all 25 obtained conformations being rendered in increasing order of binding energy (decreasing order of structural stability). The binding energy of each conformation was the main parameter used in order to determine the structural stability of the macromolecule-ligand complex.
The same procedure was repeated for all 7 ligands, and at this stage, the binding energies were analysed in order to determine which was the superior ligand.
3.2.6.3.3 - Molecular dynamics runs
The best conformation of each ligand was then chosen to undergo molecular dynamics runs in Gromacs 2016.3.
Due to limitations inherent in the software, the complex could not be submitted to the forcefield in itself. As such, the complex was split into two separate files, one for the ligand and other for the G4. The G4 was subjected to the Amber94 forcefield, and the ligand was subjected separately to an online available tool, acpype, which applied the AMBER forcefield to the ligand and generated topology, position restraint and molecular structure files. The molecular structure and the topology files of both molecules were merged into two files representing the molecular structure and topology of the complex. A solution environment was simulated by inserting the complex into an octahedron with 5.2 nm sides and filling the octahedron with TIP3P water molecules. 13 K+ ions were added to the box to neutralize the G4
negative charge. The complex was then minimized until the total energy was below 250 kJ/mol/nm.
The system then underwent thermal stabilization at 300K for 49 ns, with a modified Berendsen thermometer, with the G4/ligand complex and the water + ion molecules being the two different coupling groups considered. The G4 and ligand had position restraints throughout the process. After that, the system underwent pressure stabilization for 1 ns, at 1 bar and 300 K, with a Parrinello-Rahman barometer, G4 and ligand restrained again.
After the equilibration steps, the system was put through 10 ns of unrestrained molecular dynamics (mdrun), and the final positions of the ligand and G4 were obtained and further analysed.


![Figure 9 – RMSD graphs of the ligand a) Pyridostatin; b) Phen-DC3; c) C 8 ; d) C 8 -NH 2 ; e) L-arginine; f) [32]phen 2 N 4 ; g) [16]phenN 2 , quadruplex and complex throughout the simulation](https://thumb-eu.123doks.com/thumbv2/123dok_br/18828540.927864/48.893.47.831.109.628/figure-graphs-ligand-pyridostatin-arginine-quadruplex-complex-simulation.webp)

![Figure 15 – Representative clusters of the ligand [32]phen 2 N 4 .](https://thumb-eu.123doks.com/thumbv2/123dok_br/18828540.927864/56.893.76.765.104.609/figure-representative-clusters-ligand-phen-n.webp)