Ana Luísa Gonçalves Saldanha
Characterization of an oncofetal
Chondroitin Sulfate epitope in Cancer
Master thesis
Applied Biochemistry – Biomedicine
Work performed under the orientation of:
Dr. Ali Salanti
AGRADECIMENTOS
Obrigada! É bom agradecer a quem tanto me ajudou durante este percurso, muitas vezes feliz, mas tantas outras vezes com obstáculos que sozinha não tinha conseguido ultrapassar. Sendo assim, um obrigada ao meu orientador Dr. Ali Salanti que tornou possível o meu projeto e, que me recebeu num país e numa cultura que não era a minha, com toda a familiaridade. Obrigada ao meu co-orientador, Dr. Thomas Clausen, pela preocupação, pela ajuda, pela motivação, pela integração e por todos os ensinamentos que me transmitiu no laboratório. A ti, Yang Mao, é impossível não me referir com um sentimento de gratidão imenso, tu que tiveste toda a paciência que era possível e não possível, que estiveste presente todos os dias com a tua amizade e a tua boa disposição. Obrigada por teres acompanhado sempre o meu trabalho e por me teres ajudado tanto! Obrigada Marina, sem dúvida que foste um dos meus apoios nesse país frio, obrigada pela preocupação constante, pelo encaminhamento, por me teres transmitido uma forma de encarar o trabalho tão motivadora e tão entusiasmante. Eu espero que o teu futuro seja tão genuíno como toda a dedicação que colocas em tudo o que fazes!
Obrigada a toda a equipa VAR2CSA da University of Copenhagen – Centre for Medical Parasitology e a toda a equipa que esteve comigo no Panum Institute que acompanhou todo o meu trabalho e tanto me ajudou no laboratório.
Obrigada aquela que será para sempre a minha Universidade do Minho, obrigada por estes últimos cinco anos de aprendizagem e de crescimento profissional e pessoal. A todos os docentes, especialmente a si Professor João Carlos Marques, obrigada pela paciência, pela ajuda, pela preocupação e por estarem sempre presentes no nosso percurso académico.
Aos meus amigos e companheiros de todas as aventuras dinamarquesas, Sara Garcia, Clara, Sara Almeida, Joana, Ricardo, Fred e Raquel, obrigada por terem sido a minha família de coração. Eu acredito que sem vocês este Erasmus tinha tido muito menos cor! Obrigada por termos vivido tantos momentos felizes, pela cumplicidade, pelo companheirismo, pela amizade que tenho a certeza que será para sempre! Tenho muitas saudades vossas!
Aos meus “amigos da universidade”, a família que me acolheu durante estes cinco anos e que partilhou comigo a vida académica, que tão bem soubemos aproveitar, Joana, Anti, Bruno, Henrique, um obrigada enorme e entre nós estará sempre presente a união e cumplicidade que pouca gente
entende! Laidinha e Andreia obrigada por terem sido a minha segunda família durante estes anos de Universidade! Aos meus “amigos de sempre e para sempre”, Cati, Márcia, Rita Afonso, Rita Teixeira, Sara, Ana, Lisa, Raquel, Diana, Ana Isabel, João e Zé obrigada por me aturarem a todas as horas, vocês sabem que jamais o vosso lugar será ocupado!
Tânia obrigada pela amizade e pela paciência!
Melat, Mariam, Abdel e Yosef obrigada por em tão pouco tempo me ensinarem o que realmente importa! Obrigada por me relembrarem a força do amor!
Obrigada ao meu namorado, Zé Pedro, foste sem dúvida o meu grande apoio nesta fase tão complicada, foste tu que ouviste a mesma conversa vezes sem conta, que aturaste as más disposições, que soubeste confortar-me quando parecia impossível e lembrar-me a toda a hora do meu objetivo. Obrigada para ti nunca vai chegar, amo-te!
Por último, mas não menos importante a minha família:
Obrigada aos melhores tios e primos do mundo, Tita, Tio Fernando, Lena, Luis, Baba, Daniel e Miguel, vocês são aqueles que nunca me abandonam, muita coisa pode mudar mas as bases e as raízes ficam e o vosso apoio é essencial em tudo o que faço!
João e Zira, obrigada por me terem sempre apoiado e por terem permitido que a nossa família seja estranhamente tão perfeita!
Mano, obrigada por me mostrares o outro lado da vida, sempre tão doce, tão genuinamente infantil e tão desafiador! Serás para sempre o meu bebé pequenino!
Mamã, Papá, para vocês é sempre mais difícil encontrar as palavras certas porque sem vocês nada disto seria possível. Obrigada por me terem permitido ser tão feliz, obrigada por me deixarem ser responsável por cada escolha que faço e por nunca deixarem de estar do meu lado! A vocês tornava-vos eternos se me fosse possível, a minha vida faz sentido se tornava-vos tiver!
A Ti Jesus e a vocês estrelinhas do Céu obrigada por cada bênção e por iluminarem o meu caminho todos os dias!
RESUMO
Plasmodium falciparum é um parasita da malária que pode infetar seres humanos. Quando o parasita replica dentro dos eritrócitos, eles tornam-se suscetíveis à eliminação pelo sistema imunológico. No entanto, para evitar esta eliminação, o parasita expressa proteínas de adesão na superfície de eritrócitos infetados. As proteínas de adesão ancoram os eritrócitos a receptores específicos no hospedeiro. Carboidratos designados de chondroitin sulfate (CS) estão presentes em diferentes tecidos no corpo humano. No entanto, na placenta humana está presente um CS com características muito específicas chamado oncofetal-CS (of-CS). Os eritrócitos infetados pelo parasita da malária expressam à superfície a proteína VAR2CSA que se liga especificamente a CS. A ligação entre VAR2CSA-CS provoca malária placentária, uma doença que pode ser mortal.
As células da placenta e as células de cancro têm algumas características semelhantes, tais como: crescimento rápido de células, migração, invasão celular e CS com características específicas. A malária placental afeta uma grande parte da população mundial e por isso é muito importante encontrar uma possível vacina. A caracterização do CS presente especificamente na placenta e a caracterização da sua ligação à proteína VAR2CSA é fundamental, no entanto é muito difícil caracterizar as cadeias de CS através dos métodos comuns. O cancro também é uma doença mortal que afeta um grande número da população mundial. A caracterização de CS em células de cancro seria muito importante na patogênese, tratamento e diagnóstico.
No presente trabalho foi utilizada uma amostra de placenta humana a partir da qual o CS foi extraído através de vários métodos de purificação de tecidos. Posteriormente, a amostra de CS foi analisada por métodos analíticos, tais como High Performance Liquid Chromatography (HPLC) e por Liquid Chromatography-Mass Spectrometry (LC-MS). A cadeia CS é uma combinação de muitas características o que a torna muito específica e difícil de caracterizar. No entanto, através do trabalho realizado verificou-se que a sulfatação de 4-O na cadeia CS é necessária para a sua ligação à proteína VAR2CSA. Esta pesquisa demonstrou que o fragmento de ligação de CS à proteína VAR2CSA apresenta pouca sulfatação. Este trabalho tem como objetivo contribuir para novos estudos de compostos terapêuticos e para o diagnóstico de câncer, bem como a possível vacina anti-malária.
ABSTRACT
Plasmodium falciparum is a malaria parasite that can infect humans. When the parasite replicates inside the erythrocytes, they become susceptible to elimination by the immune system. However, to avoid this elimination, the parasite expresses adhesion proteins on the surface of infected erythrocytes (iEs). The adhesion proteins anchor erythrocytes to specific receptors in the host. Carbohydrate called chondroitin sulfate (CS) is present in different tissues in the human body. However, in the human placenta is present a CS with very specific characteristics called oncofetal-CS (of-CS). Erythrocytes infected by the malaria parasite express to the surface the VAR2CSA protein that specifically binds to of-CS. The link between VAR2CSA-CS causes placental malaria (PM), a disease that can be deadly. The placenta cells and cancer cells have some similar characteristics, such as: rapid cell growth, migration, cell invasion and specific CS. PM affects a large part of the world's population and so it is very important to find a possible vaccine. The characterization of the CS present specifically in the placenta and the characterization of its binding to the VAR2CSA protein is fundamental, however it is very difficult to characterize CS through the common methods. Cancer is also a deadly disease that affects a large number of the world's population. The characterization of CS in cancer cells would be very important in pathogenesis, treatment and diagnosis.
In the present work a human placenta sample was used from which CS was extracted through various methods of tissue purification. Posteriorly, the CS of the sample was analyzed by analytical methods, such as High Performance Liquid Chromatography (HPLC) and Liquid Chromatography-Mass Spectrometry (LC-MS). The CS chain is a combination of many characteristics that makes it specific and difficult to characterize. However, through the work performed it has been found that 4-O sulphation in the CS chain is required for its binding to the VAR2CSA protein. This search also demonstrated that the CS binding fragment to the VAR2CSA protein shows little sulfation. This work aims to contribute to new studies of therapeutic compounds and to the diagnosis of cancer, as well as to possible anti-malaria vaccine.
Í
NDICE Agradecimentos ... iii Resumo... v Abstract... vi List of abbreviations ... ix List of Figures ... xiList of Tables ... xii
1. Introduction ... 13
1.1 Extracellular matrix (ECM) and structure ... 13
1.1.1 Proteoglycans (PGs) and glycosaminoglycans (GAGs) ... 13
1.1.2Biosynthesis of different GAGs ... 16
1.1.3 Chondroitin sulfate proteoglycan (CSPG) ... 18
1.2 CS as a receptor ... 18
1.2.1 Malaria parasite – Plasmodium falciparum ... 18
1.2.2 Life cycle of parasite ... 19
1.2.3 Pathogenesis and Immunity ... 20
1.2.4 PM ... 21
1.2.5 VAR2CSA protein ... 21
1.3 Cancer ... 24
1.3.1 CSPGs and cancer ... 24
1.3.2 Targets for cancer therapy and VAR2CSA ... 25
1.4 Purpose of this project ... 26
2. Experimental Part ... 27
2.1 Methods ... 27
2.1.1 Sample and digesting enzymes ... 27
2.2 Sample digestion processes ... 28
2.2.3 Dehydration of the sample ... 29
2.2.4 Removal of lipids ... 30
2.2.5 EtOH precipitation ... 30
2.3 Enriching of-CSA on VAR2CSA columns ... 30
2.4 Analysis processes ... 32 2.4.1 HPLC ... 32 2.4.2 LC-MS ... 36 2.5 Results ... 36 2.6 Discussion ... 50 3. General Conclusion ... 54 3.1 Conclusion ... 54 5. ANEXOS ... 65 Anexo I ... 65 Anexo II ... 68 Anexo III ... 71
LIST OF ABBREVIATIONS
AMAC – 2-aminoacridone C3H6O – Acetone
C4ST1L3 – GalNAc 4 sulfotransferases CD36 – Cluster differentiation 36 ChABC – Chondroitinase ABC ChCl3 – Chloroform
CIDR – Cysteine-rich inter-region domains CR1 – Complement receptor 1
CS – Chondroitin sulfate CSA – Chondroitin sulfate A
CSGalNacT-1 – N-acetylgalactosaminyltransferase-1 CSPG – Chondroitin sulfate proteoglycan
DMSO – Dimethyl sulfoxide DS – Dermatan sulfate ECM – Extracellular matrix
ELISA – Enzyme linked immunosorbent assay EtOH – Ethanol
EXTL2 – Exostosin like glycosyltransferase 2 FD – Fluorescence detector
FGF – Fibroblast growth factor
FV2 – Full length variant surface antigen 2-Chondroitin sulfate A GAG – Glycosaminoglycans
GalNAc – N-acetyl-D-galactosamine GlcA – Glucuronic acid
GlcNAc – N-acetyl-D-glucosamine HA – Hyaluronic acid
HCl – Hydrochloric acid
HPLC – High performance liquid chromatography HS – Heparan sulfate
ICAM 1 – Intercellular adhesion molecule 1 IdoUA – Iduronic acid
iE – Infected erythrocyte KS – Keratan sulfate LBW – Low birth weight
LC-MS – Liquid chromatography-mass spectrometry MeOH – Methanol
MS – Mass spectrometry
NaBH3CN – Sodium cyanoborohydride NaOAc – Sodium acetate
NH4OAc – Ammonium acetate NHS – N-hydroxysuccinimidyl NTS – N-terminal segment Of-CS – Oncofetal CS
PBS – Phosphate-buffered saline
PfEMP-1 – Plasmodium falciparum erythrocyte membrane protein 1 PGs – Proteoglycans
PM – Placental malaria PTB – Preterm birth
rVAR2CSA – Recombinant protein VAR2CSA
LIST OF FIGURES
Figure 1.1 - Table representative of the composition and structures of the different GAGs [5] ... 14
Figure 1.2 - Representation of the structural diversity of GAGs [7] ... 15
Figure 1.3 - C4S structure that represents repeating units of GAGs [8] ... 16
Figure 1.4 - HS, CS, DS modification site in a PG protein core with a tetrasaccharide linker sequence[9] ... 16
Figure 1.5 - Various steps in the synthesis of CS, DS, HS and heparin GAG chains [5] ... 17
Figure 1.6 - Life cycle of malaria parasite [22] ... 20
Figure 1.7 - Representative scheme of PfEMP1 and VAR2CSA [8] ... 22
Figure 2.1 - Scheme illustration of the purification steps of placental CS ... 28
Figure 2.2 - Structure of CS/ DS disaccharides used as sample standards ... 33
Figure 2.3 - AMAC labeling scheme after ChABC activity (Anexo III) ... 34
Figure 2.4 - HPLC chromatogram of the standard samples and chromatogram of Sigma CSA (A, B)... 37
Figure 2.5 - HPLC chromatogram of the Sigma CSA without C3H6O precipitation (B) and with C3H6O precipitation (C) after lyophilisation with the precipitation is possible to see de peacks more clean ... 38
Figure 2.6 - HPLC chromatogram of standard samples. ... 39
Figure 2.7 - HPLC chromatogram of standard sample (D) and the placenta input (E). ... 41
Figure 2.8 - HPLC chromatogram of the standard sample (D) and placenta run-through (F). ... 42
Figure 2.9 - HPLC chromatogram of the placenta input (E) and placenta run-through (F). ... 43
Figure 2.10 - HPLC chromatogram of the standard sample (D) and the placenta CSA, 1M of NH4OAc (G) ... 45
Figure 2.11 - HPLC chromatogram of the placenta CSA, 1M of NH4OAc (G) and sigma CSA, 1M of NH4OAc (H). ... 46
Figure 2.12 - Chromatograms corresponding to the Sigma CSA sample at LC-MS analysis. ... 48
Figure 2.13 - Chromatograms corresponding to the placenta sample at LC-MS analysis. The I - after the purification of CSA in the first column and J- placenta sample that was used in the column with digestion enzyme. ... 49
LIST OF TABLES
Table 2. 1 Enzymes used in the purification of the placenta sample ... 28 Table 2. 2 Sample values added to the MiniTrap G10 column ... 32 Table 2. 3 Description of the solvents used in HPLC and equilibrium gradients ... 34
1. INTRODUCTION
1.1 Extracellular matrix (ECM) and structure
1.1.1 Proteoglycans (PGs) and glycosaminoglycans (GAGs)
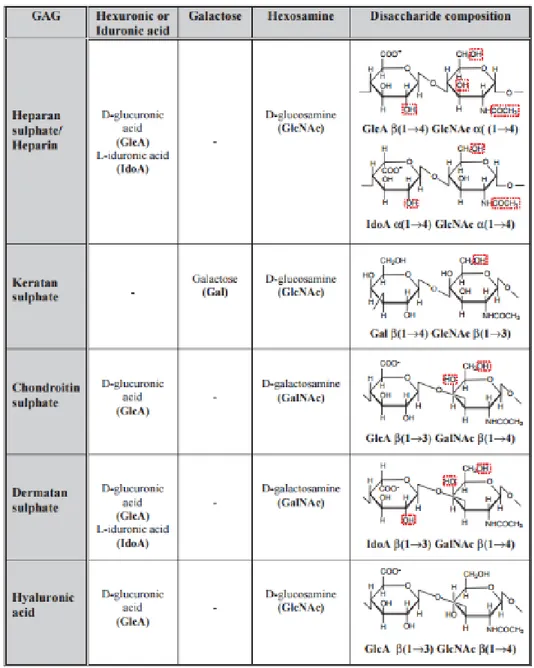
The ECM is a dynamic, non-cellular structure that comprises a lot of macromolecules, including elastin, tenascin, fibronectin, thrombospondin, PGs and Hyaluronan [1]. PGs are proteins that are modified with GAG, which contribute to important biological functions, like: function of ECM, regulation of cell growth, enzyme activities [2]. GAGs are linear biopolymers composed of repeating disaccharide units of hexosamine (N-acetyl-D-galactosamine (GalNAc), N-acetyl-D-glucosamine (GlcNAc)) and uronic acid (D-glucuronic acid (GlcA) or L-iduronic acid (IdoUA)). In different subtypes of GAGs the repeating disaccharides can be differentially modified by N-acetylation and sulfation [3, 2], resulting in a highly heterogenous, negatively charged chains with a molecular weight which can be much higher than 100kDa. GAGs can be divided into two categories based on whether or not the chain is sulfated. The non-sulfated GAGs include only hyaluronic acid (HA). As for the sulfated GAGs, they include chondroitin sulfate (CS), keratan sulfate (KS), heparin and heparan sulfate (HS) and dermatan sulfate (DS) (Figure 1.1) [4, 5].
Figure 1.1 - Table representative of the composition and structures of the different GAGs. Possible sulfation sites are represented in the image with a red line [5]
The general structure of GAGs is linear, and is made up of a O-sulfated polysaccharide backbone of alternating residues of uronic acid and distinct hexosamine: CS contain GlcA and GalNAc; DS contain IdoA and GalNAc; HS contain IdoA or GlcA and GlcNAc (Figure 1.2) [4, 6].
Figure 1.2 - Representation of the structural diversity of GAGs. Squares represent hexosamine (glucosamine or galactosamine), triangles represent uronic acid (GlcA or IdoUA), the circles represent galactose [7]
Different patterns of sulfation allow different interactions with protein ligands, usually through ionic interactions [5]. Depending on the type of sulfation, the different disaccharides are called 0, A, B, C, D and E. However, in most cases the GAG chain is a mix of different types of sulfations [7]. Chondroitin sulfate A (CSA, also called C4S) is a specific type of CS that is characterized by the presence of 4-O-sulfation on the majority of the GalNAC residues of a given CS chain (Figure 1.3) [8].
Figure 1.3 - C4S structure that represents repeating units of GAGs (red: D-Glucuronic acid, blue: N-acetyl-D-galactosamine, green: sulfate group). The GlcA residues link with N-acetylgalactosamine residues via β (1-3) glycosidic bonds, the N-acetylgalactosamine residues link to GlcA residues through β (1-4) linkages and also glycosidic [8]
1.1.2 Biosynthesis of different GAGs
CS, DS, HS and heparin, synthesis starts with the formation of a tetrasaccharide linker that contains xylose, galactose and GlcA (GlcA-β1,3-Gal-β1,3-Gal-β1,4-Xyl-O-) at a serine residue of the PG core protein (Figure 1.4) [5, 9].
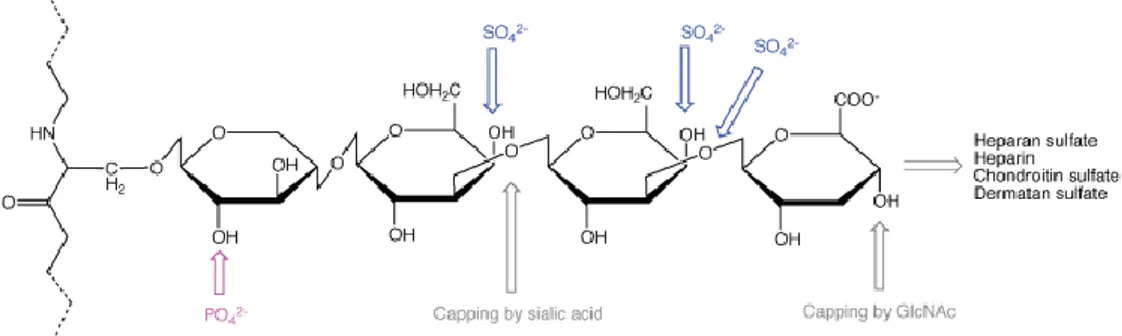
Figure 1.4 - HS, CS, DS modification site in a PG protein core with a tetrasaccharide linker sequence. In the figure are marked sulfation, phosphorylation and capping sites [9]
The fifth sugar added (acetylated amino sugar) to the tetrasaccharide linker decides whether the chain will be HS / heparin or CS / DS. HS is formed if GlcNAc is added to the tetrasaccharide linker and CS is formed if GalNAc is added [9, 10].
The CS N-acetylgalactosaminyltransferase-1 (CSGalNAcT-1) enzyme is responsible for catalyzing the transfer of a residue of GalNAc to form CS/DS and is very important in the chain initiation process of CS/DS. Exostosin like glycosyltransferase 2 (EXTL2) is in turn responsible for adding the first GlcNAc to form HS (Figure 1.5) [5, 11, 12]. The chain of CSA is elongated through the action of many enzymes and then the chain is sulfated through enzymes such as GalNAc 4 sulfotransferases (C4ST1L3) [13].
1.1.3 Chondroitin sulfate proteoglycan (CSPG)
GAGs are post-translational modifications to PGs present in the cellular membrane and ECM. Different PGs have been identified in different human tissues. CSPG are a family of very diverse proteins with a lot of functions. As a protein can have one or up to 200 CS chains, CSPGs can have different functions like regulation of cellular processes (e.g. differentiation, invasion, adhesion, growth) and providing structural integrity [14, 15]. The up/down regulation of CSPG expression is associated with pathological and physiological conditions. Some malignant tumors such as testicular, breast, pancreas and colon tumors overexpress two major CSPGs - versican, decorin [15]. The CS chain is very important to the functions of CSPG because it can act as a scaffold for sustained proliferative signaling by providing growth factors to the membrane receptors [16]. Several specific biological effects, such as binding to growth factors and their receptors, may be due to structural changes in the CS chains. In addition, the specificity of CS to the protein ligands is different than that of HS [15].
1.2 CS as a receptor
1.2.1 Malaria parasite – Plasmodium falciparum
Plasmodium falciparum is a protozoan parasite [17] and this parasite can survive in different host organisms, such as vertebrates and invertebrates, both intracellularly and extracellularly. The life cycle of parasite is extraordinarily complex because it involves specialized protein expression [18]. So, the infection by the Plasmodium falciparum parasite can be very harmful.
Plasmodium falciparum is a malaria parasite that can infect the human being. Malaria can be a deadly disease and affects a large number of the world's population. According to the "The Worls Malaria report" in the year 2015 there were 214 million cases of malaria globally, 438,000 deaths due to malaria disease. The worst is in the African region where 90% of deaths occurred. Children (under 5 years) are very susceptible to infection, disease and death, and account for 70% of malaria deaths [19]. Pregnant women are also very susceptible to malaria. Each year, 125 million pregnancies are at risk of infection, with high levels of mortality rates. During pregnancy, malaria can cause different health complications, such as low birth weight (LBW) and intrauterine growth restriction, preterm birth (PTB) and other long-term effects [20, 21].
1.2.2 Life cycle of parasite
The life cycle of Plasmodium falciparum parasite has two stages: an exogenous sexual phase with multiplication of parasites in Anopheles mosquitoes; and an endogenous sexual stage, where there is a multiplication of the parasites in the human host. Male Anopheles mosquito eat only nectar and plant sap, but females eat blood. After the female Anopheles mosquito ingests the blood of the human host, the sexual phase of the parasite begins, and the zygote is formed in the stomach. The zygote passes through the mosquito stomach cell layer and, in a sporogony process, hundreds of infected forms are formed (sporozoites). The sporozoites go to the salivary glands, and when the mosquito stings a human body the sporozoites pass to the human host. Thirty to sixty minutes after entering the blood, the sporozoites penetrate the liver cells and start mitotic activity and nuclear division. The multinucleate liver-stage schizont bursts within 9 to 16 days and releases thousands of merozoites in the blood. The merozoites then invade erythrocytes cells and take 72 hours to develop trophozoites and start a new phase of mitotic division originating erythrocytic-stage schizonts. When the infected red blood cells rupture, each schizonts liberates between 8 to 32 merozoites, which invade new erythrocytes. After a few cycles, some merozoites go to sexual stage called gametocytes. When gametocytes are ingested by feeding Anopheles mosquitoes, mature male and female gametes join to form a zygote in the midgut of the vector. The malaria parasite only has a diploid phase which is when there is the zygote formation and the only time there is meiosis shortly after formation of the zygote (Figure 1.6) [22, 23, 24, 25].
Figure 1.6 - Life cycle of malaria parasite [22]
1.2.3 Pathogenesis and Immunity
Var, Rif and stevor are three multigene families in the genome of the parasite Plasmodium falciparum. These genes encode proteins known as Plasmodium falciparum erythrocyte membrane protein 1 (PfEMP-1), repetitive interspersed family (rifin) and sub-telomeric variable open reading frame (stevor), respectively. The products of the var and rif genes are transported to the surface of infected iEs. These proteins are involved in the adhesion to host endothelial receptors, allowing the iEs to be sequestered to different organs [26].
PfEMP1 is a family of proteins with a size between 200 and 350 kDa, encoded by the var genes. These proteins are known to be extremely important for the pathogenicity of the parasite, as it allows the iEs to
adhere to different receptors in the organism, preventing clearance by the spleen [27, 28]. This makes malaria caused by Plasmodium falciparum very difficult to eliminate.
When an organism is exposed to repeated infections that cause immunity. With repeated infections the host immunize the many PfEMP1 proteins [29]. The worst cases of the disease are in children up to five years of age. The antigens that the parasites express at the surface of iEs are essential in the process of infection, because most often the host organism do not have IgG antibodies specific to them. Immunity developed by accumulation of different antibodies specific for PfEMP1 in some episodes of disease. The big problem is the great genetic variability, as members of PfEMP1 family are expressed by 50 to 60 different genes [30].
1.2.4 PM
PM is caused by the parasite Plasmodium falciparum. This disease causes severe heatlh complications both to the mother and the fetus, leading to LBW and severe maternal anemia. In Africa, aroud 200,000 infants and 10,000 mothers die every year from PM [21]. Previously acquired immunity makes malaria less frequent in adults. However, pregnant women are susceptible to malaria, despite the previously acquired immunity. Additionally, this susceptibility is higher in their first pregnancy as immunity to this type of malaria is only obtained in successive pregnancies [31].
Despite there being different types of PfEMP1 proteins, PM is characterized by a specific PfEMP-1 protein, named variant surface antigen 2-chondroitin sulfate A (VAR2CSA) [31]. During the course of pregnancy, the IEs accumulate in the intervillous space in the placenta, and bind to the syncytiotrophoblast. Through a transcriptional analysis of genes, the VAR2CSA protein was shown to be responsible for the IE binding to the placenta [32]. This binding was shown to be to a specific type of CS named CSA. Such binding is highly specific, as studies have shown that IEs do not bind to other receptors (like cluster differentiation 36 (CD36) and Intercellular Adhesion Molecule 1 (ICAM 1)) that normally support adhesion of other IE forms [33]. IEs are then retained in the placenta, leading to severe inflammation [34].
1.2.5 VAR2CSA protein
VAR2CSA belongs to the PfEMP1 family of proteins that are codied by var gene family, as previously mentioned. PfEMP1 proteins are made up of several Duffy domains (DBL) separated by Inter domains
(ID), and it is the DBL domains that cysteine rich. These domains can bind different receptors like CSA, CD36 and complement receptor 1 (CR1). The composition of PfEMP1 protein family is quite similar: all have a small acid intracellular domain and a large extracellular part. The sequence of PfEMP1 protein is very important since it influences the binding to their receptors. All proteins contain a small acidic intracellular domain and a large extracellular part with N-terminal segment (NTS), DBL, cysteine-rich inter-region domains (CIDR) and interdomains (ID) [35]. VAR2CSA is different because this protein has six DBL domain, with an amino acid in the N-terminal sequence distinct from others PfEMP1s. These domains are called: DBL1x, DBL2x, e DBL3x (Figure 1.7). This protein have six Duffy binding-like domains, three DBLx and three DBLƐ, and a cysteine-rich inter-domain region between DBL2x and DBL3x, [8, 36, 37]. VAR2CSA is a large protein (350 kDa) with a complex structure and is difficult to mass-produce because of genetic variability.
Figure 1.7 - Representative scheme of PfEMP1 and VAR2CSA. In the image are represented the domains DBL, the CIDR and the segments of interconnection (represented in black) [8]
During pregnancy, VAR2CSA-expressing IEs bind to CSA present in the placenta, leading to accumulation of IEs and causing PM. The severity of PM stresses the need to find a treatment for PM, and efforts have been made in this direction. One of the treatments that is under development is a vaccine. PfEMP1 proteins can be essential to the development of the vaccine, but isolates of Plasmodim falciparum have a high degree of genetic variation and a high degree of antigenic switching. This can make the whole development process of a specific vaccine more complicated. Fortunately, PM is an exception since the VAR2CSA protein is highly conserved and is the only antigen in PM. A strategy is also possible because the surface molecules expressed in IEs have conserved epitopes [38].
As mentioned before, VAR2CSA is a large and complex protein, making it extremely difficult to produce recombinantly for vaccine development. There may be a problem when using a large protein for the
development of a vaccine, since the high size may lead to the formation of non inhibitory antibodies. Targeting a structural epitope that is not involved in the binding increases the likelihood of escape mutations. Thus, it is essential to cut the CSA chain to find the true CSA binding site, so that it can be targeted and to act as a vaccine (to induce the production of antibodies capable of blocking the adhesion to CSA) [21].
The first studies to find the CSA binding region focused on producing individual DBL domains and studying them [39]. These studies showed that four VAR2CSA domains (DBL2x, DBL3x, DBL5Ɛ, DBL6Ɛ) bind specifically to CSA. The same DBL domains but from different VAR2CSA variants showed different affinities for binding. The recombinant protein with full length variant antigen 2-chondroitin sulfate A (FV2) proved to be highly specific in binding to CSA. This binding had much higher affinity than binding of single domains to CSA. So it is thought this evidence shows that VAR2CSA protein assumes a tertiary structure with all the domains interconnected. The interaction between the them forms the true CSA binding site [37, 40, 41]. The study of FV2 was really important to understand the structure and binding properties of the VAR2CSA protein. Full length VAR2CSA ectodomain binds specifically to CSA and the CSA binding site was shown to be within the DBL2x-CIDRPAM region. Additionally, some fragments have been shown to possess the same affinity to CSA as the protein in its full length: two overlapping fragments – DBL1x-CIDRPAM, ID1-DBL3x and DBL1x-DBL3x. Currently, we
lack information on the structure of full length VAR2CSA because no crystal structure has been obtained. However, different studies show that VAR2CSA protein has a compact structure and that the binding site to CSA depends on several domains and regions between domains. Mutations in classic sulfate-binding sites in VAR2CSA proved that the interaction between VAR2CSA and CSA is partially dependent on ionic interactions. Several small fragments of VAR2CSA can produce antibodies that can interfere with the adhesion of IEs to CSA [37].
GAGs that are found on the cell surface are used by many bacteria, parasites and viruses as adhesion receptors. Animal cells contain several types of GAGs but HS is the most studied GAG and is associated with pathogens. Some parasites are known to interact with CS chains including malaria parasites, herpes simplex virus, lymes disease spirochetes and Toxoplasma gondii [40, 41]. The VAR2CSA pathogen evolved to bind specifically to CSA, but we lack information on this specificity. A study demonstrated that parasites bind specifically to CSPGs present in the intervillous space in the placenta. The CSPG establishing the connection has specific characteristics, such as low sulfated and contains only 2-8% of 4-O-sulfated disaccharides [42]. The binding specificity of the IEs to the CSA chains is
dependent on units of non-sulfated disaccharides in combination with disaccharide units with 4-O sulfation. Then, dodecarides having four or five disaccharide units with 4-O sulfation and one or two units of non-sulphated disaccharides represent the minimum chain length to establish the specific binding between IEs and CSA [6, 43]. Information regarding the specific interaction between the VAR2CSA protein, expressed on the surface of the iEs, and CSA is still very incomplete. There are studies that explain the specificity of the interaction through a type of sulfation, conformation or specific modifications that the CSA can adopt. However, studies are very difficult because it is very difficult to use homogeneous CSA in some studies [6, 44, 45].
1.3 Cancer
Cancer is one of the biggest threats to the world's population because it is one of the largest causes of death worldwide. In 2012 more than 8.2 million people died of cancer worldwide and in the coming decades these values are expected to increase [46, 47]. At this time the cancer treatment is mainly based on chemotherapy treatments, radiation therapy and surgery. Chemotherapy and radiotherapy are very nonspecific treatments for cancer cells and therefore have many unwanted side effects [48]. Surgery can not eliminate all metastatic cells, leading to relapse of cancer. Additionally, cancer is a heterogeneous disease which leads to an increased difficulty to find a universal therapy for all types of cancer. Thus, there is an urgent need for developing efficient and targeted therapies [49].
CS has several functions in the organs where it is present. For example in the placenta it is responsible for rapid cell proliferation (attracting chemokines, nutrients), for the trophoblast invasion of uterine tissue, a high mitotic index, and to establish a complex and the vasculature of the uterine tissue [50, 51]. VAR2CSA binds to a specific type of CS exclusively expressed in the human placenta. Recently, the same specific type of CS was also shown to be present in cancer cells, thus allowing targeting with the recombinant VAR2CSA (rVAR2CSA). This binding can be used as a specific diagnosis and therapeutic strategy in cancer [52].
1.3.1 CSPGs and cancer
CSPGs have a lot of physiological importance, and its dysregulation can be associated with many kind of diseases such as cancer, Alzheimer's disease, atherosclerosis, among others [53, 54]. CS and its PGs are involved in some major features of cancer, such as apoptosis, adhesion, mounting the ECM,
invasion, angiogenesis, proliferation, and migration [55]. Some of these functions are provided individually or through the interaction of CSPGs with integrins, metalloproteases or RTK [56, 57]. The expression outside the normal CSPGs have been detected in various cancers such as testicular cancer, breast, colon [58, 59, 60]. For example, CSPG4 is abnormaly expressed on melanoma, glioblastoma, and sarcomas [56, 57, 61]. The protein core of CSPGs has a great importance, but the CS chains are very critical in cancer development because they capture chemokines cytol, PGs and presents them to various membrane receptors functioning as a scaffold and oncogenic signaling [62, 16]. PGs that have CS/DS/HS may participate in the response that is given by basic fibroblast growth factor (FGF) that affects the growth of human melanoma and metastases [16, 63]. CS chains involved in the interaction between different CSPGs and cancer receptors as DS and CSE mediate binding of selectins (PDS, CSA, CS, CSD, CSE) that bind to CD44 [64, 65]. The creation of P selectin ligands on the cell surface of breast cancer is achieved by the action of CSPG4 and CHST11, which are involved in the formation of sulfation of GalNAc 4 (CSA) [66]. Other studies have shown that various types of changes to CS are associated in the development of cancer [15].
1.3.2 Targets for cancer therapy and VAR2CSA
The presence of CS in most malignant situations places the CSPGs as an important target for cancer therapy. In fact, CSPG4 is currently one of the targets for cancer therapy. CSPG4 plays an important role in the growth and survival of cancer cells not only in melanoma cells but also in cells of various types of carcinoma and human sarcoma. Results demonstrated that CSPG4 is a suitable target for the monoclonal antibody (mAb) [67, 68, 69]. CS PGs are present in various tissues of the organism, chemical analysis has shown that the position and degree of chain sulfation allows them to be distinguished. The different sulfation composition can affect the properties of the GAG chain, and therefore interfere in the different associations and interactions with other components. Thus, there has been some difficulty in distinguishing CS with different types of sulfation in different tissues [70, 71]. Considering this, it is necessary to develop more efficient strategies for cancer diagnosis and therapy. The VAR2CSA protein binds specifically to the placenta, although little is known concerning the structure of the CS that mediaetes such binding. The most common features of cancer cells, such as rapid growth, invasion of surrounding tissues, and the capability to establish a new vasculature are common to trophoblastic cells and may be due to the CS expression [50, 51]. rVAR2CSA could be used
as a highly specific reagent for cancer and could be a strategic way to diagnosis and treatment, and realize the function of CS in cancer development and placenta.
1.4 Purpose of this project
The malaria parasite, Plasmodium falciparum, when it infects the erythrocytes of the human organism, causes the expression of the VAR2CSA protein on the surface of erythrocytes. Through the VAR2CSA protein, iEs adhere to a specific type of CS (of-CS) present in the human placenta. This binding allows iEs to escape from the body's elimination.
Placenta cells and cancer cells have many similarities and one of them is the presence of CS with very specific characteristics. CS is an extremely modified and heterogeneous molecule. Therefore, despite the enormous research towards its characterization and the characterization of the VAR2CSA-CS link, there are still many essential details to realize. The characterization of the CS chain and its binding to VAR2CSA is very important in the diagnosis and therapy of cancer and in the development of a vaccine for malaria. Some features are already known, for example that the VAR2CSA protein binds to a specific type of CS with a 4-O and 6-O sulfation mixture. However, much research work needs to be done to define the characteristics of the binding epitope.
The aim of the present work is to help define the structure of-CS and to understand what distinguishes it from the remaining CS present in other tissues of the human organism. In this work a human placenta sample was used from which CS was extracted by extraction / purification methods. Subsequently the CS sample was analyzed by HPLC and LC-MS methods. The study will provide information on a key target that may be of extreme importance in cancer and malaria.
2. EXPERIMENTAL PART
2.1 Methods
2.1.1 Sample and digesting enzymes
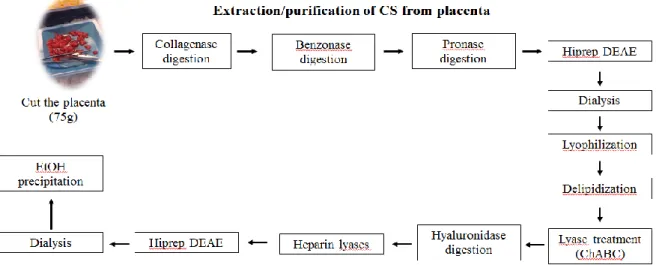
The placenta was obtained from healthy pregnant women delivering by caesarean section at term at Rigshospitalet University Hospital in Copenhagen, Denmark. The placenta was scrapped with forceps and distributed through different tubes with phosphate-buffered saline (PBS). The blood was removed with successive centrifugations (3700 Heraeus) at 1000g. CS was extracted from tissue by a series of protease digestion and separated from other GAGs by the action of hyaluronidase and heparin lyases. In the work of purification of the CS a collagenase enzyme that is a protease was used. Collagenase has the function of the degradation of collagen fibers that are present in the connective tissues of the human organism [72]. According to its function it was the first enzyme to be used in the purification / extraction process. The benzonase enzyme is an endonuclease, its function is the degradation of DNA and RNA present in the sample. The enzyme degrades DNA and RNA, with single chain, double chain, linear or circular chain. Therefore, its use is essential for the removal of nucleic acids [73]. The pronase enzyme has the ability to digest denatured and native proteins into indicidual amino acids [74]. The hyaluronidase enzyme is specific for cleaving HA [75]. Heparinase enzymes are enzymes that have the ability to cleave the glycosidic bond between hexosamines and uronic acids in heparin and HS. When the heparinase I, II and III enzymes are used together, they cause a virtually complete degradation of heparin and HS [76]. The enzyme Chondroitinase ABC (ChABC) is used to digest the CS chains, acts efficiently on C4S, C6S and DS [94]. All enzymes used in the placenta sample had the common goal of extracting CS (Table 2.1) and therefore digestion of the remaining components of the tissue.
Table 2. 1 Enzymes used in the purification of the placenta sample
Enzyme Amount From
Collagenase 200U/ml ThermoFisher Scientific
Benzonase 250U/µl Sigma-Aldrich
Pronase 50U/ml Merck Millipore
Hyaluronidase 300U Sigma-Aldrich
Heparinase I, II, III 50mU Iduron
ChABC 50mU/ml Sigma-Aldrich
2.2 Sample digestion processes
The placental CS was purified by various processes (Anexo I). Apart from digestion with enzymes (Table 2.1), the following steps were used: DEAE HiPrep column (from GE Healthcare Life Sciences), dialysis (from ThermoFisher Scientific), lypholization and delipidization. All procedures were done to allow purification of CS from the placenta (Figure 2.1).
2.2.1 Separation of proteins and other biomolecules
HiPrep DEAE FF 16/20 column is used to perform ion exchange chromatography, allowing the separation of proteins and other biomolecules [77].
The column is positively charged allowing binding of negatively charged compounds such as the GAG chains. During the first 10-15 minutes water was used with a low flow rate to allow removal of the ethanol (EtOH). The placenta sample was consecutively treated with 1xDPBS solution with 0.1% Triton X-100. The column was equilibrated with the same solution (1xDPBS with 0.1% Triton X-100, 1.5 mL / min). After equilibration of the column, the placenta was allowed to pass through the column overnight. When the entire sample from the placenta passed the column, the column was washed with DPBS for 10-15 minutes. The wash solution was prepared (20mM sodium acetate (NaOAc), pH 5, 0.1M NaCl, 1.5mL / min) and placed in the column to ensure that only the chains of negatively charged compounds are retained. Afterwards, the purified sample was eluted with 20mM NaOA, pH 5, 1M NaCl, 1.5mL / min.
2.2.2 Remove salts and small contaminants
Slide-A-Lyser G2 dialysis cassettes (2K MWCO, 3mL) were used to remove salts and other small contaminants. The cassette is comprised of a cellulose membrane which has the ability to retain macromolecules like proteins, bigger than 2000 daltons [78].
Initially, the cassette was hydrated for 2 minutes by dipping it in water (water can be used because the goal of this step is the separation of sugars, which requires no special buffer). The sample was then placed inside the cassette (halfway) with a pipette. The air that was inside the cassette was previously removed so that the surface area / volume is maximum. The cassette was placed in water and stood overnight. Subsequently, the sample was carefully removed using a pipette and placed in a 50ml falcon tube.
2.2.3 Dehydration of the sample
The lyophilization process aims to reduce the amount of water in the sample. Lyophilization is dehydration of the material by freezing and sublimation processes [79]. The placenta sample (50mL) was distributed in falcon tubes and frozen at -80 ° C. When frozen, the vials were covered with parafilm and placed in the lyophilizer for two days.
2.2.4 Removal of lipids
The lipid or lipid groups were removed from the sample through a placenta delipidization process. For this procedure were used different ratios of chloroform (ChCl3) and methanol (MeOH):
50mL (2:1 v/v) ChCl3 : MeOH, overnight
(The supernant was removed)
50mL (1:1 v/v) ChCl3 : MeOH, overnight
(The supernant was removed)
50mL (1:2 v/v) ChCl3 : MeOH, overnight (The supernant was removed)
The placenta sample was placed in a glass container with the first proportion ChCl3: MeOH (2: 1). The
solution was in complete rest overnight. The buffer was removed and the following ratio buffers added. The compound (CS) of interest will remain in the form of pellets. After the addition of different proportions (ChCl3: MeOH) MeOH was added to the last wash. The sample was then dried at 55ºC in falcon tubes.
2.2.5 EtOH precipitation
In order to further remove impurities, the delipidized sample was re-dissolved in 20mL ddH2O and
subjected to EtOh precipitation. The placenta sample was precipitated by a solution of EtOH saturated with NaOAc. The EtOH solution saturated with NaOAc solid was prepared in a 50mL falcon tube and then added to the sample until precipitation of the placental CS (a volume ratio of 2:1). The sample was left at 4ºC overnight. Then, it was centrifuged (Thermo Scientific Heraeus Fresh 21) at 4 ° C, 10000g for 30 minutes. The EtOH was removed and the sample was dried at 55°C again.
2.3 Enriching of-CSA on VAR2CSA columns
CSA purification in the placenta sample was made possible with the use of an N-hydroxysuccinimidyl (NHS) activated column covalently coated with VAR2CSA proteins (Anexo II). This column is activated through the esters to capture primary amines. The retention of non-specific compounds is not significant because of the hydrophobic matrix properties. The column is packed with pre-NHS which is an ester that reacts directly with the amine group in the molecules [80]. In this purification procedure two columns were used: both columns were coated with VAR2CSA protein, but the second column
will be retained but in the second column only the GAG binding segment to the VAR2CSA protein will be retained in the column because what is not in the binding site will be digested by the enzyme ChABC. The column (with a maximum volume of 1mL) was placed in an iron stand with a glass underneath. The cover that was on top of the column was removed and a drop of ice cold 1mM hydrochloric acid (HCl) was added to the top of the column. The application of solutions such as HCl was made with a syringe (2mL) and extreme care was taken not to let any air into the column. The snap-off end of the column out-let was removed. Before use the column was washed with 6mL of ice cold 1mM HCl, with a flow rate of 1mL / min (1/2 drop / sec) to remove the isopropanol used for storage. The washing process was performed in three parts using a 2ml syringe. The purification column was first loaded with a spycatcher (13kDa, 14mg / mL) in a volume of 1mL, which allows the binding of the VAR2CSA protein (121kDa) to the column, since the protein contains a spytag that binds directly to the spycatcher. The column was sealed with parafilm for 30 minutes at room temperature. The buffers A (0.5M Ethanolamine, 0.5M NaCl, pH 8.3) and B (0.1M Sodium actetate, 0.5M NaCl, pH 4) were prepared. Buffers were made to wash away the protein which has not been retained in the column and to deactivate any excess active groups that are not coupled. The first washing of the column was made in the following order: 6 ml Buffer A, 6 ml buffer B, 6 ml buffer A. The column was sealed for 30 minutes at room temperature and then another wash was made in the following order : 6 mL buffer B, 6mL buffer A, 6mL buffer B and 4mL of PBS. The placenta sample and the sample from Sigma CSA were prepared to be enriched. The placenta sample (100ug / mL) was diluted in 2.5mL of amonium acetate (because it is a volatile substance). As for the Sigma CSA sample, 2mL of a 1.5mg / mL solution in amonium acetate were prepared. Before the samples were placed inside the column, 100ul of each of the samples were stored for analysis (Input sample - sample that never into the column). The placenta sample was injected into the column with a 2mL syringe, and the run-through (i.e. the sample that did not bind to the column, that was not retained) was collected. This step was repeated five times and the last run-through was collected for further analysis. The column was washed with 10mL PBS and the run-through (PBS wash) was collected for further analysis. The sample was eluted with 2.5mL of elution buffer (0.25M, 1M, 2M of ammonium acetate (NH4OAc)). For each of the elution buffer the eluted samples were taken for further analysis. The column was washed with 10mL of PBS to be prepared for the Sigma CSA sample. The process was repeated in the same way as described above. At the end of this process the column was washed with 2mL of PBS. In parallel, CSA samples were passed through a different VAR2CSA column following the same procedure described. After the PBS
wash step, 10mU of ChABC was loaded into the column and allowed to digest the bound CSA for 2 h at room temperature. The column was then washed again with PBS and eluted in the same way described above.
Separations of proteins and biomolecules (larger than 500Mr)
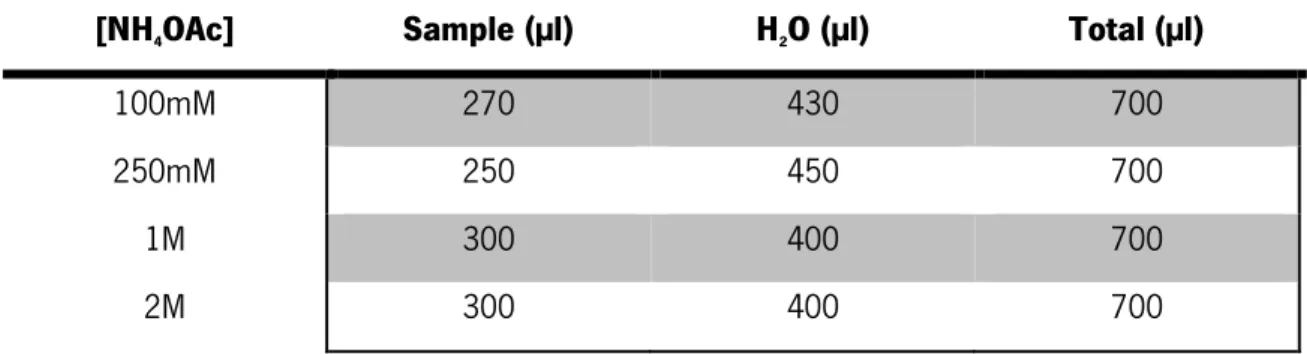
PD MiniTrap G-10 column (from GE Healthcare) is used to make fast separations of proteins and biomolecules larger than 500Mr. However, the same column can also be used for removal of compounds with low weight and desalting. In this case the column was used to remove excess salt from the samples. Through the process of gel filtration chromatography, molecules can be separated based on their sizes [81]. The column was placed in an iron stand with a glass underneath. The top cap of the column was removed and the storage buffer in the column was removed. Column washing elution was performed with water and the flow-through discarded. The column was filled with water and the fixed instrument of the column was placed inside it to later add the samples. Samples were added and water was added to fill a final volume of 0.7mL (Table 2.2). The elution buffer was used, and the eluate was collected. The samples were placed in the speed vacuum over night.
Table 2. 2 Sample values added to the MiniTrap G10 column
[NH4OAc] Sample (µl) H2O (µl) Total (µl)
100mM 270 430 700 250mM 250 450 700 1M 300 400 700 2M 300 400 700
2.4 Analysis processes
2.4.1 HPLCThe process of HPLC allows separation of chemical species that are present in the sample. Because of different molecular structures, functional groups and migration speeds, the different molecules can be
distinguished. The substance with higher affinity towards the column is eluted the last, and the one which elutes first has the lowest affinity to the column [82].
The standard samples of CS/DS disaccharides (from Iduron) – D0A0, D0A4, D0A6, D0A10 were used to quantify the placental sample and also as a standard sample for identification of the different disaccharide peaks of the placenta sample on HPLC chromatograms (Figure 2.2). The sample of CS from bovine trachea (Sigma CSA) (from Sigma-Aldrich) was used as a standard sample CS.
Figure 2.2 - Structure of CS/ DS disaccharides used as sample standards
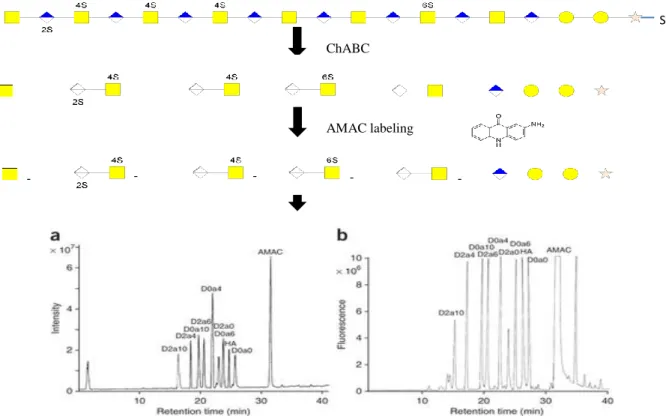
HPLC analysis was first ran on the standard samples (D0A0, D0A4, D0A6, D0A10) and then on samples of purified placental CS and Sigma CSA. Before standard samples are placed in the HPLC (Thermo Scientific Dionex Ultimate 3000) they must be treated in order to achieve a good analysis (Anexo III). In this process we used the substance 2-aminoacridone (AMAC) to label the GAGs reducing ends (its adds to sensitivity because flourescence is stronger than absorbance at 232nm). By marking the GAGs with AMAC, it is possible to separate them using a C18 X-Bridge column Shield column in HPLC. Separation of the AMAC-labeled CS disaccharides by reverse phase chromatography is possible. The separation depends on the hydrophobic binding of the solute molecule from the mobile phase to the immobilized hydrophobic ligands attached to the stationary phase, i.e., the sorbent. The column used in HPLC shows Hydrophobic chains and AMAC, which is marking the CS, has hydrophobic characteristics. So it is possible to separate the disaccharides since these are retained on the HPLC column when the AMAC binds C18 chains (Figure 2.3).
Figure 2.3 - AMAC labeling scheme after ChABC activity. The AMAC labeling allows visualization of the disaccharide peaks in HPLC (Anexo III)
The buffers (A and B) that were prepared previously were placed on the HPLC and the column and a UV detector were also placed. During the first 50 minutes it is necessary to balance the machine with a gradient in a range of 2-30% of the solvent B (equilibration solution) (Table 2.3).
Buffer A: 60mM NH4OAc, pH 5.6 and Buffer B: Acetonitrile
Table 2. 3 Description of the solvents used in HPLC and equilibrium gradients
CS/DS/HA
Column C18 column X-Bridge Shield
Solvent A 60mM NH4OAc, pH 5.6
Solvent B Acetonitrile
Equilibrate solution 2% solvent B
Gradient 2-30% solvent B over 50 min
Ser ChABC
AMAC labeling
-The wavelength to be used is decided after measuring the absorption spectrum of the AMAC. It was found that it had a maximum absorption wavelength of 487nm. Before running the standard samples, a blank test with water only was made. The standard samples were then placed in HPLC in solution, both together and also separately. The procedure was done for the CS from Sigma CSA (10ug). About 10µg of Sigma CSA was digested by ChABC in a 80µl, 12.5mM NaOAc and 80mU of ChABC. The reaction was incubated overnight at 37ºC. After the enzyme was inactivated with a boiling water bath for 10 minutes. The solution was centrifuged at 12,000g for 10 minutes, and the supernant was used for the following steps. The supernant was placed on dry ice for 50 minutes to freeze. Initially, a solution of 0.1M AMAC in glacial acetic acid: dimethyl sulfoxide (DMSO) 3:17 (v/v) (25mg of AMAC, 0.225mL of acetic acid: 1.275mL of DMSO) was prepared. After 50 minutes to freeze it was placed on the lyophilizer for 5 hours to later proceed with the addition of 5µl of AMAC labelling reagents dissolved glacial acetic acid and DMSO in a volume ratio of 3:17 (v/v). The solution was incubated at room temperature for 15 minutes. Then a 1M solution of sodium cyanoborohydride (NaBH3CN) was prepared
and added. The mixture was centrifuged at 10,000g for 1 minute at room temperature. The reaction mixture was incubated at 45°C for 4 hours. On dilution mixture was made into 200ng /µl using DMSO and ultrapure water at 1: 1 ratio (v/v). First test with Sigma CSA sample was made without acetone (C3H6O) precipitation but afterwards C3H6O was used to remove excess of AMAC after lyophilization.
The placenta samples, Sigma CSA purified on HiTrap NHS columns subjected to the same procedures. The remaining samples followed the same procedure, taking into account the following values:
Sigma CSA input:
14.5µl of sample, 25µl of 0.2M NaOAc, 5µl um/µl ChABC, 55.5µl HPLC water
Placenta CS RT, Placenta CS PBS wash, Sigma CSA RT, Sigma PBS wash: 5µl of sample, 25µl of 0.2M NaOAc, 5µl um/µl ChABC, 65µl HPLC water
Placenta CS input, Placenta CS (0.25M, 1M, 2M), Sigma CSA (0.25, 1M, 2M), Digested samples (100mM, 250mM, 1M, 2M):
2.4.2 LC-MS
LC-MS is a method that combines the HPLC technique with mass spectrometry (MS). It is an analytical technique that contains the ability to separate HPLC with the mass detection capabilities of MS. The LC-MS technique has several applications in the separation, in the ability to identify products with very specific masses because it has a very high sensitivity. Through the LC-MS process it is possible to identify non-reducing disaccharide and with only HPLC is not possible to identify this [83, 84]. Samples were analyzed using this method. The same HPLC systems described above was used to deliver the AMAC labelled samples into a Orbitrap Fusion mass spectrometer (Thermo Scientific). The eluents were sprayed using a Thermo Scientific Ion Max interface. The spray voltage was set at 3000 V in the negative mode and the transfer tube temperature was set at 300°C. Typically 0.1 to 0.5µg of GAG samples prior to digestion were injected in a volume of 30µL.
2.5 Results
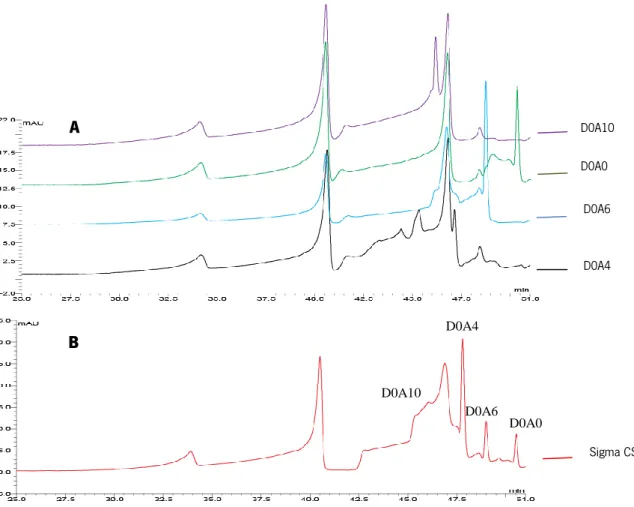
The HPLC separation method was applied to the Sigma CSA, standards of CS and placenta samples. This method allows the separation of the various compounds that are present in the samples. By doing so, it is possible to identify several peaks corresponding to the different CS disaccharides. The first sample to be analyzed on HPLC was the Sigma CSA sample, which was used as a control CS sample (100pmol of sample were injected). After labelling of the Sigma CSA sample with the AMAC fluorescent marker it is possible to identify peaks corresponding to D0A10, D0A4, D0A6, D0A0. The designations D0A10, D0A4, D0A6 and D0A0 correspond to different disaccharides with their respective sulfation at different sites in the chain. D0A0 represents a disaccharide which has no sulfation, D0A4 has a disaccharide having a sulfation at the 4-O position, D0A6 represents a disaccharide having a sulfation at 6-O and D0A10 represents a disaccharide with two sulfation at the 4,6-O. The different disaccharides are identified because they have different retention times according to their greater or lesser affinity to the column (with C18 chains) used in this method. The chromatogram corresponding to the Sigma CSA sample, as well as all other samples, was analyzed at a wavelength of 428nm (Figure 2.4).
Figure 2.4 - HPLC chromatogram of the standard samples (A) and chromatogram of Sigma CSA (B). The peaks D0A10, D0A4, D0A6, D0A0 were identified in the figure by UV absorption at 428nm. In the HPLC chromatogram on the x-axis the retention time corresponding to each peak (minutes) is shown, and on the y-axis is shown mini absorption units (ABS) (mAU), wich is a dimensionless unit based on the Beers' law
The peaks corresponding to the disaccharides present in the Sigma CSA sample were identified. The disaccharide D0A10≈46.5 minutes, D0A4≈47minutes, D0A6≈48.5 minutes and D0A0≈50minutes. Further analysis of the chromatogram allows the identification of peaks that represent noise. These peaks are beyond the peaks of the disaccharides of interest and do not represent sugars. It is possible to identify noise picks in the remaining chromatograms of the other samples. However, the same sample was subjected to C3H6O precipitation after the lyophilization process and before being placed on the HPLC. This procedure aimed to remove the excess of AMAC that could be present in the sample and, consecutively, allow a better identification of the peaks. When comparing the two HPLC chromatograms (Figure 2.5 B, C) it was possible to identify the same peaks (D0A0, D0A4, D0A6, D0A10). However, the identification of the peaks is more clear in Figure 2.5 C. As expected, the retention times of the different disaccharides were the same with or without C HO precipitation. Since
D0A4 D0A6 D0A0 D0A10 D0A4 D0A6 D0A0 D0A10 Sigma CSA A B
the precipitation process proved to be quite effective with regard to the removal of excess AMAC from the sample, this step was applied to the remaining samples before analysing them on the HPLC.
Figure 2.5 - HPLC chromatogram of the Sigma CSA without C3H6O precipitation (B) and with C3H6O
precipitation (C) after lyophilisation with the precipitation is possible to see de peacks more clean. The peaks D0A0, D0A4, D0A6, D0A10 were identified in the figure by UV absorption at 428nm. In the HPLC chromatogram on the x-axis the retention time corresponding to each peak (minutes) is shown, and on the y-axis is shown mini absorption units (ABS) (mAU), wich is a dimensionless unit based on the Beers' law
D0A0 D0A6 D0A4 D0A10 B D0A0 D0A6 D0A4 D0A10 C
The addition of C3H6O to the samples to be analyzed in HPLC results in the formation of a precipitate corresponding to the labeled oligosaccharide. The C3H6O precipitation reduces the excess AMAC that was present in the sample solution [85]. The precipitation result is visible in the chromatogram of the Sigma CSA sample after precipitation with C3H6O (Figure 2.5 C). When comparing the two
chromatograms before and after precipitation (Figure 2.5 B, C) it is found that in the latter, the same peaks are identified more clearly and practically without noise. The C3H6O precipitation process was
repeated for standard samples of CS/DS disaccharides and for the placenta sample. The chromatograms of all the samples were analyzed at a wavelength of 428nm, since it was the value at which a better identification of the peaks was obtained.
Several fractions of the Sigma CSA and placenta samples were collected during the purification process, which were subsequently analyzed by HPLC. Standard samples of the CS disaccharides were also analysed by HPLC (Figure 2.6).
Figure 2.6 - HPLC chromatogram of standard samples. The peaks D0A0, D0A4, D0A6, D0A10 were identified in the figure by UV absorption at 428nm. In the HPLC chromatogram on the x-axis the retention time corresponding to each peak (minutes) is shown, and on the y-axis is shown mini absorption units (ABS) (mAU), wich is a dimensionless unit based on the Beers' law
After the Sigma CSA sample, standard disaccharide samples of CS/DS were analyzed on HPLC. These samples were used to quantify the placenta sample and also as standard samples. The chromatogram
D0A0 D0A6
D0A4
D
of the standard sample was read at a wavelength of 428 nm, as in the Sigma CSA sample and the placenta samples. Through its analysis (Figure 2.6 D) it is possible to identify the peaks D0A4, D0A6, D0A0 by their different retention times. Comparison of the chromatogram of the standard samples with the chromatogram of the placenta sample facilitates identification of the different picks.
Purification of CSA from the placental sample in NHS columns gave rise to different sample fractions which were analyzed on HPLC. The different fractions of analyzed samples provided different information, the sample of placenta input represents the sample before the purification and so when analyzed we perceive which disaccharides make the sample of the placenta before the purification. In the input fraction of the placenta sample it was possible to identify the peaks D0A4, D0A6, D0A0. This identification of the peaks is facilitated by the comparison of the chromatogram of standard disaccharide samples of CS (Figure 2.7 D) with the chromatogram of the placenta input sample (Figure 2.7 E). The retention times of each of the peaks is approximately the same as that of the Sigma CSA sample chromatogram (Figure 2.5 C).
D0A0 D0A6
D0A4
Figure 2.7 - HPLC chromatogram of standard sample (D) and the placenta input (E). The peaks D0A0, D0A4, D0A6 were identified in the figure by UV absorption at 428nm. The peaks of the disaccharides from the placenta input sample are identified by comparison with the chromatogram peaks of the standard sample samples. In the HPLC chromatogram on the x-axis the retention time corresponding to each peak (minutes) is shown, and on the y-axis is shown mini absorption units (ABS) (mAU), wich is a dimensionless unit based on the Beers' law
The run-through fraction of the placenta sample (i.e. the sample that did not bind in the column) was analyzed on HPLC. When comparing the chromatogram of the standard sample with the chromatogram of the run-through sample it was possible to identify all the different peaks D0A0, D0A4, D0A6, D0A10 (Figure 2.8). D0A0 D0A6 D0A4 D E D0A4 D0A6 D0A0
Figure 2.8 - HPLC chromatogram of the standard sample (D) and placenta run-through (F). The peaks D0A0, D0A4, D0A6 were identified in the figure by UV absorption at 428nm. The peaks of the disaccharides from the placenta run-through sample are identified by comparison with the chromatogram peaks of the standard sample samples. In the HPLC chromatogram on the x-axis the retention time corresponding to each peak (minutes) is shown, and on the y-axis is shown mini absorption units (ABS) (mAU), wich is a dimensionless unit based on the Beers' law
In the NHS column, used for the enrichment of the of-CSA from the samples, was added spycatcher (13kDa, 14mg / mL) which allows the binding of the VAR2CSA protein (121kDa) to the column. Subsequently, the placenta sample was passed on the NHS column and the run-through sample was collected. When analyzing this sample in the HPLC, the peaks of the disaccharides D0A4, D0A6 and D0A0 were identified in the chromatogram (Figure 2.8 F). Identification was facilitated by comparison with the standard sample chromatogram (Figure 2.8 D, F). Once the same peaks were identified in the placental input sample (Figure 2.7 E), the chromatograms of the placenta sample input were compared with the run-through sample chromatogram (Figure 2.9 E, F). It can be verified that the amount of D0A4 disaccharide decreases by decreasing the area of the peak in the last chromatogram.
F D0A4
D0A6
Figure 2.9 - HPLC chromatogram of the placenta input (E) and placenta run-through (F). The peak D0A4 was identified in the figure by UV absorption at 428nm. In the chromatogram of the run-through placenta sample, a decrease in the D0A4 disaccharide peak is observed. In the HPLC chromatogram on the x-axis the retention time corresponding to each peak (minutes) is shown, and on the y-axis is shown mini absorption units (ABS) (mAU), wich is a dimensionless unit based on the Beers' law
This comparison shows that in the chromatogram of the placenta run-through sample there is a decrease in the percentage of D0A4 disaccharide. The decrease can be observed by the reduction of peak area corresponding to D0A4 in the chromatogram of the placental run-through sample (Figure 2.9
E D0A4 F D0A4 D0A6 D0A0 E D0A4
F). Decreasing D0A4 disaccharide after passage into the NHS column, enriched with VAR2CSA protein, was expected since the run-through placenta sample is the sample that passed through the column but was not retained. The D0A4 disaccharide was retained, thus showing VAR2CSA protein binding specificity.
After passing the placenta and Sigma CSA samples through the purification column, the sample that was trapped inside the column was eluted with elution buffer. The elution buffer used contained three different salt (NH4OAc) concentrations (0.25M, 1M, 2M). The first concentration (0.25M) is too low to
elute the sample efficiently, the latter concentration (2M) is too high. So, was chosen a lower concentration (1M) to minimize the salt contamination. When comparing the chromatogram of the placenta sample that was eluted with 1M salt (Figure 2.10 G), with the standard sample chromatogram, (Figure 2.10 D) it was possible to notice that the peak that is visible after elution, corresponds to the D0A4 disaccharide.
D0A0 D0A6
D
Figure 2.10 - HPLC chromatogram of the standard sample (D) and the placenta CSA, 1M of NH4OAc
(G). The peaks D0A4 was identified in the figure G by UV absorption at 428nm. The D0A4 disaccharide peak in the chromatogram of the CSA placental sample eluted with a 1 M of NH4OAc solution was
identified by comparison with the chromatogram of the standard samples. In the HPLC chromatogram on the x-axis the retention time corresponding to each peak (minutes) is shown, and on the y-axis is shown mini absorption units (ABS) (mAU), wich is a dimensionless unit based on the Beers' law
The elution solution contains the NH4OAc salt because it breaks the bonds between the VAR2CSA
protein, which is in the column, and the disaccharide binding element to the protein in the column. Thus, it is possible to elute only the sample retained in the VAR2CSA protein (with the 1M of NH4OAc)
and to analyze which type of disaccharide has specificity for this binding. When the chromatogram of the standard sample was compared with the chromatogram of the placenta sample eluted at the concentration of 1M of NH4OAc, it was possible to identify a signal for the D0A4 disaccharide (Figure 2.10 D, G). The same was done for the Sigma CSA sample after it passed the purification column. The chromatogram of the Sigma CSA sample which was also eluted from the column at a salt concentration of 1M showed high similarity to the chromatogram of the placenta sample eluted at the same concentration (Figure 2.11 G, H).
Figure 2.11 - HPLC chromatogram of the placenta CSA, 1M of NH4OAc (G) and sigma CSA, 1M of NH4OAc (H). The peak D0A4 was identified in the figure by UV absorption at 428nm. Both
chromatograms show the same peak corresponding to the disaccharide D0A4. In the HPLC chromatogram on the x-axis the retention time corresponding to each peak (minutes) is shown, and on the y-axis is shown mini absorption units (ABS) (mAU), wich is a dimensionless unit based on the Beers' law
In addition to the HPLC analysis, the samples were analyzed by LC-MS. This method combines HPLC analysis with mass chromatography analysis. Initially, the Sigma CSA sample was analysed (Figure 2.12). By analyzing with the LC-MS method it is possible to identify non-reducing end disaccharides, which would not be possible with HPLC alone. However, it is difficult to accurately match the mass to a specific type of disaccharide because some have the same mass value.
G
H
D0A4
D0A4
Figure 2.12 - Chromatograms corresponding to the Sigma CSA sample at LC-MS analysis. In the LC-MS chromatogram it is possible to identify non-reducing end disaccharides. In the fugura, the different values of mass corresponding to the different disaccharides are observed
Afterwards, the placenta sample was analyzed by the same LC-MS method. Analysis was performed on the sample after the purification of CSA in the first column, without digestion enzymes (Figure 2.13 I), and the placenta sample that was used in the column with digestion enzyme (ChABC) (Figure 2.13 J).
![Figure 1.2 - Representation of the structural diversity of GAGs. Squares represent hexosamine (glucosamine or galactosamine), triangles represent uronic acid (GlcA or IdoUA), the circles represent galactose [7]](https://thumb-eu.123doks.com/thumbv2/123dok_br/17574740.818292/14.892.131.734.120.603/representation-structural-diversity-represent-hexosamine-glucosamine-galactosamine-triangles.webp)
![Figure 1.5 - Various steps in the synthesis of CS, DS, HS and heparin GAG chains [5]](https://thumb-eu.123doks.com/thumbv2/123dok_br/17574740.818292/16.892.123.786.105.914/figure-various-steps-synthesis-cs-heparin-gag-chains.webp)
![Figure 1.6 - Life cycle of malaria parasite [22]](https://thumb-eu.123doks.com/thumbv2/123dok_br/17574740.818292/19.892.148.745.103.725/figure-life-cycle-of-malaria-parasite.webp)
![Figure 1.7 - Representative scheme of PfEMP1 and VAR2CSA. In the image are represented the domains DBL, the CIDR and the segments of interconnection (represented in black) [8]](https://thumb-eu.123doks.com/thumbv2/123dok_br/17574740.818292/21.892.175.697.510.653/figure-representative-scheme-represented-domains-segments-interconnection-represented.webp)