Peculiar Properties of Phase Transitions in Na
0.5Bi
0.5TiO
3-xBaTiO
3(0<x<6) Lead-free
Relaxor Ferroelectrics Seen Via Acoustic Emission
Eveniy Dul'kina*, Jan Suchaniczb, Antoni Kaniac, Michael Rotha
Received: October 22, 2017; Revised: December 10, 2017; Accepted: January 18, 2018
Na0.5Bi0.5TiO3-xBaTiO3 (0<x<6) relaxor ferroelectrics crystals were investigated by means of dielectric and acoustic emission methods. Dielectric curves exhibit the slightly visible small maxima near the depolarization temperatures, Td, and the wide maxima at the temperatures of Tm, whereas the acoustic emission exhibits the sharp bursts, corresponding to Td, Tlm, which is known to be a temperature exhibiting a strong frequency dispersion, TRE, which is known to be a temperature above which a frequency dispersion vanishes, and the Tm and the Tp manifesting a transition to the paraelectric phase. Based on the AE data it was established that all these characteristic temperatures shift down as
x increases, but with different slopes. A mechanism of such the differences is discussed.
Keywords: Relaxor ferroelectrics, phase transformations, depolarization temperature, Curie temperature, acoustic emission.
*e-mail: evgeniy.dulkin@mail.huji.ac.il
1. Introduction
Relaxor ferroelectrics (RFEs) include a large group of solid solutions and complex compounds (mostly oxides) with ABO3 perovskite structure, and their properties are known to be in contrast to the ordered ferroelectrics (FEs). Both Pb-based and Pb-free A(B'1/2B''1/2)O3 and A(B'1/3B''2/3) O3 relaxors attract a great attention due to their intrinsic chemical inhomogeneity and related local structural
distortions due to the difference in ionic charges and radii between the different kinds of B- or A-site cations in the
former (Pb-based)1, or on both A- and B-sites in the latter (Pb-free compounds)2, which is a reason of the existence of polar nanoregions (PNRs) resulting in the giant and smeared maxima of dielectric permittivity, ɛ', at temperature referred as Tm, which depends on the measuring frequency. Being mobile the PNRs nucleate at high enough Burns temperature,
TB, on cooling, below so-called intermediate temperature,
T*, they begin to couple and merge into larger ones, become a long-lived and so the deviation from a Curie-Weiss law and a frequency dispersion starts3, and on further cooling the PNRs become frozen into a nonergodic dipole glass state below Vogel-Fulcher temperature, ascribed as freezing temperature, Tf, some degrees below the Tm1-3. While all these characteristic points: TB, T* and Tm, were detected in Pb-based RFEs4-7 as well as in some Pb-free RFEs8,9, in Pb-free relaxors of Na0.5Bi0.5TiO3-xBaTiO3 (NBT-xBT) they have been established recently using an acoustic emission (AE) method10. Moreover, in the latter paper it was shown
that the temperature Tlm, corresponding to local dielectric maxima of ɛ', or so-called "hump", low temperature and frequency dependent one, plays a role of Tm in the Pb-based RFEs and is caused by interaction between PNRs only, whereas the high temperature maximum of ɛ', ascribed as to be corresponding to Tm, is caused of coexisting of some
phases with which NBT-xBT is known to be rich.
In accordance with the structural studies a sequence of the phase transitions when heating the pure unpoled NBT
crystals and ceramics is following: Trigonal I FE → Trigonal II Antiferroelectrics (AFE) → Tetragonal Ferroelastic (FEl)→
Cubic Paraelectric (PE) at 200, 320 and 547°C with coexisting Trigonal II and Tetragonal phases through 277 ÷ 367°C11,
Rhombohedral FE R3c → Tetragonal AFE P4bm → Cubic
PE Pm3m at 255, 400 and 540°C with coexisting R3c and
P4bm through 255 ÷ 400°C and P4bm and Pm3m through
500 ÷ 540°C12, FE → AFE → FEl → PE at 200, 320 and
540°C13. While the high-temperature data of two latter works coincides well, the data of former work is inconsistent with
them due to presence of low-temperature Trigonal I → Trigonal
II phase transition near 200°C11. Later it was shown12, that there is not any phase transition between room temperature and 250°C, and the observed steep drop of piezomodulus higher than the so-called depolarization temperature, Td ≈
190°C14, is presumably caused by percolation of disordered
P4bm nano-scale platelets15, embedded in the R3c matrix in pure NBT16.
aDepartment of Applied Physics, The Hebrew University of Jerusalem, Jerusalem 91904, Israel bInstitute of Technology, Pedagogical University, Krakov 30-084, Poland
Along with the piezomodulus, on heating the dielectric constant exhibits anomalies around of 200°C, slightly above
Td17-21, accompanied by strong frequency dispersion as well
as marks out the AFE P4bm to PE Pm3m phase transition around the Tm of 320°C17-21. Also these two dielectric anomalies usually accompanied by jumps of the thermal expansion
coefficient17, peaks of differential scanning calorimetry curve22, electrostrictive strain23 and elastic compliance24. In addition, on heating the domain twins appear near 260°C and disappear near 295°C, whereas on cooling they appear near 240°C and disappear near 205°C, exhibiting a hysteresis of about 55°C22,25 and disappear above approximately 540°C25,26.
When incorporating the Ba ions in A-site of NBT-xBT the dielectric anomalies smear and shift by the temperature, but the direction of such the shifts is not clearly seen due to smearing of dielectric curves as well as contradictory sometimes, especially concerning the Tm19-21,27-29. Moreover,
in pure NBT the maximum of ɛ' there is a clearly seen to be
not symmetric: jump of ɛ' on some tens of degrees below
Tm, shifting to lower temperatures and gradually vanishing as the content of Ba increases20,21. Note, that this jump of ɛ' approximately coincides with disappearance of the domain twins near 295°C22,25.
Scrupulous observations of domain morphology, performed with NBT-xBT, allowed the authors30-32 to establish an existence of two-phase mixture (complex domains)
with volumes of R3c FE domains (~100nm) embedded in
the matrix of P4bm AFE nanodomains (<20nm), PNRs,
in NBT-6BT ceramics (core-shell grain structure) at room temperature, that does provide the excellent piezoelectric properties. In particularly, in NBT-6BT particularly, lying in the middle of morphotropic phase boundary, around 40% of the grains display such complex domains with R3c-P4bm
structure, while the rest ones display P4bm PNRs only. On heating the volume fraction, containing these complex FE domains, starts to shrink at around Td ≈ 120°C and this
process continues until ~160°C when the whole grain is
completely occupied by PNRs with P4bm symmetry. The
R3c → P4bm structural phase transition undergoes through
the finite temperature interval of about 40°C: the volume
with P4bm PNRs expands at the expense of the volume
with the R3c complex domains and finally occupies the
whole grain. During further heating the major part of P4bm
PNRs transform to P4bm long-range phase near TRE ≈
220-230°C though their small amount exists far above the Tm32, and above of 335°C the tetragonal - cubic structural phase transition takes place at Tp.
Previously the dielectric constant, measured on heating in NBT-6BT crystals, clearly shows the low temperature "hump" of ɛ' 19,27-30 between of 140 and 220°C, accompanied by AE bursts between of 127 and 225°C, which also exhibits the bursts corresponding to Tm ≈ 290°C and Tp ≈ 390°C,
respectively33. Recently, using the AE, it was confirmed that the temperature of this "hump", ascribed as the Tlm, exhibits the strong frequency dispersion, whereas the Td exhibits no dispersion, and all these characteristic temperatures of NBT-6BT: Td ≈ 123°C, Tlm ≈ 150÷180°C, TRE ≈ 225°C, Tm ≈
300÷310°C and Tp ≈ 327°C have been successfully detected
by AE10, in good agreement with the early detected data33. Because AE has proven itself to be a reliable method to detect all the characteristic temperatures in NBT-6BT relaxors ferroelectrics more precisely in comparing with the smeared maximum of dielectric permittivity, we have applied it to detect of these temperatures in NBT-xBT compounds and to study their shift in dependence on the Ba content.
2. Experimental Details
Na0.5Bi0.5TiO3-xBaTiO3 (x = 0; 2; 2,5; 3,25 and 6) crystals were grown using a Czochralski method. Powder reagents of Na2CO3, BaCO3, Bi2O3 and TiO2 were used as the starting materials. Stoichiometric amounts were weighed and homogenized in agate vessel in alcohol for 2 h. The obtained mixture was then calcined at 800ºC for 4 h. The crystal growths were carried out at concentration dependent temperatures from the range 1300-1360ºC. The obtained crystals with dimensions about 1.5 mm × 1.5 mm × 2.5 mm were homogeneous, transparent and slightly yellowish. No cracks and inclusions were observed. The silver contacts were
fired at 650°C for 30 min. We used the unpoled samples in
order to avoid the changing in phase structure that can be
completely altered after applying an electric field17. AE is known to be a nondestructive method, based on detection of the mechanical elastic waves, radiated by the
different structural defects in the solid states under some external loadings: stress, temperature, electric field, as well
as by arising of the mechanical twins during the martensite phase transitions in metals and their alloys. The waves are detected using a piezoelectric sensor, fairly often connected with the sample through a dielectric acoustic waveguide to avoid of its overheating34. Traditionally in FEs the AE is well proven in detection of the structural phase transitions, Tc, due to arising of the domains and their mechanical interaction35-38 as well as recently it is well proven in a study of all the characteristic temperatures in RFEs: Tm, T* and TB due to arising of the PNRs and their mechanical interaction4-10,33.
AE technique has been described previously elsewhere11. A sample was pasted with a silver epoxy on the polished side of a fused silica acoustic rod waveguide. A PZT-19 disk piezoelectric sensor was attached to the rear end of the waveguide. A sensor was electrically coupled to a 500
kHz bandpass low noise variable (up to 40 dB) preamplifier connected to a detector-amplifier (40 dB). A Ch-Al thermocouple
waveguide with the pasted sample is vertically mounted from below into resistance element furnace. The dielectric data were measured using a HP4263A LCR meter wired to
the sample. All the thermocouple, amplifier, and LCR meter
outputs were interfaced with a PC for a coupled readout. The measurement of the dielectric constant real part ɛ' and
AE count rate (s-1) were performed in the temperature
range of 20-400°C with a rate of about 1-3°C/min at the measuring frequency of 1 kHz on heating.
3. Result and Discussion
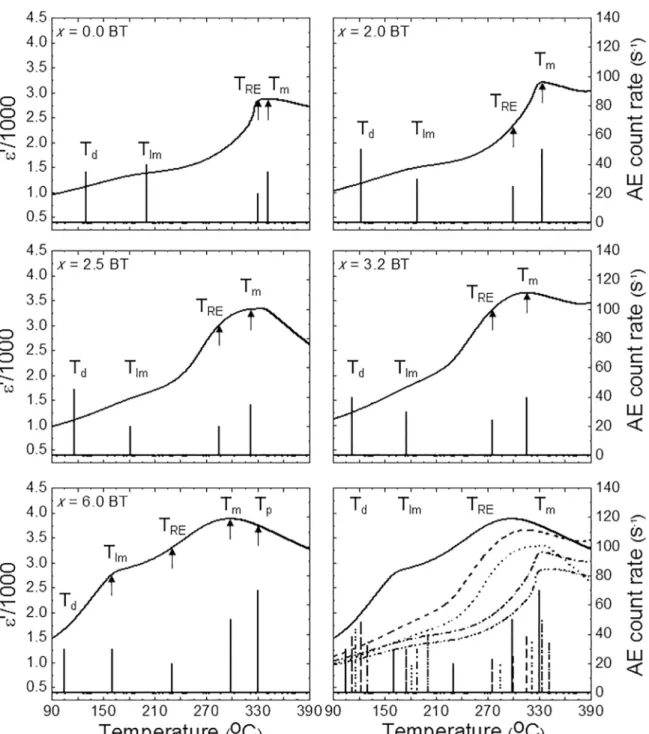
Figure 1 presents the temperature dependences of the real part of dielectric constant ɛ' and AE count rate for all the compounds. The ɛ' (T) curves exhibit two groups of
smeared (diffused) humps and maxima: the low temperature
humps corresponds to Tlm, in the range of 150-200ºC and the high temperature maxima corresponds to Tm in the range of 300-350ºC. These results are in good agreement with previous studies10,19,21,27-31,33. For pure NBT the form of the ɛ' curve is not symmetric around Tm: from the low temperature side it is steeper in comparison with the high temperature side, as observed previously21. With an increase in the Ba content the dielectric constant ɛ' around Tm becomes symmetric and gradually rises in both the Td and Tm when they shift towards the lower temperature in good coincidence with the previously observed data, too19,20,22.
AE exhibits four bursts in all the compounds, corresponding to Td ≈ 105 ºC ( ≈ 30 s-1), 112 ºC ( ≈ 40 s-1), 116 ºC ( ≈ 45 s-1), 123 ºC ( ≈ 50 s-1), 130ºC ( ≈ 34 s-1); T
lm ≈ 160ºC ( ≈ 30 s-1), 175ºC ( ≈ 30 s-1), 180ºC ( ≈ 20 s-1), 188ºC ( ≈ 30 s-1), 200ºC ( ≈ 40 s-1); T
RE ≈ 230ºC ( ≈ 20 s -1),
275ºC ( ≈ 24 s-1), 285ºC ( ≈ 20 s-1), 300ºC ( ≈ 24 s-1), 331ºC ( ≈ 20 s-1); T
m ≈ 298ºC ( ≈ 50 s
-1), 315ºC ( ≈ 40
s-1), 322ºC ( ≈ 36 s-1), 333ºC ( ≈ 50 s-1), 342ºC ( ≈ 34 s-1), except of NBT-6BT, in which it exhibits the sixth burst, corresponding to Tp ≈ 330ºC ( ≈ 70 s-1). Two lowest bursts clearly separate the Td, exhibiting no frequency dispersion, from Tlm, exhibiting the essential frequency dispersion10,18-20,27
and obeying the Vogel-Fulcher law39. For pure NBT both
the TRE and Tm are located close to each other what causes the non symmetric form of ɛ' curve around Tm.
Although the AE bursts exhibits some scattering in the values, some trends of distribution are still visible (Table 1). Indeed, it is well seen that the values of , corresponding to both Td and Tm, are stronger than the one, corresponding to TRE. Such the distribution of values of is similar that
previously observed when transforming through the R3m
rhombohedral - Amm2 orthorhombic - P4mm tetragonal -
Pm3m cubic phase transitions in BaTiO3 ceramics35. Moreover, it is clearly seen, too, that the becomes stronger when
transforming through the AFE P4bm - FEl P4/mbm - PE
Pm3m phases in good coincides with one previously observed in some well-known perovskite FEs, undergoing through the AFE - FE - PE phases37. Thus, one can conclude the AE
method rightly reflects the sequence of the phase transitions in RFEs and so could be to apply for express identification
of their phase transitions types by the quantities of , as it was revealed in Ref.37.
All the AE bursts point out the phase transitions, taking place in NBT-xBT compounds, except of Tlm. AE bursts,
accompanying the Tlm was recently shown to correspond
the interaction between the PNRs only10. Concerning the
phase transitions they can be qualified based on the structural
data11-16 and scrupulous studies of domain structure22,25,26,30-32. On heating at Td the R3c → P4bm phase transition starts and this temperature is even ascribed to be the Curie temperature,
Tc26, and such the statement closes a row of the characteristic points in NBT-xBT family: Td ≡ Tc, Tlm ≡ Tm of Pb-based RFEs, TRE ≡T*10, and the T
B ≈ 420÷450ºC
40. During this phase
transition the frequency dispersion of a dielectric constant exists up to TRE, where the long-range P4bm phase arises. So, the relaxor property of NBT-xBT continues from Td to
TRE. Presumably, at Tm the P4bm phase transforms to the tetragonal centrosymmetric P4/mbm nonpolar ferroelastic phase16, which further transforms to Pm3m phase at T
p. AE points out the Tp ≈ 330°C only for NBT-6BT compound, for
other compositions the Tp lies upper of a heating possibility of our furnace.
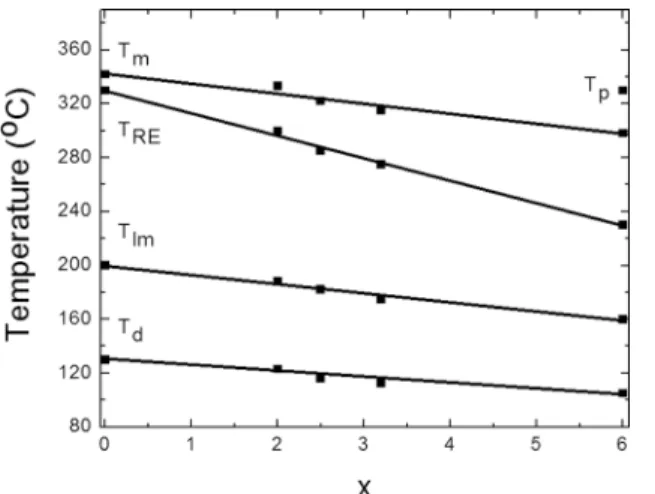
Figure 2 presents the temperatures of all the characteristic points, detected by AE, as a function of Ba content x. All the temperatures decrease linearly with ecreasing x. Similar linear down of Tc was earlier observed in BaTiO3 crystals when substituting the Ba ion by its heavier isotope41. So, a decrease in the phase transitions temperatures with enhancement of x
leads us to conclude that the Ba ion mainly substitutes the light Na ion rather than the heavy Bi ion, especially since both radii of Na and Bi are nearly equal to each other: 1.18Å
≈ 1.17Å (CN = 8).
On the other hand, the slopes of these linear dependencies
are essentially different. Indeed, while the slopes of Tm, Tlm
and Td are found to be approximately the same order of magnitude: -7.3, -6.6, and -4.2, respectively, the slope of TRE
is found to be -16,6 as well. Taking into account that both the FE R3c and AFE P4bm phases coexist between Td and
TRE, we tend to think that such the steep slope of the TRE (x) dependence is caused by a chemical pressure contributed by the incorporated Ba ions as their content increases. Recently based on both the theoretical and experimental data it was shown that a pressure downs the temperature of FE-AFE phase transition steeper than the temperature of AFE-PE phase transition42, in good agreement with our
present data. And, thus, we have confirmed that P4bm phase is really the AFE one.
N
o
N
o
N
o
N
o
N
o
Figure 1. The plot of dielectric and acoustic emission data measured in Na0.5Bi0.5TiO3-xBaTiO3 relaxor ferroelectrics crystals (dash-dot-dot: x=0.00; dash-dot: x=0.02; dot: x=0.025; dash: x=0.0325; solid: x=0.06).
Table 1. Values of AE count rate , corresponding to Td, Tlm, TRE, Tm and Tp in NBT-xBT crystals.
(s-1)
x = 0.0 x = 2.0 x = 2.5 x = 3.2 x = 6.0
Td 34 50 45 40 30
Tlm 40 30 20 30 30
TRE 20 24 20 24 20
Tm 34 50 36 40 50
Tp 70
No
6. Dul'kin E, Mihailova B, Gospodinov M, Roth M. Effect of A-site La, Ba, and Sr doping on the threshold field and characteristic temperatures of PbSc0.5Nb0.5O3 relaxor studied by acoustic emission. Journal of Applied Physics. 2013;113(5):054105.
7. Dul'kin E, Kania A, Roth M. Characteristic temperatures of PbFe1/2Nb1/2O3 ferroelectrics crystals seen via acoustic emission. Materials Research Express. 2014;1(1):016105.
8. Dul'kin E, Zhai J, Roth M. Acoustic emission pronounced field-induced response near critical point in Ba0.6Sr0.4TiO3
ferroelectrics. Physica Status Solidi A. 2014;211(7):1539-1544.
9. Dul'kin E, Kojima S, Roth M. Dielectric maximum temperature non-monotonic behavior in unaxial Sr0.75Ba0.25Nb2O6 relaxor seen via acoustic emission. Journal of Applied Physics. 2011;110(4):044106.
10. Dul'kin E, Tiagunova J, Mojaev E, Roth M. Peculiar properties of phase transitions in Na0.5Bi0.5TiO3-0.06BaTiO3 lead-free relaxor ferroelectrics seen via acoustic emission. Functional Material Letters. 2017;10:1750048.
11. Siny IG, Tu CS, Schmidt VH. Critical acoustic behavior of the relaxor ferroelectric Na1/2Bi1/2TiO3 in the intertransition region. Physical Review B. 1995;51(9):5659-5665.
12. Jones GO, Thomas PA. Investigation of the structure and phase transitions in the novel A-site substituted distorted perovskite compound Na0.5Bi0.5TiO3. Acta Crystallographica Section B. 2002;58:168-178.
13. Isupov VA. Ferroelectric Na0.5Bi0.5TiO3 and K0.5Bi0.5TiO3 Perovskites
and Their Solid Solutions. Ferroelectrics. 2005;315(1):123-147.
14. Hiruma Y, Nagata H, Takenaka T. Thermal depoling process and piezoelectric properties of bismuth sodium titanate ceramics. Journal of Applied Physics. 2009;105(8):084112.
15. Aksel E, Forrester JS, Kowalski B, Jones JL, Thomas PA. Phase transition sequence in sodium bismuth titanate observed using high-resolution x-ray diffraction. Applied Physics Letters. 2011;99(22):222901.
16. Trolliard G, Dorcet V. Reinvestigation of Phase Transitions in Na0.5Bi0.5TiO3 by TEM. Part II: Second Order Orthorhombic to Tetragonal Phase Transition. Chemistry of Materials. 2008;20(15):5074-5082.
17. Smolenskii GA, Isupov VA, Agranovskaya AI, Krainik NN. New ferroelectrics of complex composition. Soviet Physics Solid State. 1961;2(11):2651-2654.
18. Tu CS, Siny IG, Schmidt VH. Sequence of dielectric anomalies and high-temperature relaxation behavior in Na1/2Bi1/2TiO3. Physical Review B. 1994;49(17):11550-11559.
19. Xu C, Lin D, Kwok KW. Structure, electrical properties and depolarization temperature of (Bi0.5Na0.5)TiO3-BaTiO3 lead-free piezoelectric ceramics. Solid State Science. 2008;10(7): 934-940.
20. Chen M, Xu Q, Kim BH, Ahn BK, Ko JH, Kang WJ, et al. Structure and electrical properties of (Na0.5Bi0.5)1-xBaxTiO3 piezoelectric ceramics. Journal of the European Ceramic Society. 2008;28(4):843-849.
Figure 2. The plot of downs the phase transitions temperatures detected by acoustic emission in Na0.5Bi0.5TiO3-xBaTiO3 relaxor
ferroelectrics crystals in dependence on x.
4. Conclusion
In summary, we have investigated the Na0.5Bi0.5TiO3
-xBaTiO3 (0<x<6) relaxor ferroelectrics crystals by means of dielectric and acoustic emission methods. We have detected all the phase transitions: ferroelectric-rhombohedral
→antiferroelectric-tetragonal, starting above Td and finishing
above TRE; antiferroelectric-tetragonal →
ferroelastic-tetragonal at Tm; and ferroelastic-tetragonal →
paraelectric-cubic at Tp. We have plotted the shifts of these temperatures with dependence on Ba content and established that all the temperatures decrease as Ba content increases. Also we have found out that the TRE decreases steeper in comparing with the others and have shown that such the steeper decrease of TRE is characterisitc for ferroelectric-rhombohedral →
antiferroelectric-tetragonal phase transition when enhancing an intrinsic pressure as Ba content increases.
5. References
1. Bokov AA, Ye ZG. Recent progress in relaxor ferroelectrics with perovskite structure. Journal of Materials Science. 2006;41(1):31-52.
2. Shvartsman VV, Lupascu DC. Lead-Free Relaxor Ferroelectrics. Journal of the American Ceramic Society. 2012;95(1):1-26.
3. Toulouse J. The Three Characteristic Temperatures of Relaxor Dynamics and Their Meaning. Ferroelectrics. 2008;369(1):203-213.
4. Dul'kin E, Roth M, Janolin PE, Dkhil B. Acoustic emission study of phase transitions and polar nanoregions in relaxor-based systems: Application to the PbZn1/3Nb2/3O3 family of single crystals. Physical Review B. 2006;73(1):012102.
21. Suchanicz J, Kruzina TV, Pozdeev VG, Popov SA. Influence of Ba addition on the dielectric and optic properties of (1-x) Na0.5Bi0.5TiO3-xBaTiO3 (x = 0, 0.025, 0.0325 and 0.05) single crystals. Phase Transitions. 2016;89(3):310-316.
22. Pronin IP, Syrnikov PP, Isupov VA, Egorov VM, Zaitseva NV. Peculiarities of phase transitions in sodium-bismuth titanate. Ferroelectrics. 1980;25(1):395-397.
23. Suchanicz J, Roleder K, Kania A, Hańaderek J. Electrostrictive strain and pyroeffect in the region of phase coexistence in Na0.5Bi0.5TiO3. Ferroelectrics. 1988;77(1):107-110.
24. Cordero F, Craciun F, Trequattrini F, Mercadelli E, Galassi C. Phase transitions and phase diagram of the ferroelectric perovskite (Na0.5Bi0.5)1-xBaxTiO3 by anelastic and dielectric measurements. Physical Review B. 2010;81(14):144124.
25. Kruzina TV, Duda VM, Suchanicz J. Peculiarities of optical behaviour of Na0.5Bi0.5TiO3 single crystals. Materials Science and Engineering: B. 2001;87(1):48-52.
26. Yao J, Yan L, Ge W, Luo L, Li J, Viehland D, et al. Evolution of domain structures in Na1/2Bi1/2TiO3 single crystals with BaTiO3. Physical Review B. 2011;83(5):054107.
27. Swain S, Kar SK, Kumar P. Dielectric, optical, piezoelectric and ferroelectric studies of NBT-BT ceramics near MPB. Ceramics International. 2015;41(9 Pt A):10710-10717.
28. Kanuru SR, Baskar K, Dhanasekaran R, Kumar B. Growth of NBT-BT single crystals by flux method and their structural, morphological and electrical characterizations. Journal of Crystal Growth. 2016;441:64-70.
29. Badapanda T, Sahoo S, Nayak P. Dielectric, Ferroelectric and Piezoelectric study of BNT-BT solid solutions around the MPB region. IOP Conference Series: Materials Science and Engineering. 2017;178:012032.
30. Ma C, Tan X. Phase diagram of unpoled lead-free (1-x) Na0.5Bi0.5TiO3-xBaTiO3 ceramics. Solid State Communications. 2010;150(33-34):1497-1500.
31. Ma C, Tan X, Dul'kin E, Roth M. Domain structure-dielectric property relationship in lead-free (1-x)Na0.5Bi0.5TiO3-xBaTiO3 ceramics. Journal of Applied Physics. 2010;108(10):104105.
32. Ma C, Tan X. In situ Transmission Electron Microscopy Study on the Phase Transitions in Lead-Free (1-x)Na0.5Bi0.5TiO3 -xBaTiO3 Ceramics. Journal of the American Ceramic Society. 2011;94(11):4040-4044.
33. Dul'kin E, Mojaev E, Roth M, Greicius S, Granzow T. Detection of phase transitions in sodium bismuth titanate-barium titanate single crystals by acoustic emission. Applied Physics Letters. 2008;92(1):012904.
34. Boyko VS, Garber RI, Kossevich AM. Reversible Crystal Plasticity. New York: American Institute of Physics; 1994.
35. Kalitenko VA, Perga VM, Salivonov IN. Determination of the temperatures of phase transitions in barium and strontium titanates by acoustic emission. Soviet Physics Solid State. 1980;22:1067-1068.
36. Shimada S, Katsuda Y, Inagaki M. Phase Transition of KNO3
Monitored by Acoustic Emission Technique and the Healing
Effect on the γ → α Transition. The Journal of Physical
Chemistry. 1993;97(34):8803-8807.
37. Dul'kin EA. Ferroic phase boundaries investigations by the acoustic emission method. Material Research Innovations. 1999;2(6):338-340.
38. Prabakar K, Mallikarjun Rao SP. Acoustic Emission During Phase Transition in Soft PZT Ceramics Under an Applied Electric Field. Ferroelectric Letters Section. 2005;32(5-6):99-110.
39. Garg R, Rao BN, Senyshyn A, Ranjan A. Long ranged structural modulation in the pre-morphotropic phase boundary cubic-like state of the lead-free piezoelectric Na1/2Bi1/2TiO3-BaTiO3. Journal of Applied Physics. 2013;114(23):234102.
40. Suchanicz J, Kruzina TV. Dielectric properties, thermal expansion and heat capacity of (1-x)Na0.5Bi0.5TiO3-xBaTiO3 crystals (x = 0, 0.02, 0.025, 0.0325 and 0.05). Materials Science and Engineering: B. 2013;178(13):889-895.
41. Hidaka T, Oka K. Isotope effect on BaTiO3 ferroelectric phase
transitions. Physical Review B. 1987;35(16):8502-8508.