Use of Fluorescence in a Modified Disector Method to Estimate the
Number of Myocytes in Cardiac Tissue
Rômulo Dias Novaes
1, Arlete Rita Penitente
1, André Talvani
2, Antônio José Natali
1, Clóvis Andrade Neves
1, Izabel
Regina dos Santos Costa Maldonado
1Universidade Federal de Viçosa, Viçosa1; Universidade Federal de Ouro Preto e NUPEB, Ouro Preto2, MG, Brazil
Abstract
Background: Conventional disector methods currently require considerable financial, technical and operational costs to estimate the number of cells, including cardyomyocytes, in a 3D area.
Objective: To use fluorescence microscopy in a modified disector method to determine the number of myocytes in cardiac tissue in normal and pathological conditions.
Methods: The study employed four-month-old male Wistar rats with weight of 366.25 ± 88.21g randomized in control (CG, n=8) and infected (IG, n=8) groups. IG animals were inoculated with T. cruzi Y strain (300,000 trypomastigotes/50g wt). After eight weeks, the animals were weighted and euthanized. The left ventricles (LV) were removed for stereological analysis of numerical density of cardiomyocytes (Nv[c]) and total number of these cells in the LV (N[c]). These parameters were estimated using a fluorescent disector (FD) and compared with the conventional optical (OD) and physical (PD) disector methods.
Results: In both disector methods, IG animals presented significant decrease of Nv[c] and N[c] compared to CG animals (P< 0.05). There was no significant difference in these variables despite the disector method applied in CG and IG animals (P> 0.05). A strong correlation, equal or above 96%, was obtained between FD, OD and PD.
Conclusion: The FD method seems to be equally reliable to determine Nv[c] and N[c] in normal and pathological conditions and presents some advantages compared to conventional disector methods: reduction of histological slices and images in the stereological analysis, reduction of time to analyze the images, construction of FD in simple microscopes using the epifluorescence mode, distinction of disector planes in lower magnifications. (Arq Bras Cardiol 2012;98(3):252-258)
Keywords: Cell separation; flow cytometry; myocytes, cardiac.
Mailing Address: Rômulo Dias Novaes •
Av. PH Rolfs, S/N - Campus Universitário - Centro - 36570-000 – Viçosa, MG, Brasil
E-mail: [email protected]
Manuscript received July 08, 2011, revised manuscript received August 18, 2011; accept August 26, 2011.
both methods have reduced the bias of particle quantity estimation, they still required the acquisition of a large number of histological images and a great deal of time to perform the counts. Particularly, the optical disector also requires a light microscope of high cost adapted with axis-Z mobile stage11. Moreover, the physical disector is extremely laborious because it requires serial histological sections and images with a perfect alignment in the different parallel sections3,10.
Considering that the aim of the sampling design for stereology is to obtain the maximal amount of quantitative structural information at a given total cost, time or effort, the purpose of this study was to use fluorescence microscopy in a modified disector method to determine the number of myocytes in cardiac tissue in normal and pathological conditions. Thus, a murine model of T. cruzi infection that recognizably conduces to disruption of cardiac myocytes and modifies the number of these cells in the myocardium was used.12 We hypothesized that the proposed method would reduce the operational cost observed in conventional methods, while maintaining the accuracy of cell quantity measurements.
Introduction
Over the past years a great effort was made to develop a reliable and reproducible method to estimate the number of particles in organs and tissues, but until 1984, all these methods had intrinsic biases1-3. In 1984, Sterio described several modifications in the approaches used to estimate the quantity of objects in three-dimensional space and introduced the disector method4. Most authors currently consider the
disector method unbiased and the well-established theoretical background makes the method largely acceptable5-7.
Methods
Animals and experimental groups
Four-month-old male Wistar rats with initial weight of 366.25 ± 88.21 g were provided with rodent chow and water ad libitum and maintained in animal facilities in a controlled environment (temperature at 22 ± 3 ºC, humidity at 60 - 70 % and 12 hour light/dark inverted cycles). Sample sizes were determined considering the probability p = 1/2 to occur increase or decrease of the variables of interest. Thus, considering the significance level α = 0.05, the minimal significant number of animals used in the statistical analysis was: p = (1/2)events; therefore, if n = 5, p = (1/2)5 or p = 0.03; then, p < 0.05.10 Due to the intrinsic variability of the parasitism in target organs and the mortality associated with T. cruzi infection, a correction factor of 50% was incorporated into the initial calculation, determining samples of 8 animals, randomly allocated into control (CG, n = 8) and infected (IG, n = 8) groups.
Infection
IG animals were inoculated intraperitoneally with T. cruzi Y strain (300,000 trypomastigotes/50g body weight in 1 ml of infected mice blood13. Infection was confirmed four days post-inoculation by the presence of trypomastigotes in peripheral blood collected from the rat’s tail as described by Brener14. All experimental procedures were conducted in accordance with the Brazilian College of Animal Experimentation and approved by the Animal Research Ethics Commission of the Veterinary Department of the Universidade Federal de Viçosa, Brazil (protocol number 30/2009).
Biometrical analysis
Eight weeks after inoculation, the animals were euthanized under anesthesia and the hearts were removed. The left ventricles (LV) were dissected and weighed separately. LV volume was obtained by the submersion method, where the liquid displacement from the organ volume is weighed. As the specific gravity (σ) of isotonic saline is 1.0048, the volume is obtained by: volume= weight/σ, or simply volume (103 mm3) ≈ weight (g)15. LV weight and volume was determined including the interventricular septum.
Tissue processing and determination of histological areas The atria and ventricles were put into histological fixative for 48 hours (freshly prepared 10% w/v formaldehyde in 0.1 M phosphate buffer pH 7.2)16,17. LV fragments were obtained through the orientator method to define isotropic and uniform random sections (IUR) required in the stereological study3. These fragments were dehydrated in ethanol, cleared in xylol and waxed. Blocks were cut into 3 μm sections and stained by hematoxylin-eosin (H&E) or 4’,6-diamidino-2-phenylindole at 0.2% (DAPI)18.
The representative number of disectors used in the stereological analysis for each animal was determined considering the stabilization of the coefficient of variation (CV) of number of myocytes nuclei in ascending random samples
of disectors (5, 10, 15, 20 and 25). Then, the arithmetical mean and the respective CV for each sample size were calculated. When the increase of disector numbers resulted in no significant difference of CV between 3 consecutive samples, the smallest sample size was considered as the minimal representative size19. Using this method, the variation of number of myocytes nuclei was stabilized from the sample of 10 disectors.
Optical and physical disector methods
Sections stained with H&E were mounted on histology slides using Entelan® mounting medium (Merk, Darmstadt,
Germany) and the images were captured using a light microscope (Olympus BX-60®, Tokyo, Japan) connected
to a digital camera (Olympus QColor-3®, Tokyo, Japan).
Observation was made with a 100× planachromatic oil immersion objective (NA= 1.25) to clearly identify cardiomyocyte (cmy) nuclei boundaries16,17.
The number of cardiomyocyte nuclei (cmyn) in a 3-dimensional probe was estimated using the optical (OD) and physical (PD) disector methods3. The disector consists of
2 parallel planes aimed at sampling ‘‘top points’’ of particles in between. Sampling volume was created with 2 parallel sections separated by 3 μm (h) and 2 reference planes both containing a test frame (AT). In both disector methods, a pair of photomicrographs separated by h distance is used to form the two reference planes. In the OD, the parallel photomicrographs are obtained in the same histological area adjusting the focal plane (h = 3 μm) using the micrometrical screw. In the PD, two serial sections are obtained in the microtome (h = 3 μm) and the same histological area is photographed in both sections, supplying two photomicrographs physically separated.
Fluorescent disector method
In the fluorescent disector method (FD), sections stained with DAPI were mounted on histology slides using 50% sucrose solution in distillated water (w/v). Images were captured in an epifluorescence mode of the same microscope using a HBO 100 mercury lamp and a filter for dye excitation at 365 nm and a light emission at 460 nm. Observation was made with the same 100× planachromatic lens previously described. In this method, using the 3 μm (h) sections, the two reference planes required to delimitate the disector are obtained in a unique image and pairs of photomicrographs are not required as in the conventional methods. Furthermore, the cmyn present over the thickness of the section may be observed inside or outside the focal plane. To avoid repeat cells count, sections were obtained in semi-series, using 1 in every 20 sections. The FD was additionally obtained with a 40× objective lens only to demonstrate the possibility of applying the method using smaller magnifications.
Estimation of numerical density and total number of cardiomyocytes
The numerical density of cmyn (Nv[c], cmyn per mm3) was determined from 10 random disector pairs for each animal, defined as Nv[c]= Q-[cmyn] / h×A
T ; where Q
- represents the
disector reference section (‘‘look-up’’ plane).3,17 In the FD, the Q
-value in the Nv[c] formula was multiplied by a correction factor of 0.5 to avoid overestimation of measures. The total number of cmyn in the LV (N[c]) was estimated as the product of Nv[c] / LV volume. The counts were performed in an AT= 2670 μm2. All stereological analyses were performed using the software Image Pro-Plus 4.5® (Media Cybernetics, Silver Spring, USA).
Statistical analysis
All analyses were performed using the statistical platform GraphPad Prism (version 5.01, GraphPad Software, San Diego, CA). Data are expressed as mean and standard deviation (mean ± S.D.). The normality of data distribution was verified using the Kolmogorov-Smirnov test. Based on this test, weight and volume data were compared using the t-test. The Mann-Whitney U test was used to compare the stereological data between the groups. The disector methods were compared using the Kruskal-Wallis test and correlated using the Spearman’s method. Statistical significance was established at α = 0.05.
Results
There was no statistical difference in body mass (CG, 502.17 ± 57.76 g vs. IG, 494.69 ± 87.90 g; p > 0.05) and left ventricle volume (CG, 456.47 ± 26.18 mm3 vs. IG, 487.69
± 34.89 mm3; p > 0.05) between the groups.
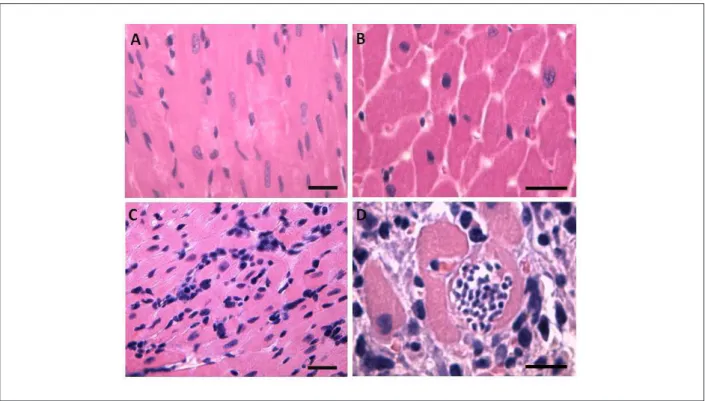
The histopathological analysis of the LV showed a marked diffuse inflammatory infiltrate in IG. Moreover, this group had a disorganization of histological structure with an increased interstitial area and a larger distance between the ventricular myocytes. These cells also showed an increased cross-sectional area and some these presented a narrowing of cytoplasm region induced by a large amount of T. cruzi amastigote forms (Fig. 1).
The conventional OD is represented in fig. 2. In this method, the disector was obtained in the same microscopic image adjusting the Z axis of the microscope to create an optical separation of 3 μm between the images. In the physical method (image not shown), the disector was obtained using the microscopic images of two different serial histological sections physically separated at the same distance as in the OD (3 μm).
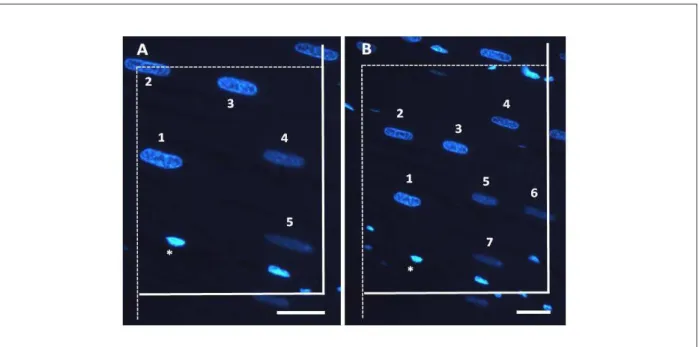
The proposed disector method, named fluorescent disector (FD), is represented in fig. 3. In this method, the disector was obtained in the same microscopic image through the differential fluorescence emission by the cmyn. While in the OD and PD 160 photomicrographs (80 disector pairs) were required in the stereological analysis, in FD, half of the microscopic images (80 individual disectors) was used.
In the FD, a correction factor of 50% was incorporated into the formula used to determine Nv[c] in OD and PD. Thus, the formula used to estimate Nv[c] in the FD was
Figure 1 -Representative photomicrographs of left ventricle of control (A and B) and infected (C and D) groups. The infected animals were inoculated intraperitoneally
Figure 2 - Representative photomicrographs of the two disector focal planes separated by 3 µm of distance (h). Disector is the union of a reference plane with an unbiased counting frame of area (AT) and a look-up plane at distance h apart. Cardiomyocyte nuclei (cmyn) are counted or sampled because 1) they are hit by the
reference plane, 2) their transects are captured by the counting frame in there, and 3) they are not hit by the ‘‘look-down’’ plane and in the forbidden edge of AT (thick edge). (A) There are two cmyn in the frame of the ‘‘look-up’’ plane (numbered) and only the cmyn 2 should be counted. In this plane, we also observe the shadow of the
other cmyn (1) and a fusiform ibroblast nuclei (*) that are not counted because they violate at least 1 of the 3 preceding requirements. (B) The cmyn 1 is in the focus
of the ‘‘look-down’’ plane and the cmyn 2 is a shadow outside the focus. If h and AT are known, the disector volume is determined. Dividing the number of nuclei by this
volume, a direct estimate of Nv[c] is obtained (magniication 1000×, bar= 15µm, H&E stain).
Figure 3 - Representative photomicrograph of the fluorescent disector method obtained using 100× (A) and 40× (B) objective lens. In this method, two different
Table 1 - Numerical density and absolute number of cardiomyocytes in the left ventricular myocardium of control and infected rats
OD PD FD
Nv[c] / mm3
Control 17,5424.64 ± 6,135.36 18,3977.32 ± 9,162.78 17,2429.44 ± 8,123.37
Infected 90,771.41 ± 3,314.30* 95,352.20 ± 3,144.13* 91,141.127 ± 3,741.09*
N[c] x 104
Control 7,948.51 ± 471.45 8,302.75 ± 519.98 8,017.90 ± 474.789
Infected 4,665.58 ± 318.99* 5,042.18 ± 371.44* 4,969.99 ± 354.77*
Data are expressed as mean ± S.D; OD - Optical disector; PD - Physical disector; FD - Fluorescent disector; Nv[c] - numerical density of cardiomyocytes; N[c] - absolute
number of cardiomyocytes. All values were obtained using a 100× objective lens (magniication 1000×)*, denoting a statistical difference compared to CG (p < 0.01),
Mann-Whitney U test. There are no statistical differences between the disector methods, Kruskal-Wallis test.
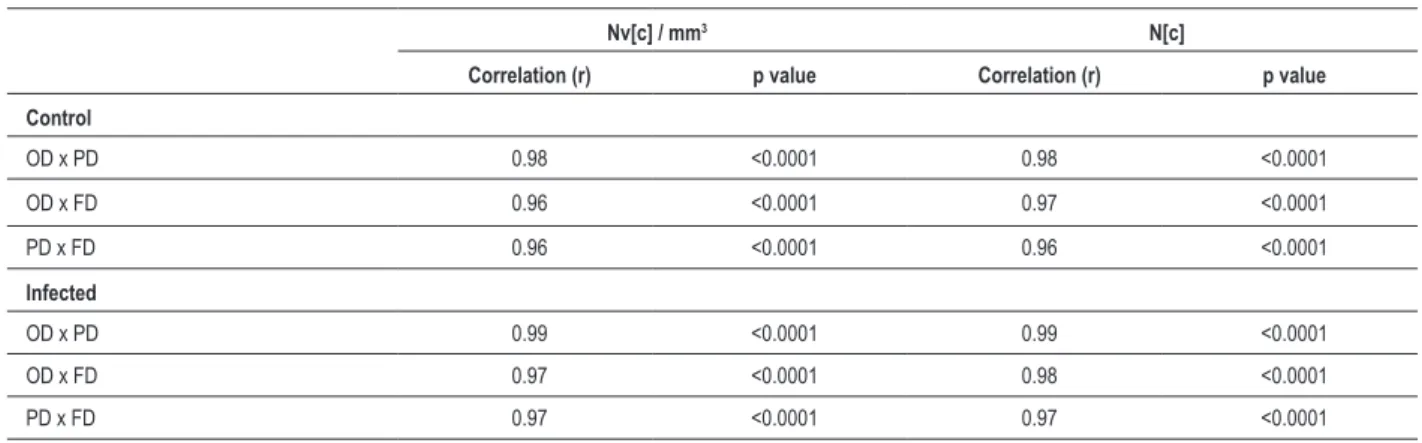
Table 2 - Correlations between the results of numerical density and absolute number of left ventricular myocytes obtained using different
disector methods in control and infected rats
Nv[c] / mm3 N[c]
Correlation (r) p value Correlation (r) p value
Control
OD x PD 0.98 <0.0001 0.98 <0.0001
OD x FD 0.96 <0.0001 0.97 <0.0001
PD x FD 0.96 <0.0001 0.96 <0.0001
Infected
OD x PD 0.99 <0.0001 0.99 <0.0001
OD x FD 0.97 <0.0001 0.98 <0.0001
PD x FD 0.97 <0.0001 0.97 <0.0001
OD - Optical disector; PD - Physical disector; FD -* Fluorescent disector; Nv[c] - numerical density of cardiomyocytes; N[c] - absolute number of cardiomyocytes. The results relate to the data obtained using a 100× objective lens (magniication 1000×). Correlations were tested using the Spearman’s method.
Nv[c]= Q-[cmyn] × 0.5 / h×A
T; where the constant 0.5 was established to avoid overestimation of cmyn count in FD.
The results of Nv[c] and N[c] obtained using the different disector methods are showed in table 1. In both disector methods, the infected animals presented significant decrease of both variables compared to control animals. There was no significant difference in the values of these variables despite the disector methods used.
Table 2 shows the result of correlation analysis of Nv[c] and N[c] obtained using the different disector methods. A strong, direct and significant correlation was obtained in all correlations between both methods.
Discussion
For many years, the morphological studies of biological tissues were based on ambiguous histopathological descriptions. Initially the symbols used to indicate the increase or decrease of a variable is the best way to express the data in a semi-quantitative context20. As these morphological approaches
were further refined, a two-dimension (2D) quantitative system was incorporated into the histological and pathological
analysis to describe the morphometrical characteristics of organs and tissues1,21,22. These refinements introduced significant
advances in histo-quantitative studies. However, the estimation of microscopic parameters in a three-dimension (3D) space remained as an issue still not well resolved, and the conventional morphometric methods presented intrinsic biases that reduced the reliability of morphological measurements2,3,23.
Considering the intrinsic bias of several morphometrical measurements, calculations of probability statistics and geometry applied in geology and other soil sciences were adapted to the study of biological materials1,24, forming the
basis of current stereology3. The development of stereology is
an important evolution in histo-quantitative methods, allowing the development of more accurate and reliable morphological data9,10,25,26.
Estimation of quantity of objects in biological tissue has been a crucial issue in morphological studies and diagnostic pathology, constituting the more refined measures in stereology3,7. The development of disector methods by Sterio in 1984 led to a creative and relatively simple way to estimate the number of particles in an organ or tissue4. However, the
that increase the time and cost of data acquisition5,8,10. The need to obtain and analyze a large number of microscopic images is a common limitation of both OD and PD methods, especially when several groups and tissue samples are studied at once. Moreover, the costs for acquiring or adapting a microscope with controlled Z axis contribute to limit the application of OD11. On other hand, obtaining a PD is extremely laborious because it involves the quality of the microtomy, appropriate processing of serial sections and technical ability to determine a perfect alignment of these sections4. Furthermore, minimal alignment error can lead to a bias in the cell count characterized by an overestimation or underestimation of stereological outcomes. Thus, these conventional disector methods still require considerable financial, technical and operational costs to estimate the quantity of particles in a 3D area11.
This study proposes an alternative method to estimate the quantity of myocytes in the cardiac tissue using fluorescence microscopy in a modified disector method. The construction of a FD was based on similar requirements as used for particle counts described in the conventional disector methods. However, an adaptation of the formula to determine N[c] was required in FD. The introduction of a correction factor was necessary to reduce overestimation of measurements. In conventional methods, particle count results exclude those which hit the forbidden plane (generally look-down plane), contributing to reduce the measurement bias27,28. As in the FD, the presence or absence of
the same particle cannot be observed in both disector planes, as it occurs in OD and PD. The calculation of probability determines a 0.5 correction factor to the N[c] formula, considering 50% of chances of a particle be observed or not in both planes.
The application of the FD using the proposed method provided similar results of Nv[c] and N[c] compared to the other disector methods, without any significant differences between the methods. Both methods presented sufficient sensibility to determine the reduction of left ventricle myocyte number in the murine model of T. cruzi-induced cardiac infection. This model was selected for this study due to the well-established tropism to cardiac tissue presented by this parasite and its ability to reduce the number of myocytes due to parasite replication, differentiation and cell evasion, which propagates in an ongoing destructive process12,13.
In addition, the correlations between the FD with conventional methods were strong, indicating that the FD method may be
equally reliable to estimate the number of myocytes in the cardiac tissue. The reliability of these measures seems to be maintained in both health and pathological conditions.
Although the FD is also an optical method, this study demonstrated that the FD may also be obtained using objective lens with lower magnifications (40×) compared with conventional lens (100×) required in OD. In OD, lower magnifications are not often used because they determine a large depth-of-field, which hinders the acquisition of different disector focal planes (look-up
and look-down) because it maintains all section structures inside the focus, in despite of the Z axis adjustment3.
Conclusion
The FD described in this study offered an alternative method to estimate the number of myocytes in the cardiac tissue. This method seems to be equally reliable in normal and pathological conditions to determine the same parameters of Nv[c] and N[c] obtained using conventional disector methods. Although the results has been similar between the three methods, the FD showed some advantages compared to OD and PD such as: 1) reduction (by half) of the number of histological slices and images required in the stereological analysis, 2) reduction of time to analyze the required images, 3) construction of FD in simple microscopes using the epifluorescence mode, 4) distinction of disectorlook-up and look-down planes using lower magnifications, 5) reliability of stereological results demanding reduced technical and operational cost compared to the OD and PD methods.
Potential Conflict of Interest
No potential conflict of interest relevant to this article was reported.
Sources of Funding
There were no external funding sources for this study.
Study Association
This article is part of the thesis of Doctoral submitted by Rômulo Dias Novaes, from Universidade Federal de Viçosa.
References
1. Weibel ER, Kistler GS, Scherle WF. Practical stereological methods for morphometric cytology. J Cell Biol. 1966;30(1):23-38.
2. Aherne WA. Methods of counting discrete tissue components in microscopical sections. J R Micr Soc. 1967;87(3):493-508.
3. Mandarim-de-Lacerda CA. Stereological tools in biomedical research. An Acad Bras Cienc. 2003;75(4):469-86.
4. Sterio DC. The unbiased estimation of number and sizes of arbitrary particles using the disector. J Microsc. 1984;134(Pt2):127-36.
5. Dorph-Petersen KA, Nyengaard JR, Gundersen HJ. Tissue shrinkage and unbiased stereological estimation of particle number and size. J Microsc. 2001;204(Pt3):232-46.
6. Charleston LB, Thyer AC, Klein NA, Soules MR, Charleston JS. An improved method for the production of slides from oversized samples of glycol methacrylate-embedded tissues: Application for optical disector based stereology. J Histotechnol. 2003;26(1):49-52.
7. Eisele JC, Schaefer I-M, Nyengaard JR, Post H, Liebetanz D, Brüel A, et al. Effect of voluntary exercise on number and volume of cardiomyocytes and their mitochondria in the mouse left ventricle. Basic Res Cardiol. 2008;103(1):12-21.
9. Weibel ER. Measuring through the microscope: development and evolution of stereological methods. J Microsc. 1989;155(Pt3):393-403.
10. Cruz-Orive LM, Weibel ER. Recent stereological methods for cell biology: a brief survey. Am J Physiol. 1990;258(4 Pt1):148-56.
11. Xavier-Vidal R. Disector Z-axis mechanical method for stereology. An Acad Bras Cienc. 2010;82(2):539-44.
12. Marin-Neto JA, Cunha-Neto E, Maciel BC, Simões MV. Pathogenesis of chronic Chagas’ heart disease. Circulation. 2007;115(9):1109-23.
13. Martinelli PM, Camargos ER, Azevedo AA, Chiari E, Morel G, Machado CRS. Cardiac NGF and GDNF expression during Trypanosoma cruzi infection in rats. Auton Neurosci. 2006;130(1-2):32-40.
14. Brener Z. Therapeutic activity and criterion of cure on mice experimentally infected with Trypanosoma cruzi. Rev Inst Med Trop São Paulo. 1962;4:389-96.
15. Scherle W. A simple method for volumetry of organs in quantitative stereology. Mikroskopie. 1970;26(1):57-60.
16. Xavier-Vidal R, Neves MC, Villar VC, Viana WN, Mandarim-de-Lacerda CA. Estereologia do miocárdio em fetos humanos: estudo quantitativo das modificações estruturais nos dois últimos trimestres de gestação. Arq Bras Cardiol. 1993;60(4):221-4.
17. Xavier-Vidal R, Madi K. Comparação entre os miocárdios ventriculares direito e esquerdo durante período fetal humano: uma avaliação estereológica. Arq Bras Cardiol. 1999;72(5):581-6.
18. Masotti L, Cavatorta P, Avitabile M, Barcellona ML, von Berger J, Ragusa N. Characterization of 4’-6 diamidino-2 phenylindole (DAPI) as a fluorescent probe of DNA structure. Ital J Biochem. 1982;31(2):90-9.
19. Moro L, Vasconcelos AC, Santos FGA, Alves CM, Nunes JES, Sampaio IBM. Determination of the minimal representative number of microscopical fields to quantify apoptosis in canine lymph nodes. Arq Bras Med Vet Zootec. 2004;56(3):408-10.
20. Bucher O. [Contribution on the method of morphometry]. Anat Anz. 1967;120(1):39-40.
21. Rohr H. Principles, possibilities of use and limits of morphometry. Acta Histochem Suppl. 1976;16:83-9.
22. Rohr H, Oberholzer M, Barstsch G, Keller M. Morphometry in experimental pathology: methods, baseline data and applications. Int Rev Exp Pathol. 1976;15:233-325.
23. Elias H, Hyde DM. A guide to practical stereology. NewYork: Karger; 1983.
24. Chalkley HW. Methods for quantitative morphological analysis of tissues. J Natl Cancer Inst. 1943;4:47-53.
25. C o l l a n Y. S t e r e o l o g y i n d i a g n o s t i c p a t h o l o g y. Pa t h o l o g i c a . 1997;89(4):462-6.
26. von Bartheld C. Counting particles in tissue sections: choices of methods and importance of calibrationto minimize biases. Histol Histopathol. 2002;17(2):639-48.
27. Weibel ER. Stereological methods: practical methods for biological morphometry. London: Academic Press; 1979.