EXPERIMENTAL COMPARISON AT OPEN AND CLOSED VERTICAL
MULTIDECKS DISPLAY CASES AT STANDARD AND TROPICAL
ENVIRONMENTAL CONDITIONS
Gustavo G. Heidinger
1,2, Samuel M. Nascimento
1,2, Pedro D. Gaspar
2,3and Pedro D. Silva
2,3 1: Eletrofrio Refrigeração Ltda, r João Chede, 1599, Cidade Industrial, Curitiba – PR, 81170-220, Brazile-mail: gustavo@eletrofrio.com.br, samuel@eletrofrio.com.br, web: http://www.eletrofrio.com.br 2: University of Beira Interior, Engineering Faculty, Department of Electromechanical Engineering, Covilhã,
6201-001, Portugal
e-mail: dinis@ubi.pt, dinho@ubi.pt, web: http://www.ubi.pt
3: C-MAST - Centre for Mechanical and Aerospace Science and Technologies, Covilhã, Portugal
Abstract: This paper reports the results of experimental tests performed according to ISO 23953 in vertical
open and closed multideck display cases to evaluate the influence of double glass doors in the direct energy consumption, product simulator temperature, evaporator total condensed water mass, total heat load and total energy consumption. Tests were performed at climate classes n.º 3 (Ta = 25°C; a = 60%) and n.º 6
(Ta = 27°C; a = 70%). The direct energy consumption is 46% higher at the closed display case due to the
heat load generated by the heated glass doors frame and defrost heaters. The product simulator temperature is higher and more stable at the open display case. The highest product simulator temperature is lower (-1.4°C) at the closed display case and less stable (+2.7°C variation) due to the opening doors period. The total mass of condensed water at the evaporator is reduced 87% and the total energy consumption is 58% lower at the closed display case. In conclusion, the estimated total energy consumption (compressor and components) is reduced at the glass doors display case. Thus, it is verified that the use of refrigeration equipment closed to ambient air is increasingly seen as the definitive solution, given the current concerns with energy consumption and sustainability of the heat exchange processes.
Keywords: Display case, glass doors, environmental conditions, energy consumption.
1.
INTRODUCTIONRefrigerated display cases can be classified based on several criteria, however, the most usual classification is vertical, semi-vertical, horizontal and combined; which can be closed or opened to the store environment; for self-service or not. Open refrigerated displays cases are those whose products access occurs without the need to open doors or lids and closed refrigerated displays cases are those where there is a need to open doors or lids to access the products. (ISO 23953, 2015). Each display case has its own characteristic operating temperature, based on the type of product that could be ice cream, frozen products, fresh meat, dairy products or fruits and vegetables.The overall performance and energy consumption of these equipment are directly influenced by the surrounding environmental conditions, i.e., temperature, humidity and movement of the ambient air (infiltration load) as shown by Tassou and Datta (1999), Gas Research Institute (2000), Gaspar et al. (2009), Mousset and Libsig (2011), Heidinger et al. (2013) and Heidinger et al. (2016). The vertical open refrigerated display cases (VORDC) has the highest energy consumption due the infiltration load, which is between 67% to 81% of its total heat load (Faramarzi, 1999, Gaspar et al., 2011 and Chieffo et al, 2018). Thus, the type of equipment most scientifically studied (numerically and experimentally) was the VORDC in order to improve the energy efficiency by optimizing air curtain performance and velocity profiles. The researches aim to minimize the thermal exchange between the external (environmental) and internal (refrigerated space) air and, in this way, optimize the overall operation of the VORDC (Gaspar et al., 2010, Chen et al., 2011, Cao et al., 2011, Laguerre et al., 2012, Nascimento et al., 2015 and Nascimento et al., 2016). Nowadays, to reduce the energy consumption, the VORDC are being replaced or retrofitted by the vertical closed refrigerated display case (VCRDC), i.e., with glass doors. Computational fluid dynamics simulations have been performed to quantify the VCRDC heat load components (Orlandi et al., 2013). However, Evans (2014) compiled a series of studies related to the
exposed products that may reduce the product sales. Nevertheless, Frickie and Becker (2010) concluded that the installation of VCRDC do not have effect on product sales, but may improve the food safety and eliminate the cold aisle effect.
The worldwide certification and approval pattern of refrigerated display cases is based on a specific ambient air temperature and humidity, therefore, more severe applications are rarely studied or developed. The USA industry considers the ambient air conditions of Ta = 24°C and a = 55% (ASHRAE Standard 72, 2014) and
the European industry uses the ambient air conditions of Ta = 25°C and a = 60% (climate class n.°3 - ISO
2395, 2015) as standards for approval of this type of equipment (critical summer condition). There are stores located at semi-tropical or tropical climate regions, without air conditioning systems (eg Brazil, Australia, Mexico, Thailand and Singapore) where the environment is more severe than the standard. The ambient air condition of Ta = 27°C and a = 70% (climate class n.° 6 - ISO 23953, 2015) was defined as the climatic
class of tropical climates for conducting the experimental tests. Based on experimental results comparing the VORDC and the VCRDC performance, the present work aims to present a level of knowledge to assists the refrigerated display cases design and operation, due to the conditions of the ambient air in which the equipment is used. Thus, this paper reports the results of experimental tests performed according to ISO 23953 in VORDC and VCRDC to evaluate the influence of double glass doors in the direct energy consumption, product simulator temperature, evaporator total condensed water mass, total heat load and total energy consumption. Tests were performed at climate classes n. º 3 (Ta = 25°C; a = 60%) and n.º 6
(Ta = 27°C; a = 70%).
2. EXPERIMENTAL PROCEDURE
Experimental tests were conducted in an environmental test chamber shown in Figure 1, constructed according to ISO 23953 (2015) to keep the air temperature and humidity surrounding the display cases at the climactic class n.° 3 (Ta = 25°C; a = 60%) or at the climactic class n.°6 (Ta = 27°C; a = 70%) The test room
is a parallelepiped shaped space in which two of the opposing sidewalls are designed to provide a uniform horizontal airflow (va = 0.1 to 0.2 m/s) through the room. External walls and the ceiling are thermally
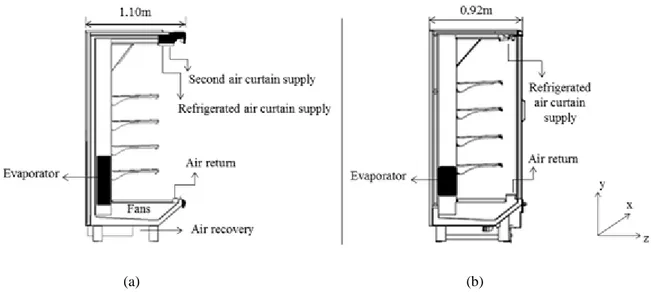
insulated to ensure the correct temperature inside the test room. Cooling, heating and humidification of the ambient air are carried out, respectively, by an evaporating coil, heating devices and water vapor mixed to the airflow on the ducts. The test VORDC has 2.62m×2.12m×1.10m with a dual air curtain and 4 shelves as shown in Figure 2(a). The test VCRDC has 3.82×2.10m×0.92m with six doors and four shelves as shown in Figure 2(b). The VORDC has 2.50 meters and the VCRDC has 3.75 meters of useful length (x).
(a) (b)
Figure 2. Tested refrigerated display cases: (a) VORDC and (b) VCRDC.
This industry field develop the display cases to be modular. In this case, the equipment lengths could be multiples of 1.25m, thus, the fans, lighting and heaters are proportional. Thus, the condensed water mass comparisons will be made per unit of length. One of the main functions of refrigerated cases is display as many products as possible into the smallest available display area, so the energy consumption comparisons will be based on the total display area of the equipment.
Figure 3 shows the diagram of the experimental system. The refrigerant circuit is composed only by the four main components of the refrigeration cycle. A hydraulic pump drives the water used to draw heat from the cooling system in the condenser. A control valve, which keeps the condensing temperature approximately constant, controls the water flow. The heat is rejected through a cooling tower in the water circuit.
Figure 3 – Experimental system diagram.
The manufacturer of the refrigerated displays cases recommends for ideal operation, an evaporation temperature of -10±1 °C, both equipment are used for displaying meat products, which temperature should
(evaporation pressure) by an inverter and there is no controller to stop the compressor work, whether a thermostat that ceases its operation depending on temperature, or some other mechanism, which turns off the compressor during the operating period, i.e., there is no solenoid valve or set-point control at the refrigerant liquid line, thus the display cases are at the maximum possible refrigeration during all the tests period. The compressor is only turned off when the defrosting process begins. The high pressure was controlled by a manual water flow valve to keep the condensation temperature at 39±1 °C with a natural subcooling of 10±1 °C at the display case inlet. The VCRDC needs a special device to open doors automatically, each door must open once every ten minutes. The total duration of each door opening should be 6 seconds. Opening to an angle greater than 60° should last 1 second, 4 seconds of open door (> 60 °) and 1 second for closing. The door opening test period should be 12 hours per day (ISO 23953, 2015).
Each test period lasted 24 hours and was repeated three times. To measure the R22 refrigerant enthalpies, the temperature and pressure were collected on the suction and liquid lines according to the recommendations provided by ISO 23953 (2015). The mass of water condensed during defrost was manually collected and measured in each test period. A Coriolis flowmeter was used to measure the outlet mass flow of the liquid coolant, 𝑚̇𝑟, that passed through the evaporator during each operating period. The standard ISO
23953 (2015) also defines the quantity and positions for the temperature sensors of the product simulators. Therefore, a total of 54 temperature sensors were installed in order to find the warmest product simulator. This product simulator will possess the most representative temperature to classify the refrigerated display cases as function of the displayed required product temperatures.
The following comparisons are based on the electrical nominal data, evaporator construction, the warmest product simulator temperature, the total mass of condensed water on the evaporator fins, total heat load and energy consumption (direct, refrigeration, total). Table 1 shows the experimental tests (ET) conditions.
Table 1. Experimental tests.
ET Display case Climate class
01 VORDC 3 (25°C/60%)
02 VORDC 6 (27°C/70%)
03 VCRDC 3 (25°C/60%)
04 VCRDC 6 (27°C/70%)
3. THEORETICAL CALCULATIONS
The calculations were taken according to the standard ISO 23953 (2015) to calculate the total display area, TDA, and the energy consumption indicators (direct daily electrical energy consumption, DEC [kWh/24h]; refrigeration daily electrical energy consumption, REC [kWh/24h]; total daily electrical energy consumption, TEC [kWh/24h]; and specific daily electrical energy consumption, SEC = TEC/TDA [kWh/24h]).
The TDA is based on the horizontal and vertical projections lengths of the dimensions that allow the visualization of merchandising, i.e., the parameter that allows the comparison between the product visualization allowed by the equipment.
The DEC corresponds to the components of the energy consumption of fans, heaters and lighting electrical power and respective operation times. The total heat load is calculated from the mass flow of the liquid coolant, that passes through the evaporator during each operating period and the refrigerant fluid inlet and outlet enthalpies. The REC is calculated based on the total heat load to estimate the compressor energy consumption on a standard operational condition and at the average refrigerant evaporation temperature. The TEC is the sum of DEC and REC.
In order to compare the VORDC and the VCRDC performance, as they have different lengths, the specific energy consumption indicators were used based on the total display area.
4. ANALYSIS AND DISCUSSION OF RESULTS
4.1 Constructive, operational and direct energy consumption data
Table 2. Constructive and operational data of VORDC and VCRDC.
Constructive and operational data VORDC VCRDC
Fins dimensions (mm x mm) 130 x 400 130 x 150
Number of tubes (evaporator) 24 8
Fins spacing (mm) 10 8
Evaporation mean temperature (°C) -10 -10
Number of daily defrosts 10 2
Defrost duration (min) 12 25
Defrost type Natural Electrical
Fans power (W) 318 159
Anti-sweat heaters power (W) 0 472
Lighting power (W) 32 48
Defrost heaters power (W) 0 2200
Total electrical power (W) 350 2879
Direct energy consumption- DEC (kWh/24h) 8.02 17.56
Total display area – TDA (m²) 4.24 5.63
Specific direct energy consumption – SDEC (kWh/24h.m²) 1.89 3.12
Due to the use of doors, the fins area is reduced by 62% and the number of tubes in the evaporator is reduced by 67%. These numbers indicate a large reduction of the thermal load. The number of daily defrosts has been reduced from 10 to 2, because the doors are a much more efficient barrier than just the air curtain to the external air infiltration, which also explains the reduction in ventilation power. The LED lighting used in the tests was proportional based on the display case length. The refrigerated display cases are designed to operate in tropical climates, so there are anti-sweat heaters to prevent the water condensation on the frames of the double glass doors. During night and closed-door defrost periods, there is less ambient air infiltration and, consequently, a difficulty defrost without heating the air, so defrost heaters are used in the evaporators. Thus, the total installed electrical power of the VCRDC is 8 times higher than the electrical power installed in the VORDC. The difference in electrical energy consumption is not so great since, the defrost heaters are turned on only for 50 minutes per day. The DEC values were 65% higher for the VCRDC than the VORDC. In this case, the DEC and SDEC values are independent of the environmental conditions because the refrigerated display cases are originally designed to operate on the climate class n.° 6, i.e., the anti-sweat heaters are not optimized for each environment condition and the defrost is terminated by time.
4.2 Product simulator temperature
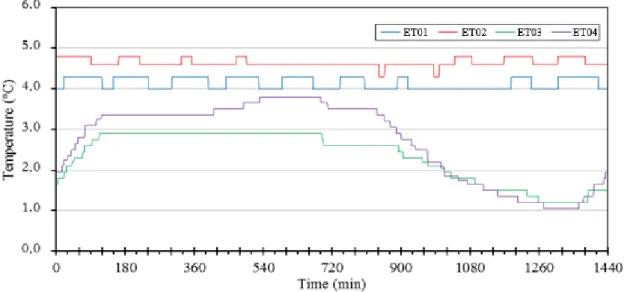
The VORDC show higher and more uniform product storage temperature values because the infiltration of external air into the refrigerated space is constant throughout the operation period under the test conditions, i.e., there’s no consumers taking products off, walking in front of the VORDC or opening doors on the VCRDC. The VCRDC test show lower temperature values of the product simulators and with considerably variation due to the periods with and without door opening (Figure 4). During the door opening period, product temperatures range up to 2.7°C due to the external air infiltration into the refrigerated space. As stated above, the warmest product simulator is the most representative temperature (among the 54 temperature points acquired) to classify the refrigerated display cases as function of the displayed required product temperatures. Thus, comparing the ETs in climatic class n.° 3 (ET01 and ET03), the maximum temperature of the warmest product simulator is 1.4°C lower in VCRDC tests. In the climatic class n.° 6 experimental tests (ET02 and ET04), the maximum temperature of the warmest product simulator is 1.0 °C lower in the VCRDC tests. Thus, the two displays meet the standard temperatures (class M1, from -1.0 °C to +5.0 °C), but the VCRDC presents lower product conservation temperatures. The VCRDC product temperature evolution indicates the possibility of too lower product conservation temperatures values in winter times without set-point control, thus, on real situations, the set-point control will keep the product temperature values on the desired range and, in addition, the evaporation temperature could be increased to save energy as well.
Figure 4. Warmest product simulator temperatures.
4.3 Condensed defrost water
Water condensation and freezing affect the overall performance of the display cases. As much for VORDC as for VCRDC, when the climactic class changes from n.° 3 to n.° 6 (ET01 vs. ET02; ET03 vs. ET04) occurs an increase of approximately 46 % in the evaporator condensed water mass. However, the absolute quantity is quite different as shown by the same environmental condition tests (ET01 vs. ET03; ET02 vs. ET04), the water and ice formation in the VCRDC evaporator is reduced by 87% (Figure 5). Therefore, the drastic reduction in the amount of defrost water due to the doors use is fundamental to increase the efficiency of refrigerated display cases. This situation also allows to reduce the stops required to defrost the evaporator, and, consequently, reduces the temperature pull-down energy consumption.
Figure 5. Defrost condensed water mass.
4.5 Refrigeration energy consumption
The VCRDC total heat load is substantially reduced due to the increased protection provided by the doors use. The air infiltration reduction reduces mainly due to the reduction of the latent heat load as less moisture exists at the refrigerated space. Figure 6 shows the SREC in each of the ETs.
The SRECVORDC increases 25% when the climactic class changes from n.° 3 to n.° 6 (ET01 vs. ET02) while
the SRECVCRDC increases 12% (ET03 vs. ET04). Thus, the increase on the ambient air enthalpy affects more
and humid air infiltration. Comparing the ETs in climatic class n.° 3 (ET01 and ET03), the SREC of the VCRDC is 72% lower than in the VORDC. At the climatic class n.°6 (ET02 and ET04), the SREC in the VCRDC is 75% lower than in the VORDC. Therefore, the compressor energy consumption is significantly lower when the vertical refrigerated displays cases have doors and the main benefit is the impact on the heat load. The hotter and humid the environment is, the more important is the doors use because the VORDC energy consumption is very dependent on the climate conditions.
Figure 6. Specific refrigeration consumption.
4.6 Total energy consumption
Considering the energy consumption of the fans, lighting and heaters, SDEC, added to the estimated compressor energy consumption, SREC, i.e., the total energy consumption of the refrigerated display cases per unit of display area, SEC, represents the absolute difference between the energy performance of VORDC and VCRDC. Figure 7 shows the SEC values for the ET’s.
When the environmental condition changes from climate class n.° 3 to the climate class n.° 6 the SECVORDC
increases 21% while the SECVCRDC increases 6%. At climate class n.° 3 the VCRDC uses 52% less energy
than the VORDC and in climatic class n.° 6 the reduction increases to 58%. Thus, the VCRDC needs more DEC (+65%) mainly due the heated doors for tropical climates, but the REC is reduced (up to -75%) which is much more significant to these display cases energy efficiency.
5. CONCLUSIONS
The significant increase in the electrical energy cost motivates and accelerates the use of more efficient refrigerated display cases. In order to overcome the existing thermal loads, the evaporator fins thermal exchange area for the VCRDC is 62% lower, with 67% fewer cooper tubes than the VORDC. The maximum product temperatures on VCRDC are about 1.4 °C lower than the VORDC, however, more temperature oscillation occurs due to the door opening period. The use of glass doors reduces the latent heat load up to 87% and provides a total saving on energy consumption up to 58% (-9.57 kW/24h.m². These factors are of
extreme relevance when choosing the right equipment even if the VCRDC initial investment cost is higher. The refrigerated display cases installed or retrofitted with glass doors still require new experimental tests varying the store internal environmental to design the anti-sweat heaters electrical power which was not presented in this work. The anti-sweat heaters impact on the specific direct energy consumption (up to 65%, +1.23kW/24h.m² in this case). Other benefit to the supermarket or convenience food store lie in the reduced
index of spoiled products as a function of a lower storage product temperature at the VCRDC (- 1.4°C). The use of doors reduces energy consumption of refrigerated cabinets. The use of the doors is highly recommended when the equipment will operate in tropical climates and, due to its acceptable acquisition cost (+28%), many commercial establishments invest in the retrofit of their equipment, that is, they install the doors on equipment that are originally open. Thus, it is verified that the use of refrigeration equipment closed to ambient air is increasingly seen as the definitive solution, given the current concerns with the energy consumption and sustainability of the heat exchange and food preservation processes. In this perspective, the design of vertical refrigerated display cases under tropical climates could use the four experimental tests results to consider the specific refrigeration energy consumption data and the water condensation rates trends to design the heat exchanger area for climatic conditions that exceed the limit defined worldwide as standard for homologation of open and closed refrigerated displays cabinets.
NOMENCLATURE
The nomenclature should be located at the end of the text using the following format:
ET Experimental test (–)
DEC Direct energy consumption (kW/24h)
REC Refrigeration energy consumption (kW/24h)
SDEC Specific direct energy consumption (kW/24h.m²)
SEC Specific total energy consumption (kW/24h.m²)
SREC Specific refrigeration energy consumption (kW/24h.m²)
T Temperature (°C)
TDA Total display area (m²)
TEC Total energy consumption (kW/24h)
v Velocity (m/s)
VCRDC Vertical closed refrigerated display case (–)
VORDC Vertical open refrigerated display case (–)
ϕ Relative humidity (%)
Subscript
a Air
ACKNOWLEDGEMENT
This work was supported by Eletrofrio Refrigeração. Authors thank Eletrofrio (Mr. Paulatti and Mr. Eng. Chueire) for allowing the publication of some research results.
REFERENCES
ASHRAE 72 (2014), Method of testing open and closed commercial refrigerator and freezers, American Society of Heating, Refrigeration and Air-Conditioning Engineers (ASHRAE).
Cao, Z., Gu, G. & Han, H. (2011). A novel optimization strategy for the design of air curtains for open vertical refrigerated display cases. Applied Thermal Engineering 31(16), 3098–3105.
Chen, Y.G. & Xia, D.H. (2011). The flow characteristics analyses of refrigerated air curtains in multi-deck display cabinets. 23rd International Congress of Refrigeration, Prague, Czech Republic.
Chieffo, M., Heirlmeier, B.R. & Roberts, C. (2018). Retail food store refrigeration and equipment. In Owen, M.S. & Kennedy, H.F. (Eds). ASHRAE Handbook: Refrigeration (15.1- 15.30). Atlanta,USA: Edition: ASHRAE.
Evans, J. (2014). Are doors on fridges the best environmental solutions for the retail sector? London Chamber of Commerce and Industry, London, England.
Faramarzi, R. (1999). Efficient display case refrigeration. Ashrae Journal 41(11), 46–52. Frickie, B. & Becker, B. (2010). Doored display cases. ASHRAE Journal 52(9), 18-26.
GAS Research Institute (2000). Investigation of relative humidity impacts on the performance and energy use of refrigerated display cases. Final Report.
Gaspar, P.D., Gonçalves, L.C.C. & Vogeli, A. (2009). Dependency of air curtain performence on discharge air velocity (grille and back panel) in open refrigerated display cabines. ASME International Mechanical Engineering Congress and Exposition, Lake Buena Vista, Florida, U.S.A.
Gaspar, P.D., Gonçalves, L.C.C. & Pitarma, R.A. (2010). Experimental analysis of the thermal entrainment factor of air curtains in vertical open display cabinets for different ambient air conditions. Applied Thermal Engineering 31(5), 961–969.
Gaspar, P.D., Gonçalves, L.C.C. & Pitarma, R.A. (2011). Análise Experimental da estabilidade de cortinas de ar de equipamentos de refrigeração para diferentes condições do ar ambiente. International Conference on Engineering, Universidade of Beira Interior, Covilhã, Portugal.
Heidinger, G.G., Nascimento, S.M. & Gaspar, P.D. (2013). Impact of environmental conditions on the performance of open multideck display case evaporators. 2nd IIR International Sustainability and the Cold Chain Conference, Paris, France.
Heidinger, G.G., Nascimento, S.M., Gaspar, P.D. & Silva, P.D. (2016). Relevant parameters on the energy efficiency of closed refrigerated multideck display cases. WIT Transactions on Ecology and the Environment 205, 71-81.
ISO 23953 (2015), Refrigerated display cabinets, International Organization for Standardization (ISO). Laguerre, O., Hoang, M.H. & Flick, D. (2012). Heat transfer modelling in a refrigerated display cabinet: the influence of operating conditions. Journal of Food Engineering 108(2), 353-364.
Mousset, S. & Libsig, M. (2011). Energy consumptions of display cabinets in supermarket. 23rd
International Congress of Refrigeration, Prague, Czech Republic.
Nascimento, S.M., Heidinger, G.H., Gaspar, P.D. & Silva, P.D. (2015). Experimental analysis to optimize the performance of air curtains and heat exchangers: application to refrigerated display cases. In Gaspar, P.D. & Silva, P.D. (Eds.), Handbook of research on advances and applications in refrigeration systems and technologies (590-640). Edition IGI Global.
Nascimento, S.M., Heidinger, G.G., Gaspar, P.D. & Silva, P.D. (2016). Numerical quantitative evaluation of the thermal performance of refrigerated display cabinets with variation of air curtain thickness and porosity of the back panel. Purdue International Refrigeration and Air Conditioning Conference, West Lafayette-IN, USA.
Orlandi, M., Visconti, F. & Zampini, S. (2013). CFD assisted design of closed display cabinets. 2nd IIR
International Sustainability and the Cold Chain Conference, Paris, France.
Tassou, S.A. & Datta, D. (1999). Influence of supermarket environmental parameters on the the frosting and defrosting of vertical multideck display cabinets. Ashrae Transactions 105(1), 91-496.