Universidade do Algarve
Faculdade de Ciências e Tecnologia (FCT)
Master in aquaculture and fisheries
Development of the freshwater fish assemblage
in the Mark watershed, the Netherlands
Final thesis report
Name: Maarten Fritz
Phone: +316 53568702
Student number: a51308
Supervisor at Waterboard Brabantse Delta: Marco Beers
Supervisor at Royal Dutch Angling Organisation: Willie van Emmerik
Supervisor at University of Algarve: José Pedro Andrade
Course: Final thesis
Date: April 4, 2016
Development of the freshwater fish assemblage
in the Mark watershed, the Netherlands
Declaração de autoria de trabalho:
Declaro ser o autor deste trabalho, que é original e inédito. Autores e trabalhos consultados
estão devidamente citados no texto e constam na listagem de referências incluída.
Copyright © 2016, por
A Universidade do Algarve tem o direito, perpétuo e sem limites geográficos, de arquivar e
publicar este trabalho através de exemplars empressos reproduzidos em papel ou de forma
digital, ou por qualquer outro meio conhecido ou que venha a ser inventado, de o divulger
através de repositórios científicos e de admitir a sua copia e distribuição com objectivos
educacionais ou de investigação, não comerciais, desde que seja dado crédito ao autor e
editor.
Abstract
Effectiveness of recently applied management strategies on developments of the freshwater fish assemblages in the Mark watershed has been unclear. Therefore, the objective of this study was to identify developments within the freshwater fish assemblages of the Mark watershed. Furthermore, the identified developments in fish assemblages were analyzed for correlations with physical-chemical parameters and implementation of fish passages and habitat restoration in streams as explanatory variables. Fish assemblage data of 498 surveys have been collected between 1994 and 2014, and were analyzed to detect developments in diversity indices over time. Furthermore, 30 routine sampling stations for annual mean of physical-chemical variables, 8 fish passages and 5 remaindering projects were used to explain the differences in diversity indices. Finally, dominant proportions of guilds and fish communities in small streams of the Mark watershed were categorized and studied for correlations to the physical-chemical variables.
Altogether 25 native and 6 exotic fish species were detected in the Mark watershed. Species number and diversity varied significantly between watercourses and year of sampling. The Bavelse Leij, Bijloop-Turfvaart, Chaamse Beken, Kleine Beek, Molenbeek and Merkske showed no significant differences in diversity indices over the period of 1994 till 2014. Small streams of the Galderse Beek and Strijbeekse Beek were characterized by a significant decreasing linear trend in average diversity. Diversity significantly decreased from 1.34 to 0.93 between 1994 and 2005 for the Galderse Beek and 1.56 to 0.82 between 1994 and 2006 for Strijbeekse Beek. Diversity at the Galderse Beek significantly decreased due to an exponential increase in the numbers of nine spined stickleback and stone loach, accounting for 83.5% of the total number of individuals. Decreased diversity for the Strijbeekse Beek was caused by an increase in the number of gudgeon, accounting for 77.1% of the total number of individuals. After 2006, average diversity decreased gradually further, however no significant
differences were obtained anymore. Mark en Vliet was characterized by a significant linear decrease in average species richness and increase in average Pielou’s evenness over the studied period. Diversity at Mark en Vliet was characterized by a significant depression of 1.15 to 0.81 between 2005 and 2008. After 2008, diversity recovered to original values of approximately 1.20. Depression at Mark en Vliet could not be explained and the reason remain unclear. The Aa of Weerijs showed a significant gradual increasing linear trend in average diversity indices. The average species richness gradually increases over the period of 1994 to 2013. Together with an significant improvement of Pielou’s evenness in 2013, diversity significantly increases from 1.32 to 1.67 for the Aa of Weerijs between 2010 and 2013. The Boven Mark showed a fluctuating character in average diversity indices between 1994 and 2013, and a significant linear increase in average species richness was observed. Average species richness increased from respectively 6.06 species in 1994 to 8.08 species in 2013. However, diversity showed no significant differences due to variation in the distribution among species.
Redundancy analysis and Pearson correlation analysis for the Aa of Weerijs and Boven Mark revealed a positive correlation between the construction of fish passages and diversity. However, it is assumed that the overall environmental conditions improved, allowing a greater diversity to exist, and increased connectivity by fish passages functions as a promoter. Habitat restoration projects showed no
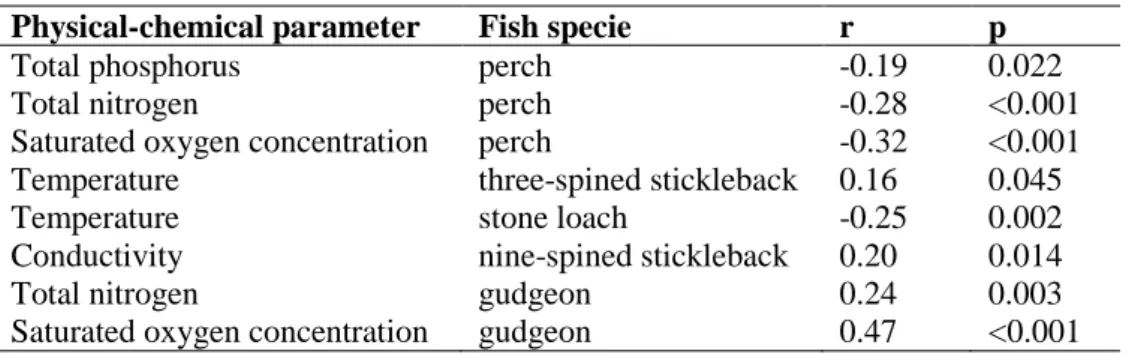
significant connection to the diversity indices. Furthermore, the physical-chemical variables conductivity, total phosphorus, total nitrogen, chloride and saturated oxygen concentration showed significant correlations to the diversity indices, where conductivity, total phosphorus, total nitrogen and chloride have a negative correlation and saturated oxygen concentration a positive correlation. Non-metric dimensional scaling for the Mark watershed revealed differences between the fish communities collected at different watercourses and by used fishing gear. Focus on the small streams of the Mark watershed, showed the distribution of dominant fish communities in the samples. The small streams are relatively well represented by the occurrence of characteristic stream fish species such as, stone loach, gudgeon, three-spined stickleback and nine-spined stickleback. However, undesirable fish communities of perch & roach and pike & rudd exist in the small streams, and indicate the points for future improvements. Pearson correlation analysis of the fish communities showed that the physical- chemical variables temperature, total nitrogen, total phosphorus, saturated oxygen concentration an conductivity have a significant correlation. The number of perch in the small streams negatively correlates to total nitrogen, total phosphorus, and saturated oxygen concentration, while the number of gudgeon positively correlates. Furthermore, the numbers of three-spined
stickleback and stone loach respectively correlate positively and negatively to water temperature of the small streams. Finally, conductivity at the small streams showed a positive correlation to the numbers of nine-spined stickleback.
Resumo
A eficácia de estratégias recentemente recentemente para o desenvolvimento de comunidades de peixes de água doce na bacia hidrográfica de Mark não tem sido clara. Assim, o objetivo deste trabalho foi identificar desenvolvimentos dentro das comunidades de peixes de água doce da bacia hidrográfica de Mark. Ademais, os desenvolvimentos identificados nestas comunidades foram
analisados em correlações com parâmetros físico-químicos e implementação de passagens para peixes e restauração de habitat em cursos de água como variáveis explicativas. Dados de comunidades de peixes de 498 investigações foram recolhidos entre 1994 e 2014, e foram analisados para detectar desenvolvimentos em índices de diversidade ao longo do tempo. Além disso, foram usadas 30 estações de amostragens de rotina para médias anuais de variáveis físico-químicas, 8 passagens para peixes e 5 projectos residuais para explicar diferenças nos índices de diversidade. Por fim, as associações e comunidades dominantes de peixes nos pequenos cursos de água da bacia hidrográfica de Mark foram categorizadas pelo número de peixes e estudadas as correlações para as variáveis físico-químicas. Ao todo, 25 espécies nativas e 6 não-nativas de peixe foram detectadas na bacia hidrográfica de Mark. O número de espécies e a diversidade variaram significativamente entre cursos de água e ano de amostragem. Os cursos de água de Bavelse Leij, BIjloop-Turfvaart, Chaamse Beken, Kleine Beek, Molenbeek e Merkske não mostraram diferenças significativas nos índices de diversidade no período de tempo entre 1994 e 2014. Pequenos ribeiros de Galderse Beek e Strijbeekse Beek caracterizaram-se por uma redução linear significativa na diversidade média. A diversidade baixou significativamente de 1,34 para 0,93 entre 1994 e 2005 em Galdarese Beek e de 1,56 para 0,82 entre 1994 e 2006 em
Strijbeekse Beek. A diversidade em Galderse Beek reduziu significativamente devido ao aumento exponencial em número de esgana-gatas e verdemãs-da-pedra, que corresponderam a 83,5% do número total de indivíduos. A queda da diversidade em Strijbeekse Beek foi causada por um aumento em número de góbios, contando com 77,1% do número total de indivíduos. Depois de 2006, a
diversidade média continuou a diminuir gradualmente, contudo, não se obtiveram diferenças significativas. Mark en Vliet foi caracterizado por uma redução linear significativa em riqueza específica média e um aumento na equitabilidade média de Pielou durante o período estudado. A diversidade em Mark en Vliet foi definida por uma significativa depressão de 1,15 para 0,81 entre 2005 e 2008. De 2008 em diante, a diversidade foi restaurada para os valores originais de 1,20 aproximadamente. A depressão em Mark en Vliet não pôde ser explicada e as suas causas permanecem indefinidas. Em Aa de Weerijs, houve uma tendência linear gradual crescente
significativa nos índices médios de diversidade. A riqueza específica média cresceu gradualmente de 1994 a 2013. Em conjunto com uma melhoria na equitabilidade de Pielou em 2013, a diversidade aumentou significativamente de 1,32 para 1,67 em Aa de Weerijs entre 2010 e 2013. Boven Mark demonstrou flutuações em índices médios de diversidade entre 1994 e 2013, e um crescimento linear
para 8,08 espécies, de 1994 a 2013 respectivamente. No entanto, a diversidade não demonstrou diferenças significativas devido à variação na distribuição entre espécies.
A análise de redundância e a correlação de Pearson para Aa de Weerijs e Boven Mark revelaram uma correlação positiva entre a construção das passagens para peixes e diversidade. Contudo, assumiu-se que as condições ambientais em geral melhoraram, permitindo a existência de uma maior diversidade, e o aumento da conectividade pelas passagens funcionou como um promotor. Projectos de restauração do habitat não mostraram uma ligação significativa com os índices de diversidade. Mais, as variáveis químicas de condutividade, fósforo total, azoto total, concentração de cloro e oxigénio saturado demonstraram correlações significativas para com os índices de diversidade, onde a condutividade, fósforo total, azoto total, e cloro tiveram uma correlação negativa, e a concentração de oxigénio saturado uma correlação positiva.
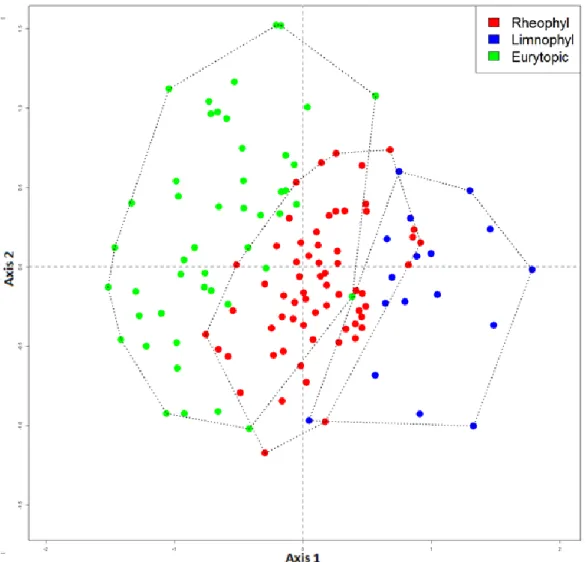
A escalagem dimensional não-métrica para a bacia hidrográfica de Mark revelou diferenças entre as comunidades de peixes amostrados em diferentes cursos de água e com diferentes materiais de pesca. A focagem nos pequenos cursos de água da bacia de Mark mostrou a distribuição das comunidades de peixes dominantes nas amostras. Estes pequenos ribeiros são relativamente bem representados pela ocorrência de espécies de peixes características, tais como verdemãs-da-pedra, góbios, e esgana-gatas. Contudo, comunidades indesejáveis de percas e pardelhas, e lúcios e escardinios existem nestes pequenos cursos de água, e indicam os pontos para melhoramentos futuros. A correlação de Pearson nas comunidades piscícolas demonstrou que as variáveis químicas, temperatura, azoto total, fósforo total, concentração de oxigénio saturado e condutividade se correlacionam significativamente. O número de percas nos pequenos cursos de água correlaciona-se negativamente com o azoto total, fósforo total e concentração de oxigénio saturado, enquanto que o número de góbios correlaciona-se positivamente. Mais, os números de esgana-gatas e verdemãs-da-pedra correlacionam-se positiva e negativamente, respectivamente, com a temperatura da água nos pequenos rios. Por fim, a
condutividade nos pequenos cursos de água demonstrou uma correlação positiva com o número de esgana-gatas.
Samenvatting
De effectiviteit van het huidige toegepaste beleid op de ontwikkelingen in de visstand van het Mark stroomgebied is nog steeds niet geheel duidelijk. De doelstelling van het onderzoek was om de meest belangrijke ontwikkelingen in de visstand van het Mark stroomgebied te analyseren. De waargenomen verschillen zijn getest middels een correlatie analyse, voor het aantonen van verbanden met fysische-chemische variabelen, de aanleg van vispassages en herinrichting van de waterlopen in het gebied. In totaal zijn er 498 bemonsteringen van de visstand uitgevoerd in het Mark Stroomgebied tussen 1994 en 2014. Gegevens van de visstand bemonsteringen zijn gebruikt voor het waarnemen van
ontwikkelingen in diversiteit indexen. De verklarende variabelen voor de analyses bestonden uit 30 routinematige, fysisch-chemische meetpunten voor het berekenen van jaargemiddelden, acht vispassages en vijf beekherstel projecten. Tot slot is er dieper ingegaan op de visstand van de kleine beken van het Markstroomgebied. Dominante gilden en visgemeenschappen zijn aangeduid en geanalyseerd voor verbanden met jaargemiddelden van de fysisch-chemische variabelen.
In totaal zijn er 25 inheemse en 6 exotische vissoorten aangetroffen in het Markstroomgebied tussen 1994 en 2014. Het aantal aangetroffen vissoorten en de diversiteit verschilde significant tussen waterlichamen onderling en de jaren van bemonstering. De Bavelse Leij, Bijloop-Turfvaart, Chaamse Beken, Kleine Beek, Molenbeek en het Merkske vertoonde geen significante verschillen in diversiteit tussen 1994 en 2014. De Galderse Beek en Strijbeekse Beek vertoonde een significante daling in gemiddelde diversiteit tussen 1994 en 2015. De gemiddelde diversiteit van de Galderse beek daalde significant van 1.34 tot 0.93 tussen 1994 en 2005 door een sterke toename in het aantal tiendoornige stekelbaars en bermpje, dat 83.5% bedroeg van het totaal aantal gevangen vissen in 2005. De gemiddelde diversiteit van de Strijbeekse Beek daalde significant van 1.56 tot 0.82 tussen 1994 en 2006 door een toename in het aantal riviergrondels dat 77.1% bedroeg van het totaal aantal gevangen vissen in 2006. Na 2006 daalde de gemiddelde diversiteit geleidelijk verder, maar er werden geen significante verschillen meer waargenomen. Het Mark en Vliet vertoonden een significante lineaire daling in gemiddelde soortenrijkdom en significante lineaire stijging in gemiddelde Pielou’s evenness tussen 1994 en 2014. De diversiteit van het Mark en Vliet toonde een significante depressie van 1.15 tot 0.81 tussen 2005 en 2008. De depressie op het Mark en Vliet in 2008 kon niet verklaard worden tijdens deze studie, maar in 2011was de gemiddelde diversiteit weer hersteld tot het originele niveau. De Aa of Weerijs wordt gekenmerkt door een geleidelijke toenemende trend in de diversiteit indexen tussen 1994 en 2013. De gemiddelde diversiteit steeg significant tussen 2010 en 2013. De significante stijging in diversiteit werd veroorzaakt door een geleidelijke stijging in gemiddelde soortenrijkdom en significante toename in Pielou’s evenness in 2013. De diversiteit indexen van de Boven Mark zijn gekenmerkt door een fluctuerend karakter. De gemiddelde soortenrijkdom vertoont een significante lineaire toename van 6.06 soorten in 1994 tot 8.08 soorten in 2013. De gemiddelde diversiteit index
De redundantieanalyse en Pearson correlatie analyse voor de Aa of Weerijs en Boven Mark toonde een positieve correlatie tussen de aangelegde vispassages en diversiteit. Er wordt echter aangenomen dat een toenemende connectiviteit door de aanleg van vispassages een bijdrage heeft geleverd aan een toenemende diversiteit, maar dat de diversiteit ook is toegenomen door een verbetering in de algemene milieuomstandigheden. Er kon geen significant verband aangetoond worden tussen
beekherstelprojecten en de diversiteit indexen. Ook de fysisch-chemische variabelen geleidbaarheid, totaal fosfor, totaal stikstof, chloride en verzadigd zuurstofgehalte vertoonden significante correlaties met de diversiteit indexen. Hierbij toonden de fysische-chemische variabelen geleidbaarheid, totaal fosfor, totaal stikstof en chloride een negatieve correlatie met de diversiteit indexen en had verzadigd zuurstofgehalte een positieve correlatie.
Multidimensionale scaling van de bemonsteringen in het Mark stroomgebied toonde een verschil in de visgemeenschappen, afhankelijk van de verschillende wateren en het type vangtuig. De kleine beken in het Mark stroomgebied vertoonden de aanwezigheid van dominante visgemeenschappen in de bemonsteringen. De kleine beken zijn relatief goed vertegenwoordigd door het voorkomen van kenmerkende vissoorten zoals bermpje, riviergrondel, driedoornige stekelbaars en tiendoornige stekelbaars. Desondanks zijn er ook ongewenste visgemeenschappen van baars & blankvoorn en snoek & ruisvoorn aanwezig in de kleine beken, die een indicatie geven voor locaties die in de toekomst verbeterd kunnen worden. De Pearson correlatie analyse toonde significante correlaties tussen vissoorten en de fysisch-chemische variabelen temperatuur, totaal stikstof, totaal fosfor, verzadigd zuurstofgehalte en geleidbaarheid. De aantallen baars en riviergrondel in de kleine beken toonde respectievelijk een negatieve en positieve correlatie met de variabelen totaal stikstof, totaal fosfor en verzadigd zuurstofgehalte. Verder is er een positief verband aangetoond tussen temperatuur en het aantal driedoornige stekelbaarzen en een negatief verband tussen het aantal bermpjes en temperatuur. Tot slot is er voor de kleine beken een positief verband aangetoond tussen het aantal tiendoornige stekelbaarzen en de geleidbaarheid.
Table of content
1. Introduction ... 1
1.1 Environmental impact and management ... 2
1.2 Freshwater fish assemblages as monitoring tool ... 2
1.3 Fish assemblages of the Mark watershed ... 4
2. Material and methods ... 8
2.1 Study area ... 8
2.2 Data collection ... 10
2.3 Dataset construction ... 12
2.4 Data analysis... 16
3. Results and discussion ... 19
3.1 Diversity indices ... 19 3.1.1 Galderse Beek ... 19 3.1.2 Strijbeekse Beek ... 22 3.1.3 Aa of Weerijs ... 25 3.1.4 Boven Mark ... 28 3.1.5 Mark en Vliet ... 31
3.2 Correlation of diversity indices and environmental variables ... 34
3.3 NMDS of the freshwater fish assemblages ... 40
4. Conclusion ... 47
5. Recommendations ... 48
References ... 51
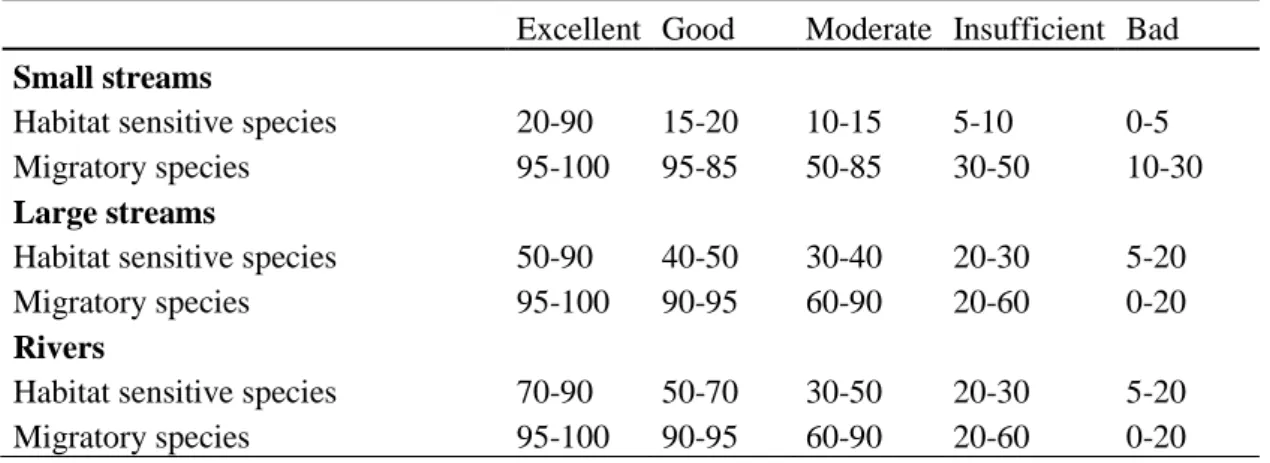
Appendix 1 WFD evaluation metrics for abundances ... 56
Appendix 2 Map of the Mark watershed ... 57
Appendix 3 General sampling information ... 58
Appendix 4 Maps with sampled trajectories of the small streams in the Mark watershed... 60
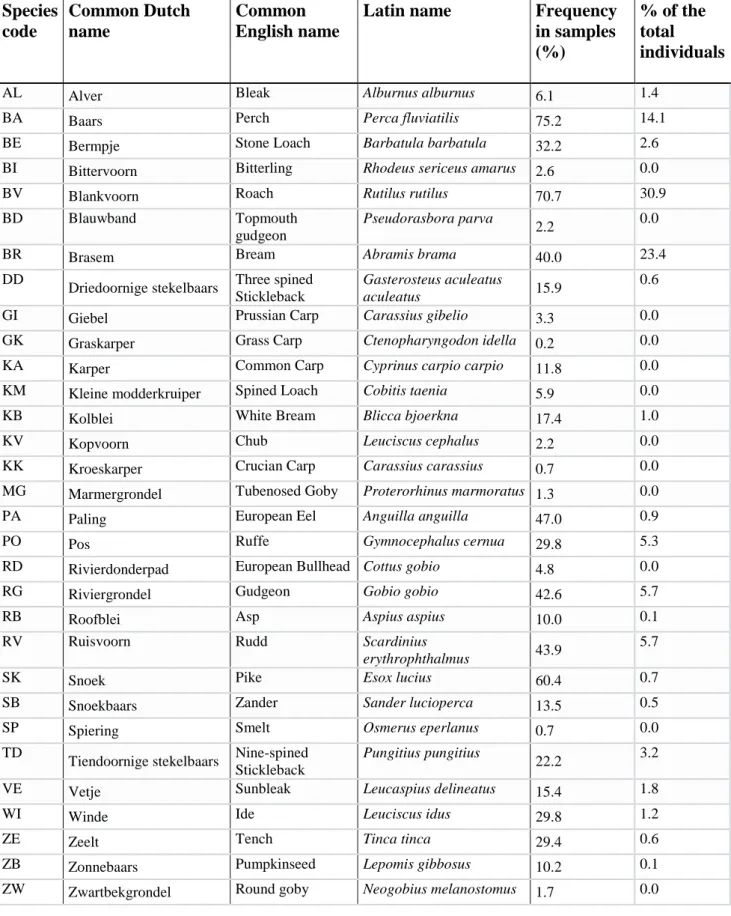
Appendix 5 General information of fish species ... 64
Appendix 6 Diversity indices of all waterbodies over time ... 65
Appendix 7 Overview of the total number of fish per sampling event ... 68
Appendix 8 Trends in physical-chemical variables of all waterbodies ... 75
Appendix 9 Diversity indices for subareas of Mark en Vliet ... 87
Appendix 10 Results of simper analysis for gears ... 88
Appendix 11 Performed NMDS for Mark en Vliet ... 94
Appendix 12 NMDS for the Aa of Weerijs, Boven Mark en Molenbeek ... 100
1. Introduction
During the last centuries, environmental systems worldwide have been influenced by human
developments and activities. Recently, an increased awareness of the environmental degradation has been considered, and increased management effort has been applied to maintain and improve the environmental quality and quantity of systems. Additionally, The Water Framework Directive (WFD) was implemented in 2000, aiming at the protection and improvement of water quality throughout Europe to increase sustainable usage of environmental resources. According to the WFD, fish fauna is accounted as one of the biological quality elements for assessing the ecological status of waters. During the last 20 years, more ecosystem based water management was applied by Regional Water Authority Brabantse Delta. Fish migration routes were established, rivers and streams were
remaindered, and the overall water quality improved. Changes in spatial planning (e.g. remaindering, fish passages) and improved physical-chemical quality (e.g. total phosphorus, total nitrogen) are assumed to have a positive effect on the aquatic system, however, adaptation of flora and fauna to new situations could considerably take longer periods. This recently applied water management approach is expected to have improved the overall environmental quality and thus have a positively effect on developments of the freshwater fish assemblages.
For the Mark watershed, the Regional Water Authority Brabantse Delta and Royal Dutch Angling Organization have collected a large amount of fisheries data between the period of 1994 and 2014. The Regional Water Authority also recorded general water management information from the Mark
watershed, such as physical-chemical variables and implemented measures. In the current state, understanding of developments in freshwater fish assemblages of the Mark watershed is unclear. Knowledge regarding the developments of the freshwater fish assemblages could be used as a proper tool to explain the effect and efficiency of executed measures and changes in biotic and abiotic conditions. Furthermore, the Regional Water Authority could use this information to improve their water management strategies.
Therefore, this study is focusing on developments of the freshwater fish assemblages in the Mark watershed between 1994 and 2014. Goal of this study was to identify the most important
developments in diversity indices of the fish assemblages. Furthermore, the correlation between observed developments in diversity indices and physical-chemical variables, fish passages and habitat restoration activities was explored. Additionally, the fish assemblages of the small streams were studied to assess fish communities, and indicate the most important promoting physical-chemical variables for the small streams of the Mark watershed.
1.1 Environmental impact and management
Freshwater systems worldwide have been influenced by human developments and activities. Anthropogenic influences, such as, intensive agriculture and rapid urbanization have significantly affected the environmental quality and biotic composition of aquatic systems in almost all regions of the world (Lenat and Crawford, 1994). Expansion of the human population and accessory urban landscape alteration has shown significant effects on the quality and quantity of water and thus aquatic biota (Brown et al., 2005; Limburg and Schmidt, 1990; Helms et al., 2005). Currently, degradation of aquatic systems due to anthropogenic influences is associated with habitat degradation, environmental pollution, exploitation of species, and degradation of the capacity to support biodiversity (Herlihy et al., 1998; Paul and Meyer, 2001; Helms et al., 2005; Revenga et al., 2000).
The WFD was implemented in 2000, forming a key initiative aimed at protecting and improving water quality throughout Europe (European Union, 2000). The directive states that water should be protected as a heritage. Goal of the WFD is to guarantee sustainable water usage and achieve a good ecological and chemical status of all inland surface waters, transitional waters, coastal waters and groundwater. In order to achieve the formulated goals of a good ecological and chemical status of waterbodies, each member state of the European Union is responsible for management and monitoring of the waters on their territory (European Union, 2010). For the Netherlands, the national and regional water authorities are responsible for implementing the WFD goals, including the classification of water types, endeavor the formulated goals, frequent monitoring of waterbodies, and identification of the chemical and ecological status. According to the WFD, fish fauna is accounted as one of the biological quality elements for assessing the ecological status of waters.
1.2 Freshwater fish assemblages as monitoring tool
Watershed conditions are reflected by biological communities since they are sensitive for changes in a wide range of environmental factors. Fish in general, are influenced by various environmental
conditions and characteristics of their habitat (Karr, 1981). In addition, seasonal shifts in temperature, rainfall and river flow have showed a direct effect on fish life cycle (Grossman et al., 1998; Allan, 2004). Fish are particularly useful for assessing long-term environmental impacts because they integrate multiple trophic levels in aquatic communities, are relatively long-lived and easily sampled and determined to species level (Karr, 1987; Barbour et al., 1999). Fish assemblages of a system may degrade by various factors, such as, changes in food availability, nutrient delivery, hydrological conditions, habitat, sediment, pesticides, and metal or organic contaminants (Helms et al., 2005; Lenat and Crawford, 1994; Wang et al., 2003; Paul and Meyer, 2001). Therefore, increased environmental stress of river basins is often associated with decreased overall fish richness, abundance and diversity, and may result in assemblages shifts from intolerant to tolerant and /or exotic species (Klein, 1979;
Many stream fish ecology studies have been performed to examine the fish assemblage structure in response to their environment (Matthews, 1998). Studies regarding the fish assemblage structure differ from a single stream and its tributaries (Humpl and Pivnicka 2006; Taylor et al., 2006) to several large hydrographical units (Rathert et al., 1999; Oberdorff et al., 2001; Pont et al., 2006; Lamouroux and Cattanéo 2006; Súarez et al., 2011). Most papers conclude that fish species distributions and occurrence in stream communities is related to numerous local conditions, of which many are correlated with each other (Angermeier and Winston, 1998). Environmental factors that could influence the fish assemblage structure are associated with hydraulic (Marchetti and Moyle, 2001; Lamouroux and Cattanéo, 2006), physical (Humpl and Pivnicka, 2006) and chemical conditions (Matthews et al., 1992; Lappaleinen and Soininen, 2006; Herpen et al., 2015). It is assumed that freshwater fish assemblages are influenced by a combination of environmental factor acting at
different scales (Matthews, 1998; Ferreira et al., 2007). In general, spatially complex habitats typically support more species than simple homogeneous habitats, predation may often restrain the distribution of species (Taylor, 1996; Power et al., 1985; Gilliam et al., 1993).
A freshwater fish assemblage is also influenced by the geographical and hydro morphological structure of the watershed. Most watersheds offer a large variability of environmental conditions, favoring different fish species along a longitudinal upstream-downstream gradient (Matthews, 1998). In theory, fish species can migrate throughout the watershed, however, in reality fish occur at the most suitable environment that is accessible for their biological needs. When focused on the entire
watershed, the fluvial ecosystems are primary altered by water construction, like dams, weirs and channelization (Mueller et al., 2011). These constructions modify the natural dynamic of water, nutrients, and sediment, disconnect river segments and floodplains, and change the overall physical, chemical and biological structure and function of river systems (Wang et al., 2011). Several studies concluded that fish assemblage structure and richness is affected by spatial position of the tributaries within the watershed (Grenouillet et al., 2004). In addition, length of the tributary and a combination of complex habitat types, especially bottom vegetation, have shown to be the most important condition for high diversity of fish species in the tributaries (NCN, 2009).
Knowledge regarding the distribution and developments of a freshwater fish assemblage in response to their environment is especially useful for management purposes. Recently applied management is aiming to improve the chemical and ecological quality of the watershed (European Union, 2000). Improvement of the chemical and ecological quality should be reflected by all the biological
communities, and thus the fish assemblages (Karr, 1981). Therefore, studying the fish assemblage of the Mark watershed in response to environmental conditions could provide relevant information to evaluate the relative effect of recently applied management.
1.3 Fish assemblages of the Mark watershed
In 1994, the Mark watershed was monitored and references were established for the fish assemblages (Quak et al., 1996). Since implementation of the WFD, references for the freshwater fish assemblages of streams were slightly adapted (Vriese and Beers, 2004) and criteria for the evaluation method of fish assemblages were formed (STOWA, 2015).
Establishment of a reference situation
In 1994, the Mark watershed was firstly monitored to gather general information of the fish
communities in the area and to indicate bottlenecks and opportunities for future (Quak et al., 1996). As a result, the first reference situation of fish assemblages was described for the Mark watershed.
Mark en Vliet is characterized by large dimensions and monotone structures, being mostly used for shipping transport. In the reference situation, fish assemblage of Mark en Vliet is expected to be dominated by the species roach, bleak and bream. Furthermore, the species ide, white bream, ruffe and smelt are present throug the whole watercourse. Subpopulations of roach, bleak and ide travel during the spawning period to upstream parts (Boven Mark and Aa of Weerijs) of the watershed. Pike, zander and perch exists as piscivorous species, and dominance of species is mostly regulated by transparency and availability of vegetation. Rudd, tench, bitterling, spined loach and crucian carp are less abundant in Mark en Vliet, but do occur frequently at habitats with the availability of vegetation.
Fish assemblages of the Aa of Weerijs and Boven Mark show comparable compositions, with largest difference that the Aa of Weerijs is connected to artificial streams and the Boven Mark to natural streams. Both streams are characterized by variable communities due to a gradient of environmental conditions. The species rudd, tench, crucian carp and bitterling are generally common and occur mostly at vegetated parts of the watercourse. Most abundant species in the Aa of Weerijs and Boven Mark are roach and perch, who can complete their entire life cycle in the streams. Also sunbleak, white bream, bleak and Ide are generally abundant and migrate to upstream parts during spawning period. Pike is the most important piscivorous specie in the Aa of Weerijs and Boven Mark due to the small sized perch populations. Furthermore, the species dace, burbot and chub occurred at the streams, but in relatively low numbers and at specific habitats. Gudgeon, stone loach and spined loach are abundant in lower frequencies and prefer shallow habitats with leaves, brunches and obstacles. However, stone loach, spined loach and dace are not as abundant in the Aa of Weerijs as in the Boven Mark.
The small streams of the Mark watershed have different characteristics and are most comparable by dimensions of the watercourses. Fish fry is often observed at downstream parts of the watercourses where they enter the Aa of Weerijs of Boven Mark. The small watercourses are characterized by the dominance of stone loach, gudgeon, nine-spined stickleback and three-spined stickleback, where sticklebacks are more abundant in the upstream parts. Habitats with gravel and rocks could be
inhabited by small populations of European bullhead and brook lamprey. Small populations of burbod occur at the deeper parts of the small streams, close to the available inundated areas. Spined loach could occur at the most vegetated parts of the watercourses. Furthermore, pike, roach and perch find spawning habitats at the entrance of the small watercourses. Small populations of chub, dace and Ide occasionally use the small streams during summer periods. European eel occurs throughout the whole Mark watershed, however, abundances are relatively low.
Current reference situation
Since 1996, several adaptations were reported for the reference situation of fish assemblages in the Mark watershed (Vriese and Beers, 2004). The currently used reference situation of the fish assemblages in water types of the Mark watershed are shown in table 1.
Fish fauna of the small streams are restricted, with three-spined stickleback as most common species. Furthermore, populations of nine-spined stickleback exist and stone loach and gudgeon are locally present. Brook lamprey could occur in this type of small streams, depend on local conditions (type of substrate and availability of detritus). During spring it is possible that that minnow reaches the upstream parts of the small streams.
Fish assemblages of the large streams are characterized by the occurrence of small rheophilic species such as, stone loach, dace, gudgeon, European bullhead, while also eurytopic species exist due to limited velocities in the streams. Phytophilic fish species, such as, pike, sunbleak, spined loach and nine-spined stickleback occur locally at habitats with less current.
Fish assemblages of rivers are characterized by the occurrence of rheophylic species such as, ide, chub, stone loach, dace, gudgeon and European bullhead. Due to limited stream velocities, also eurytopic species as pike, perch and roach are abundant. Sunbleak, stone loach, nine-spined
stickleback and pike exist at habitats with the absence of current, such as, part of the shores and side rivers. River lamprey could occur at habitats with enough substrate in the form of gravel and rock.
Table 1. Overview of the characterizing fish species for watercourses of the Mark watershed in accordance to the adapted reference situation for WFD water types (Vriese and Beers, 2004).
Fish species Small streams Large streams Rivers
Bleak R Perch R R Brook lamprey RB RB RB Stone loach R R R Roach R R Bream V V Three-spined stickleback R R R Mirrow RB Spined loach R R Chub RB R European eel R R European bullhead RB RB RB Gudgeon R R R River lamprey RB Dace R R pike R R Nine-spined stickleback R R Sunbleak R R Ide R
R Species always occurs in the reference situation.
RB Species could occur in the reference situation, depend of regional differences, presence/absence of suitable substrate or only in a specific stage of the lifecycle.
V Species often occurs in the reference situation.
WFD evaluation
The criteria for the evaluation method of fish assemblages is reported in STOWA, 2015.The current evaluation criteria for streams and rivers is based on three metrics: fish species composition,
abundance of migration sensitive fish species and abundance of habitat sensitive fish species.
Combination of the three evaluation metrics, results in the overall score and is a number between zero and one. Species composition is based on the proportion of rheophylic fish species in terms of total species richness. Abundance of migration and habitat sensitive fish species is based on the proportion of habitat sensitive fish and migratory sensitive fish from the total number of individuals. All
watercourses of the Mark watershed are evaluated by the same metrics of fish abundances, however, different targets are stated for the three types of water (appendix 1).
Historical assessment
Surveys from 1994 revealed that the freshwater fish community structure of larger streams and rivers of the Mark watershed were dominated by eurytopic fish species, and less rheophilic and limnophilic species were observed (Quak et al., 1996). Notably, the freshwater fish assemblage was mainly dominated by the year class 0+ of bream, roach and perch. Despite the good condition of fish with younger year classes, older fish (year class 2+) showed to have a deteriorated condition, probably caused by the competition for food with the large amount of young fish. Number of piscivorous fish were minimum during the surveys in 1994 and dominated by perch, only few pike and zander were observed. The small amount of large piscivorous fish was assumed to fail in effective predation to reduce the numbers of younger year classes.
The smaller upstream parts of the Mark watershed are mainly characterized by the occurrence of rheophilic species which represent around fifty percent of the catch during the surveys in 1994. Eurytopic fish species were secondly most dominant in the catch, and limnophilic fish species were caught non-frequently and in small numbers. The rheophilic guild were mainly characterized by the species gudgeon and stone loach, while more intolerant species only were observed occasionally.
Recent Assessment
The Aa of Weerijs, Boven Mark and small streams of the Mark watershed are most recently monitored in 2010 and 2013 (Koole, 2013). Fish surveys revealed that the small streams are increasingly
dominated by rheophylic fish species, accounting for approximately 60% of the total fish assemblages. However, the small streams differ greatly among each other in terms of fish assemblage. Stone Loach was indicated as most contributing rheophylic fish species, but in some streams gudgeon was more abundant. Fish assemblages at five of the small steams of the Mark watershed show an increase in total numbers to fish between 2010 and 2013. The Aa of Weerijs (21%) and Boven Mark (4%) are characterized by remarkably lower proportion of rheophylic fish species. Fish assemblages at the Aa of Weerijs and Boven Mark show a strong decrease in total numbers between 2010 and 2013, and could be caused by a cold Spring in 2013 that resulted in unsuccessful reproduction. However, no obvious developments or shifts were observed for the distribution of guilds during recent periods. In this study, a longer period of fish surveys were included to obtain developments of the fish
2. Material and methods
The materials and methods used in this study includes a description of the study area (chapter 3.1), data collection (chapter 3.2), data construction (chapter 3.3) and data analysis (chapter 3.4).
2.1 Study area
The Mark watershed is a transboundary system located in the Netherlands and Belgium. More
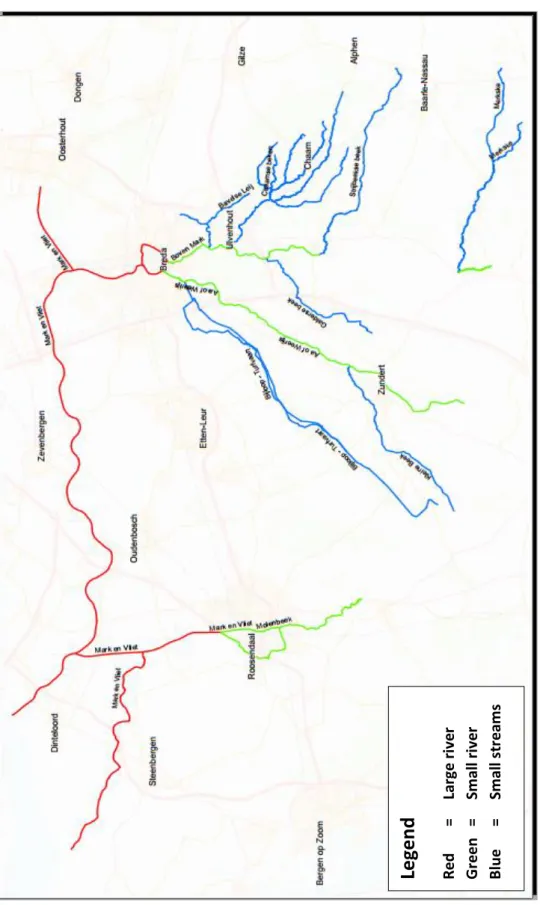
specific, the Mark watershed is situated between Antwerp and Breda, with a total surface of 74.500 ha, of which 56% is located in Belgium (Brevé, 2007). The origin of several small streams is situated in the north of Belgium and south of Breda. The small streams enter the main drainage system of the Boven Mark and Aa of Weerijs and flow further north to Breda. The Aa of Weerrijs and Boven Mark combine in the channels of Breda, and continue further north as the Mark. This small river becomes the Dintel and eventually flows into the Volkerak. The origin of the Molenbeek is also located in Belgium. Specifically, the origin of the Molenbeek is located between Kalmhout and Achterhoek, from where it flows to the Netherlands and enters into the Vliet. The study area includes all
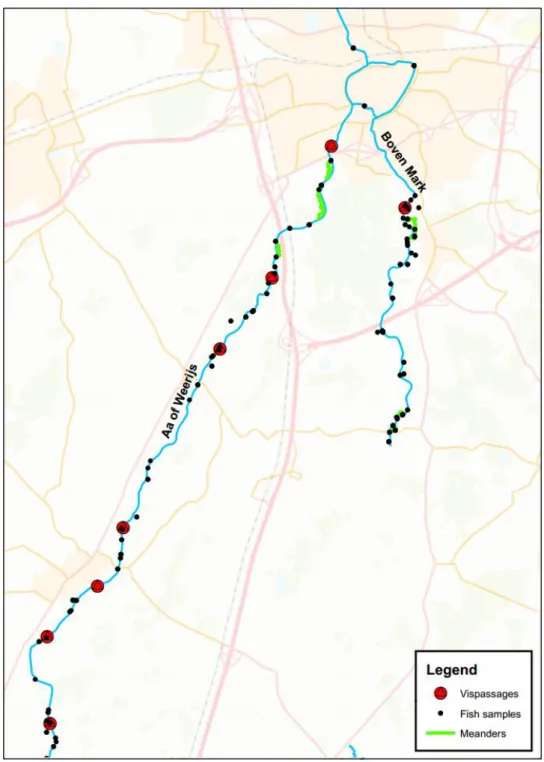
waterbodies directly connected to the Mark watershed which are located within the management area of the Regional Water Authority Brabantse Delta (figure 1; appendix 2). Abbreviations that were used for the individual waterbodies are shown in table 2.
The waterbodies included for this study are typical lowland streams, meaning that precipitation in winter forms most of the water supply. During the 1960s and 1970s, the streams were normalized, straightened and dredged for fast drainage of rainwater and easier shipping transport at the larger waterbodies. Stream normalization decreased the natural sponge effect of wetlands in upstream parts of the basin. Weirs and other constructions were built to have a manageable control for the availability of water during dry periods. These manipulations by water management has changed the natural river characteristics and dynamics, resulting in a disequilibrium of geomorphological processes. In addition, the water quality was influenced by anthropogenic influences (e.g. agricultural activities) for centuries and the availability of complex habitat types degraded within the basin.
During the last decades, increasing management efforts was applied to achieve a good chemical and ecological status of the Mark watershed. Several projects were performed to restore the natural characteristics and dynamics. Weirs and dams were replaced or adapted to achieve sustainable fish migration by the construction of fish passages and parts of the rivers/streams were remaindered or bottom elevated for habitat restoration. Furthermore, wastewater treatment plants were improved and activities in the area were more strictly accounted for discharge of wastewater to improve the chemical status of the Mark watershed. All these activities are assumed to have a positive effect on the aquatic system, however, adaptation of ecosystems to new situations could considerably take long periods.
Figure 1. Overview of the study area. Picture on top presents the Netherlands and the management area of the Regional Water Authority Brabantse Delta. Picture below shows all waterbodies directly connected to the Mark Watershed. The black dots represent the samples that were included for this study.
Table 2. Overview of the waterbodies included for this study and the used abbreviations during the performed analyses.
Name of watercourses Abbreviation
Aa of Weerijs AW Bavelse Leij BA Boven Mark BM Bijloop-Turfvaart BT Chaamse Beken CH Galderse Beek GA Kleine Beek KL Mark en Vliet MV Merkske ME Molenbeek MO Strijbeekse Beek ST
2.2 Data collection
For this project, data of fish surveys, physical-chemical variables and implemented measures were collected. Fish data were provided by the Regional Water Authority Brabantse Delta and the Royal Dutch Angling Organization. Survey data of the freshwater fish assemblages were collected between 1994 and 2014. Data of the physical-chemical parameters and executive measures were provided by the Regional Water Authority Brabantse Delta. Additionally, it was also attempted to include hydro morphological data for the analysis. However, by lack of time during the project, these data were not included for the analysis.
Fish assemblage data
The study area represents a relative gradient in environmental characteristics, requiring different methods and techniques for fish sampling. Dependent on size, structure and accessibility of the sampling location, different methods of sampling were applied, such as, electro fishery with waders, electro fishery from a boat, purse seines fisheries, and bottom trawler fisheries. Between 1994 and 2014, a total of 498 samples were collected. During the fish surveys, all individuals were determined to species level and registered as number of fish per length (rounded as cm). in 1994, the first fish survey in the river basin was performed by the Organization for the Improvement of Inland Fisheries (OVB), the predecessor of the Royal Dutch Angling Organization. Aim of this survey was to gather general information of the freshwater fish assemblages in the area and to indicate bottlenecks and opportunities for future developments of the fish communities. The sampling event of 1994 was most intensive, were 8 waterbodies of the river basin were sampled by 108 individual trajectories of approximately 300 meters. Results of the sampling event in 1994 were only available on paper and
Since implementation of the WFD in the year 2000, the fish assemblages were sampled using
standardized fishing procedures. Since 2000, the data was collected by consultancy firms hired by the Regional Water Authority Brabantse Delta. Sampling events occurred on a more or less regular basis between 2000 and 2014, with approximately time intervals of three years. However, the year of sampling differ between the individual waterbodies. Conform handboek hydrobiology (2010), it is assumed that the distribution of fish is more homogeneous in summer. For this reason, fish surveys have to be performed in the period of mid-July and mid-September. Nevertheless, the periods in which the fish data was collected covers a wider range (appendix 3). In the standardized fishing procedures of handboek hydrobiology (2010), trajectories of 250 meters are sampled, with an intensity where at least 7.5% of the total surface of the total waterbody is sampled. Trajectories at the small streams of the Mark watershed were processed in ArcGIS to visualize the performed samplings (appendix 4).
Chemical/physical data
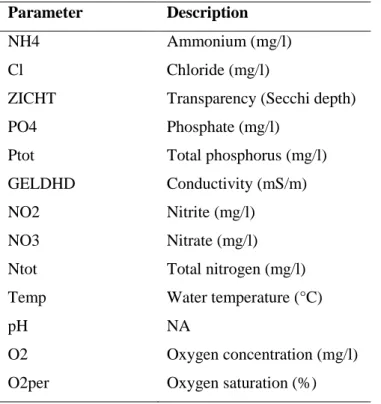
The chemical/physical data for this study was provided by the Regional Water Authority Brabantse Delta. Chemical/physical data was obtained from routine sampling stations for the period of 1994 to 2014. For each waterbody, at least two routine sampling stations (one upstream and one downstream) were selected for collection of physical-chemical variables. A total of 13 physical-chemical parameters (table 3) were obtained from respectively 30 sampling stations. The chemical/physical variables were selected conform quantitative availability of the data and expected contribution to the ecological quality of the river basin system.
Table 3. Overview of the chemical/physical parameters which were collected.
Parameter Description
NH4 Ammonium (mg/l)
Cl Chloride (mg/l)
ZICHT Transparency (Secchi depth)
PO4 Phosphate (mg/l)
Ptot Total phosphorus (mg/l)
GELDHD Conductivity (mS/m)
NO2 Nitrite (mg/l)
NO3 Nitrate (mg/l)
Ntot Total nitrogen (mg/l)
Temp Water temperature (°C)
pH NA
O2 Oxygen concentration (mg/l)
Implemented measures
Data regarding implemented measures was provided by the Regional Water Authority Brabantse Delta. The analysis focused on the construction of fish passages and remaindering projects within the watershed. The year of construction of fish passages and remaindering project were obtained from ArcGIS and registered by a binary notation.
2.3 Dataset construction
One dataset was constructed for the fish data (dependent variables) to perform the analysis. Another dataset was constructed for the chemical/physical parameters and executive measures (independent variables) to perform the explanatory analysis in relation to the fisheries data.
Fish assemblage dataset
During the first phase of the analysis the data was extracted from the Piscaria software and prepared for analysis. The output from Piscaria is registered as the number of individuals per species per length (rounded as cm). Biomass could be extrapolated from historical data and number of individuals per fish species per length. However, due to lack of time and no clear differences in the results of the first analysis, this report only focuses on the numbers of fish. The Piscaria output was processed as the total number of individuals per species for each sample and with a division into length categories (table 4). The division of length categories for most fish species is based on feeding behavior, assuming that small fish is primarily planktivorous and larger fish become benthivorous or piscivorous. However, the length categories for pike differ from the others and is more based on habitat preference, where small pike prefers the shelter of vegetation and larger pike prefers to live in the open water. A 0+ length category for one summer old fish was not considered in the analysis due to variability in growth rate of species in different streams streams.
Table 4. Division of the length categories for fish species applied in this study (Handboek
hydrobiologie, 2010). During the analysis, the abbreviations were used to refer to the different length categories.
General length category Length category for pike (Exos lucius) Abbreviation
0 - 15 cm 0 - 15 cm LK1
16 - 25 cm 16 - 35 cm LK2
26 - 40 cm 35 - 45 cm LK3
>40 cm 45 - 55 cm LK4
Furthermore, the dataset was cleaned up by removing the outliers and sample events with non-representative sample size, period or collected number of individuals. A total of 498 samples were registered before the clean-up of the dataset (appendix 3). Samples with a total number of individuals less than 10 were assumed to be non-presentative and were removed from the dataset, resulting in 460 samples remaining. Finally, the sampling events with sample size lower than three samples, and sampling period between January and June were removed. In total, 6 more samples were removed from the dataset, remaining a total of 454 samples for the analysis. An overview of the sampling intensity and frequency of the remaining samples is shown in table 5.
Finally, the data was transformed before the analysis to improve normality. The raw data used for the analysis of fish communities was transformed by a square root transformation. For the diversity indices analysis, the data was mostly transformed to improve uniformity. Because the sampled area was not registered for the data of 1994 and it was not possible to calculate the area, it was impossible to apply the fished surface method (bevist-oppervlak method (BOM)) that is commonly used in the Netherlands (Handboek hydrobiologie, 2010). Therefore, the data was transformed to the proportions of each species in contrast to the total number of individuals (1).
𝑝𝑟𝑜𝑝𝑜𝑟𝑖𝑜𝑛 𝑜𝑓 𝑎 𝑠𝑝𝑒𝑐𝑖𝑒𝑠 = 𝑁𝑢𝑚𝑏𝑒𝑟𝑠 𝑜𝑓 1 𝑠𝑝𝑒𝑐𝑖𝑒
𝑇𝑜𝑡𝑎𝑙 𝑛𝑢𝑚𝑏𝑒𝑟𝑠 𝑜𝑓 𝑖𝑛𝑑𝑖𝑣𝑖𝑑𝑢𝑎𝑙𝑠∗ 100 (1) Table 5. Sampling intensity and frequency for the remaining samples after clean-up for the different waterbodies over the years.
1994 2003 2004 2005 2006 2007 2008 2009 2010 2011 2013 2014 AW 25 - 11 - - 12 - - 14 - 13 - BA 4 - - - 4 - 2 - BM 18 - 8 - - 6 - - 14 - 12 - BT - - - 7 - - 11 - 11 - CH 12 - - - 8 6 - - 8 - 11 - GA 5 - - 5 - - - - 1 - 4 - KL - - - 7 - - 7 - ME 3 - - - 6 - - - 6 - 8 - MO - 5 - - - - 9 - - 6 - 7 MV 26 - - 18 - - 16 - - 44 - 41 ST 2 - - - 3 - - - 4 - 4 -
Dataset of physical-chemical variables and implemented measures
The physical-chemical variables were extracted from the database of the Regional Water Authority Brabantse Delta. First, the annual average of each physical-chemical parameter was calculated for the 33 sampling stations. According to the location of the 30 stations, fish samples were clustered and linked to a specific station (figure 2). Finally, the annual mean of the physical-chemical parameters per station was combined with the linked cluster of the fisheries data for the analysis.
The dataset construction of implemented measures was performed for the Aa of Weerijs and Boven Mark and includes the construction of fish passages and remaindering projects. These waterbodies are directly connected to the Mark en Vliet and were expected to show most effect of increased
connectivity and habitat restoration of the system. Data from implemented measures carried out by the Regional Water Authority Brabantse Delta were extracted form ArcGIS. For the fish passages, the fish data was clustered according to connectivity with Mark en Vliet.
Figure 2. Overview of the 30 physical-chemical stations and clustering of the fish samples in the study area. The physical-chemical stations have different colors and correspond to the part of a waterbody
The linkage between implemented measures and fish samples were established by two ways. The remaindering projects have a more local effect compared to fish passages. For this reason, only fish samples that were exactly located within the area of the remaindering project were linked to this measure. The construction of fish passages were interpreted according to the year of construction and increased connectivity, where 0 means no fish passage / no connectivity with Mark en Vliet and 1 means realization of connectivity (figure 3).
Figure 3. Overview of the implemented measures that were included for the analysis during this study. Respectively for the Aa of Weerijs and Boven Mark, 7 and 1 fish passages showed an increased connectivity, and for both streams 3 remaindering projects were included.
2.4 Data analysis
The data analysis was performed by two phases, i.e. an exploratory analysis and explanatory analysis. The statistical analysis was performed with R version 3.2.2 (R Core Team, 2015), with the packages Vegan (Baselga et al, 2013) and Betapart (Oksanen et al, 2015).
Exploratory analysis
Species diversity was assessed for each sample using three different indices: species richness, Pielou’s evenness and Shannon’s diversity. First, species richness was determined by noting presence/absence of each species (Súarez et al., 2011). Second, the Shannon Wiener diversity index (2) was calculated for each sample, where pi is the proportion of the population belonging to specie i (Beals et al., 2000). The Shannon Wiener diversity index considers both the number of species and the distribution of individuals among species. The Shannon Wiener diversity index is commonly used to characterize species diversity in a community. Shannon Wiener diversity index is a revision, derived from community structures, and is often applied to reflect environmental quality in terms of diversity.
𝐻 = − ∑ 𝑝𝑖
𝑆
𝑖=1
∗ log 𝑝𝑖 (2)
Third, Pielou’s evenness (3) was calculated to assess information regarding the distribution of individuals among species, where H is the result of the Shannon Wiener diversity index and R is the total number of species (Beals et al., 2000). Pielou’s evenness assumes and reflects that an equal distribution among species within a communities is more diverse compared to communities which are dominated by one or two species.
𝐸 = 𝐻
ln 𝑅 (3) In the first phase of the exploratory analysis, Species richness, Pielou’s evenness and Shannon Wiener diversity index were analyzed by a linear model for each waterbody to obtain differences over the period of 20 years. Waterbodies with a significant linear trend over time were further analyzed by calculating the average species richness, Pielou’s evenness and Shannon’s diversity for the years of sampling to increase resolution. Statistical comparison of the means was performed by a two sample t-test. Each waterbody was analyzed individually and the occurred developments in diversity index are described. Finally, the significant differences in species richness, evenness and diversity were explained by scoping onto the observations of the fisheries data.
Explanatory analysis
The explanatory analysis was performed by multi-variate ordination techniques (Baselga et al, 2013). Multi-variate analyses are generally used to filter and narrow complex data sets to easier interpretable data. Ordination techniques are used for the ordering of many samples, each having several variables, along multiple dimensions or axes. The dimensions of data sets with many variables can be reduced to two or three derived axes, which may explain relationships among samples if some of the original variables contribute strongly to these axes. The axes account for the greatest amount of variation in the data and reduce the number of dimensions that should be considered (Holland, 2008). As result, similar samples will be close together and dissimilar samples will be not close together. Multivariate methods are often useful for exploring the structure of data sets and generating relevant ecological hypotheses (Fausch et al., 1990). The explanatory analysis was performed by two multi-variate ordination methods, i.e. Non-Metric Dimensional Scaling (NMDS) and Redundancy analysis (RDA).
Diversity indices
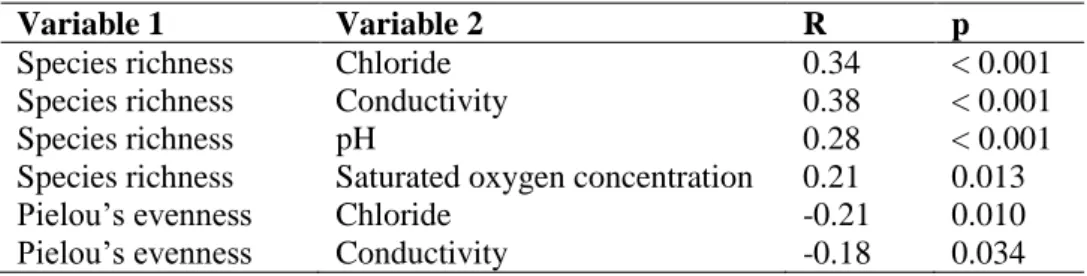
In this study, the RDA was a proper ordination technique to assess the influence of physical-chemical variables on the diversity indices (Grossman, 1998). RDA is a method to extract and summarize the variation in a set of response variables that can be explained by a set of explanatory variables. In contrast to the NMDS technique, the RDA technique assumes linear relationships between the response and explanatory variables. For this reason, the influence of the explanatory variables on the response variables is easier assessable for interpretation and reconstruction. The RDA was performed to explain relationships between the response variables (species richness, Pielou’s evenness and Shannon’s diversity) and the explanatory variables (physical-chemical variables and executive measures). Fish passages and remaindering projects were only included as explanatory variables for the Aa of Weerijs and Boven Mark.
Pearson correlations
The variables with a significant contribution to the RDA were further analyzed by a Pearson correlation test to confirm significance of the correlations. Only diversity indices and exploratory variables shown in the RDA were analyzed by the Pearson correlation analysis. Furthermore, the significant correlations (p < 0.05) and their correlation coefficient (r) were included in the results.
Fish communities
The NMDS was a proper ordination technique to compare the samples of the freshwater fish assemblages (Holland, 2008). In contrast to other ordination techniques, NMDS assumes no fixed model, and is a numerical technique that iteratively seeks the best solution to fit the data. For this reason, the NMDS technique is suited for a wide variety of data compared to other ordination techniques (Holland, 2008). Fish species that occur in less than 3% of the samples were excluded for the ordination to overcome overweighting of rare species (table 13). The input for the NMDS existed of all remaining fish species divided into length categories, transformed by a square-root
transformation to improve normality and fitting of the data to the NMDS models. The NMDS was performed by a Bray-Curtis similarity calculation, which is often used in ecologists. Ideal properties of the Bray-Curtis matrix are the robustness against the change in units, addition/removal of species or communities, and recognition of differences in total abundance when relative abundance is equal. First, all fisheries data was processed to identify differences in used fishing gear and the waterbodies of the Mark watershed. Furthermore, the different waterbodies and fishing gears were analyzed individually to obtain the differences more clearly. Second, The small streams of the Mark watershed were analyzed more accurately because more differentiation in fish assemblages was expected compared to the larger waterbodies. First, the samples were selected for dominance of guilds (appendix 5). The samples were categorized into rheophilic, limnophylic and eurytopic guilds when respectively 50% or more of the sampled fish belonged to a specific guild. Finally, the samples of the small streams were further divided into fish communities of BV & BA, RG & BE, DD & TD and SK & RV, based on the most frequent combination of occurrence in the samples, when respectively 40% or more of the collected fish belonged to the two species of a specific community.
Simper analysis
Results of fish assemblage ordinations were further explored by use of a similarity percentage analysis (simper). A simper analysis was performed to identify the most important contrasts in fish
assemblages between different groups showed in the ordinations. Results of the simper analysis, present which species are most important for the distinction between groups. In this study, the simper analysis was performed to distinguish the most contributing fish species for differences between the used fishing gears and waterbodies.
Pearson correlations
The physical-chemical variables with a significant contribution to NMDS of the fish communities in the small streams were also further analyzed by a Pearson correlation. Only physical-chemical variables shown in the NMDS of fish communities in the small streams were analyzed by the Pearson correlation analysis. Significant correlations (p < 0.05) and their correlation coefficient (r) were
3. Results and discussion
This chapter includes the results and discussion of the diversity indices (chapter 4.1) and results of the freshwater fish assemblages (chapter 4.2).
3.1 Diversity indices
For the exploration of the diversity indices a linear model was applied on the time series of fisheries data. The linear model of species richness, Pielou’s evenness and Shannon’s diversity over time for all waterbodies is presented in appendix 6. Patterns of diversity in the river basin differed greatly among waterbodies. Five of the eleven waterbodies showed a significant linear trend over time for at least one of the diversity indices. In this paragraph, the results and discussion of the diversity indices is
explained separately for each waterbody with a significant trend. First, the most important general observations are described, followed by the results and discussion for individual diversity indices. Results of diversity indices are further analyzed for correlations to physical-chemical variables and executive measures in paragraph 4.2. The Chaamse Beken, Bavelse Leij, Molenbeek,
Bijloop-Turfvaart, Merkske and Kleine Beek are not included because no significant trend was observed in the diversity indices.
3.1.1 Galderse Beek
The linear model for diversity indices at the Galderse Beek shows a significantly decreasing trend in Pielou’s evenness and Shannon’s diversity between 1994 and 2013 (figure 4). A more detailed overview of the developments in average species richness, Pielou’s evenness and Shannon’s diversity for each sampling event is shown in table 6. The diversity indices are characterized by a decrease between 1994 and 2013, where species richness decreased strongly between 2005 and 2013 and Pielou’s evenness decreased between 1994 and 2005. Despite of a significant decreasing trend over time, only Pielou’s evenness showed a significant decrease between 1994 and 2005. Shannon’s diversity decreases strongly over time, however, no significant differences were obtained between sampling events.
Figure 4. Linear model of Pielou’s evenness and Shannon’s diversity for the Galderse Beek between 1994 and 2013. The P-values of the linear model is presented in the top left corner of the plots (**, P < 0.01).
Table 6. Average species richness, Pielou’s evenness and Shannon’s diversity of the samples collected at the Galderse Beek between 1994 and 2013. Significant P-values indicate a difference compared to the previous sampling event (*, P < 0.05).
Waterbody Year Species Richness Pielou’s Evenness Shannon’s Diversity
Galderse Beek 1994 5,40 0,80 1,34
Galderse Beek 2005 5,60 0,54* 0,93
Galderse Beek 2013 4,00 0,45 0,57
A total of 2.897 individuals and eleven species were recorded for the Galderse Beek over the period of 1994 to 2013. The total number of individuals for 1994, 2005 and 2013 were respectively 332, 941 and 1.607. Most common species in the samples were nine-spined stickleback and stone loach with an occurrence of 47.5% and 35.8% of the total individuals. Sampling event of 2010 was excluded during analysis of individual sampling events, because only one sample remained after exclusion of samples with less than ten individuals. However, during this period the freshwater fish assemblage clearly deteriorated with a total of 26 individuals observed by four performed trajectories. Dimensions of the Galderse Beek are relatively small and shallow. It is possible that the cold winter of 2010 is
responsible for the decreased number of fish in the Galderse Beek in 2010 (Oldenborgh, 2015). However, it remains questionable because none of the other small streams in the Mark watershed indicates the same trend. The species European eel, stone loach, three-spined stickleback, gudgeon, pike and nine-spined stickleback were observed during all sampling years. The species roach, perch and common carp were present in 1994, and tench and rudd were present in 2005. These five species were all absent during the sampling event of 2013.
The average species richness of the samples was comparable for 1994 and 2005 and decreased by 1.6 specie between 2005 and 2013. Total species richness for the Galderse Beek was respectively 9, 8 and 6 species for the years 1994, 2005 and 2013 (appendix 7). Results of the total species richness and average species richness are matching, concluding that species richness in the Galderse Beek decreased over time. The decrease in average species richness between 1994 and 2013 is caused by absence of the species roach, common carp, tench and rudd. Disappearance of these eurytopic and limnophylic species possibly indicates that habitats in the Galderse Beek are developing and getting less appropriate for eurytopic and larger limnophylic fish species and more appropriate for rheophilic species and nine-spined stickleback. This assumption is amplified by the strong increase of stone loach for the same period. Furthermore, the species European eel, stone loach, three-spined stickleback, gudgeon, pike and nine-spined stickleback were present in all sampling years but not in every sample. For this reason, the average species richness was always lower than six species.
The average evenness showed a significant decline between 1994 and 2005. Between these sampling events, the total number of individuals increased from 332 to 941 individuals and nine-spined stickleback became dominant. In 2005, the fish species nine-spined stickleback and stone loach increased from respectively 23 and 52 individuals, to 672 and 114 individuals, together accounting for 83.5% of the total number of individuals. Comparable results were observed at the sampling event of 2013, where stone loach increased to 871 individuals and nine-spined stickleback remained relatively equal in numbers, together accounting for 96.5% of the total number of individuals. However, in 2010 almost no individuals were collected at the Galderse Beek, and could be related to a cold winter. Stone loach and nine-spined stickleback are relatively short living species, making it possible that they benefitted from the disappearance of almost all fish in 2010, and rapidly repopulated the Galderse Beek. However, more data collection in future is required to confirm this assumption.
As a result of the declining species richness and Pielou’s evenness, the Shannon diversity shows an strong decrease from 1.34 to 0.57 between 1994 and 2013. Small streams are typically inhabited by lower numbers of species due to the limiting dimensions. Additionally, Small streams are highly variable according to climate, temperature, morphology, water supply and discharge (Fieseler and Wolter, 2006). In the Galderse Beek, a fish passage was constructed in 2011, and ecological maintenance was performed since 2007. However, the Shannon’s diversity decreased to a very low value of 0.57, referring to a low number of species with an unequal distribution among species. Low diversity of the fish species in the Galderse Beek could be less robust to environmental fluctuations or anthropogenic influences. The low number of fish species and unequal distribution among species are known to be less adaptive and resistant compared to more diverse systems. On the other hand, The Galderse Beek is categorized as a small river system, prioritizing the occurrence of small rheophilic fish species, such as, stone loach and gudgeon, for the WFD evaluation. However, the
3.1.2 Strijbeekse Beek
The linear model for diversity indices at the Strijbeekse Beek shows a significantly decreasing trend in Pielou’s evenness and Shannon’s diversity between 1994 and 2013 (figure 5). A more detailed
overview of the developments in average species richness, Pielou’s evenness and Shannon’s diversity for each sampling event is shown in table 7. Pielou’s evenness and Shannon’s diversity strongly decreases between 1994 and 2006. Despite of a significant trend over time, the only significant decrease was obtained for Shannon’s diversity between 1994 and 2006. Species richness and Pielou’s evenness both decreases non significantly in the same period. Furthermore, the diversity indices remains relatively constant between 2006 and 2013.
Figure 5. Linear model of Pielou’s evenness and Shannon’s diversity for the Strijbeekse Beek between 1994 and 2013. The P-values of the linear model is presented in the top left corner of the plots (**, P < 0.01; *, P < 0.05).
Table 7. Average species richness, Pielou’s evenness and Shannon’s diversity of the samples collected at the Strijbeekse Beek between 1994 and 2013. Significant P-values indicate a difference compared to the previous sampling event (*, P < 0.05).
Waterbody Year Species Richness Pielou’s Evenness Shannon’s Diversity
Strijbeekse Beek 1994 6,00 0,88 1,56
Strijbeekse Beek 2006 5,00 0,51 0,82*
Strijbeekse Beek 2010 5,25 0,51 0,80
A total of 2.672 individuals and twelve species were recorded at the Strijbeekse Beek between 1994 and 2013. The total number of individuals increases over time, for 1994, 2006, 2010, 2013 were respectively 68, 385, 985, 1.234 individuals collected. Most common species were gudgeon and stone loach with an respectively occurrence of 77.2% and 23.5% of the total individuals. The species stone loach, gudgeon and pike were observed during all sampling years. European eel, perch, common carp, tench and pumpkinseed were all absent in the sampling event of 1994, but occurred in later sampling events. Rudd was the only specie that occurred in 1994 and not in the years after.
The average species richness remained relatively comparable between 1994 and 2013. Species richness decreased from 6 species to 5 species between 1994 to 2006 and increased form 5 species in 2010 to 6 species in 2013. The total species richness in 1994, 2006, 2010 and 2013 existed of
respectively 7, 6, 7 and 10 species (appendix 7). Sampling intensity was relatively equal compared for the sampling events. Furthermore, many fish species were observed with very low abundance, such as, one individual for common carp, roach and three-spined stickleback and two individuals for perch, pumpkinseed and European eel in 2013. For this reason, it is assumable that coincidence is part of the explanation. On the other hand, it is notable that all species with low abundances (common carp, roach, three-spined stickleback, perch, pumpkinseed and European eel) are eurytopic, therefore, it could be possible that coincidence is not the only reason for the increased total species richness. Nevertheless, the number of fish in samples at the Strijbeekse Beek are still dominated by rheophylic species, making it is difficult to understand the increase of total species richness in 2013. For a better understanding of the developments of total species richness in 2013, the collection of more fish data is required.
The average species evenness decreased strongly between 1994 and 2006 and remained comparable until 2013. In 1994, the species occurred in relatively balanced numbers with a maximum of 22 individuals and a minimum of 4 individuals per species. The number of gudgeon increased
exponentially from 20 to 297 individuals between 1994 and 2006 and accounted for 77.1% of the total individuals in 2006. Therefore, Pielou’s evenness decreased in average from 0.88 to 0.51. Between 2010 and 2013, Pielou’s evenness decreased slightly more due to observations with one or two individuals of the species common carp, roach, three-spined stickleback, perch, pumpkinseed and European eel in 2013. The total number of individuals collected at the Strijbeekse beek increased over time, and individual specimen were more often observed. Therefore, it is logically that Pielou’s evenness decreases as effect of the more unbalanced distribution among species.