Repositório ISCTE-IUL
Deposited in Repositório ISCTE-IUL: 2019-03-20
Deposited version: Post-print
Peer-review status of attached file: Peer-reviewed
Citation for published item:
Moro, S., Rita, P. & Oliveira, C. (2018). Factors influencing hotels’ online prices. Journal of Hospitality Marketing and Management. 27 (4), 443-464
Further information on publisher's website: 10.1080/19368623.2018.1395379
Publisher's copyright statement:
This is the peer reviewed version of the following article: Moro, S., Rita, P. & Oliveira, C. (2018). Factors influencing hotels’ online prices. Journal of Hospitality Marketing and Management. 27 (4), 443-464, which has been published in final form at
https://dx.doi.org/10.1080/19368623.2018.1395379. This article may be used for non-commercial purposes in accordance with the Publisher's Terms and Conditions for self-archiving.
Use policy
Creative Commons CC BY 4.0
The full-text may be used and/or reproduced, and given to third parties in any format or medium, without prior permission or charge, for personal research or study, educational, or not-for-profit purposes provided that:
• a full bibliographic reference is made to the original source • a link is made to the metadata record in the Repository • the full-text is not changed in any way
The full-text must not be sold in any format or medium without the formal permission of the copyright holders. Serviços de Informação e Documentação, Instituto Universitário de Lisboa (ISCTE-IUL)
Av. das Forças Armadas, Edifício II, 1649-026 Lisboa Portugal Phone: +(351) 217 903 024 | e-mail: [email protected]
1
Factors influencing hotels’ online prices
Abstract
Digital corporations are creating new paths of business driven by consumers empowered by social media. Understanding the role that each feature drawn from online platforms has on price fluctuation is vital for leveraging decision making.
In this study, 5603 simulations of online reservations from 23 Portuguese cities were gathered, including characterizing features from social media, web visibility and hotel amenities, from four renowned online sources: Booking.com, TripAdvisor, Google, and Facebook. After data preparation, including removal of irrelevant features in terms of modeling and outlier cleaning, a tuned dataset of 3137 simulations and 30 features (including the price charged per day) was used first for evaluating the modeling performance of an ensemble of multilayer perceptrons, and then for extracting valuable knowledge through the data-based sensitivity analysis.
Findings show that all features from the encompassed factors (social media, online reservation, hotel characteristics, web visibility and city) play a significant role in price.
2
1. Introduction
Pricing is at the core of any marketing strategy, including in the hospitality industry leveraging new paradigms of revenue management to incorporate technological evolution (McGuire, 2016). In the most recent decades, a plethora of new technologies have emerged to change the landscape of hotel accommodation booking. The advent of the Internet, which has been revolutionizing businesses worldwide since the 1990s, virtually enabled every organization, regardless of its size, to keep a cyber-presence, boosting its brand image to a planetary scale (Doherty & Ellis-Chadwick, 2010). Websites have evolved from static to dynamic user-generated contents as a result of the Web 2.0 revolution, by empowering consumers to an unforeseen level: virtually every user is a content producer and may provide feedback on any product or service, thus influencing others through electronic word-of-mouth (eWOM) (Labrecque et al., 2013). Corporations worldwide need to keep pace of their websites’ performance, measured by the rank position in queries performed on search engines, especially in Google, which dominates the landscape across the globe (Paraskevas et al., 2011). Google Ads is a tool commercialized by Google to help companies gain some control on the position its webpage ranks (Lee, 2011). Additionally, secured online payment systems enable hotel website visitors to finish the transaction and book rooms at the distance of a click (Li et al., 2015). Furthermore, global scale pure digital players have emerged to dominate markets by offering digital services which facilitate customer acquisition of third-party products or services, such as hotel rooms’ booking (Alt & Zimmermann, 2015). Particularly relevant in the hospitality industry are especially designed customer feedback sites such as TripAdvisor, where users may score hotel units and/or analyze other tourists’ opinions (Ayeh et al., 2016). Such profusion of information can be effectively used by managers to support their pricing strategies.
3
Social media and Online Travel Agencies (OTAs) have brought price transparency to an unforeseen level from a consumer perspective (McGuire, 2016). Today a tourist will likely access to an online customer reviews’ platform to assess others’ opinions before making the purchase, probably complementing the information by going to the hotel’s website to obtain additional information on the amenities provided and detailed photos. Then, the user can access an OTA and compare the prices practiced by the different alternatives previously identified, before finally booking a room. This motivational example highlights the need for hoteliers to account for all the information that may influence tourists’ decisions when defining prices (Xu et al., 2017). Two recent studies were also devoted to analyzing prices on a wide scale (Oses et al., 2016a; Oses et al., 2016b). The first gathered data from digital footprint from the Balearic Islands, while the second used a data scraping bot to collect prices from Booking.com from the Basque Country. Nevertheless, neither considered hotels’ scores on social media nor hotels’ amenities. The present study aims at filling such research gap by unveiling the factors contributing to price definition through an advanced data mining model.
2. Literature Review
2.1.Online booking and social media
The development of new Internet-based information systems has driven the task of booking rooms in hotels toward online booking, whether using hotels’ websites or through global OTAs, with the latter prevailing as the dominant source of online booking (Tse, 2013; Park et al., 2017). Moreover, the hospitality industry was among the first sectors to embrace online customer feedback. Through specifically designed review sites such as TripAdvisor, tourists are able to report their experiences in both quantitative scores and textual comments, influencing
4
prospective users (Jeacle & Carter, 2011). Generic social networks can also be powerful eWOM tools within the hospitality industry, with literature acknowledging such relevance (Nunkoo et al., 2013). Specifically, hotel managers are aware of the importance of Facebook, and most hotels currently have an official Facebook page where users can write comments, or “like” publications (Leung et al., 2015). Additionally, hotels can also be rated, and tourists who stayed in the hotel can mark their photos as having been there, increasing the count of the number of stays at the hotel. Nevertheless, no study was found using such specific information.
Each of the numerous available sources of information can play a role in the consumer purchasing decision (Moon & Kamakura, 2016). Murphy and Chen (2016) evaluated online sources used in hotel bookings and concluded that all online communication channels should be accounted for within a consistent marketing communication strategy, including search engines for a first assessment of hotel offers, and OTAs and review sites on a second information level.
Understanding the distinct influencing dimensions on users´ behavior is a key asset for supporting managerial decisions in the current Big Data world. As such, hoteliers need to cope with all available variables, including those they cannot control, in order to incorporate in-depth knowledge in their e-marketing strategies to thrive and excel in a smaller and interconnected world.
2.2.Hotel booking and pricing
Revenue management emerged in the hospitality industry to leverage decision making on the most profitable mix of variables influencing revenue, including the number of rooms sold and the price paid for each room. However, new communication media including both OTAs and
5
online reviews’ platforms pose big challenges in a social world (Noone et al., 2017). Managers need to conceive adequate pricing strategies in a difficult context facing price transparency, as users now can simulate bookings at the distance of a click and easily compare the prices offered for similar services (McGuire, 2016).
Recently, Kimes (2017) identified the following major drivers for change in revenue management: information technology, data analytics followed by mobile technology and economic conditions. Moreover, Yacouel and Fleischer (2012) found that hotels which received higher scores on OTAs charge higher prices, showing an effect of price based on customer rating. Ling et al. (2014) studied an optimal online pricing strategy for a hotel being promoted in an OTA. Through sensitivity analysis, these authors unveiled a higher likelihood of larger profits for hotel units with a lower occupancy rate prior to establishing a promotion agreement with an OTA. However, their study considered only both hotel and OTA characteristics, not accounting for other dimensions such as consumer behavior (e.g., the days ahead of reservation or the length of stay) or the social media effect. According to Anderson (2012), social media holds the potential to move markets by driving consumers’ purchasing intentions, thus influencing lodging performance. In fact, online feedback on social media platforms is a driving force that hotel managers cannot afford to neglect (Calheiros et al., 2017).
2.3.Data and text mining on hotel booking website
Several techniques are available for modeling price, such as the traditional linear regression, and decision trees, along with the most sophisticated neural networks and support vector machines (Cortez, 2010). While data mining models can provide predictive knowledge by directly
6
applying the model to new input data for prediction of an outcome, these models can also be used to obtain explanatory knowledge, by understanding how the model was conceived when it acquired knowledge from the data used for training it. A few methods can be used, such as rules extraction and sensitivity analysis. While the former might fail at assessing the representativeness of the model due to disregard of relevant rules and danger of generalization mainly resultant of discretization of the complex non-linear relations hidden within the model, the latter constitutes an interesting approach by its non-invasive nature as it is based on varying the input features through their range of possible values to assess how sensitive such changes are on the outcome (Cortez & Embrechts, 2013). Moreover, in the present study, the data-based sensitivity analysis (DSA) is adopted as it considers variations of multiple features at the same time, allowing to disentangle inter-related features. Although such method is recent (it was introduced in 2013), it has already been successfully applied to a wide range of problems such as in bank telemarketing (Moro et al., 2015) and social media (Moro et al., 2016), as well as for modeling TripAdvisor’s score of hotels (Moro et al., 2017).
Recent research suggests that data mining is an increasingly relevant trend in tourism and hospitality, especially in the current Big Data age with manifold sources (Schuckert et al., 2015). Nevertheless, it should be stressed that a large portion of research on tourism using data mining is still devoted to forecasting tourism demand, one of the most prolific and interesting domains from a managerial perspective (Moro & Rita, 2016). Radojevic et al. (2015) included as inputs to their linear mixed model features on hotel amenities, the hotel number of stars, location and the price effect, as measured by the average city accommodation price and the specific hotel price. The same authors modeled customer experience (hotel score given by tourists) and found that the most influencing features on the score were the hotel star rating system and the prices. A recent
7
hot topic consists in extracting knowledge from unstructured textual contents gathered from social media, such as the comments contained in online reviews (Calheiros et al., 2017). Text mining enables to find hidden patterns within text, helping to achieve a deeper understanding of customer feedback through the analysis of a large number of reviews. Such knowledge may be presented in coherent topics aggregating meaningful reviews classified by relevant words (Guo et al., 2017) or through the identification of determinant factors characterized by high-loading terms (Xu & Li, 2016).
3. Methods
3.1.Data collection and preparation
The geographic location of hotel units is a known key influencing factor of tourism demand and thus of the prices charged for accommodation (Radojevic et al., 2015). It is usually associated with the brand image and awareness of each specific tourist location (Sahin & Baloglu, 2014). Therefore, this study focuses on Portugal, an attractive tourist country, with tourism accounting as one of the major economic sectors. Although being a small country in Europe, it holds regional asymmetries and a high seasonality degree, with a summer peak as a result of its attractive shore line with renowned beaches (Andraz et al., 2015). The tourist destinations included the eighteen continental district capitals plus five renowned tourist cities.
Data is the key raw ingredient for successful data mining experiments. Considering the present research is an attempt to incorporate as many factors as possible that may have an impact on hotel price, several sources were in demand for collecting the required data. In order to maximize the impact each information source has on users, the chosen online sources were the top ranked
8
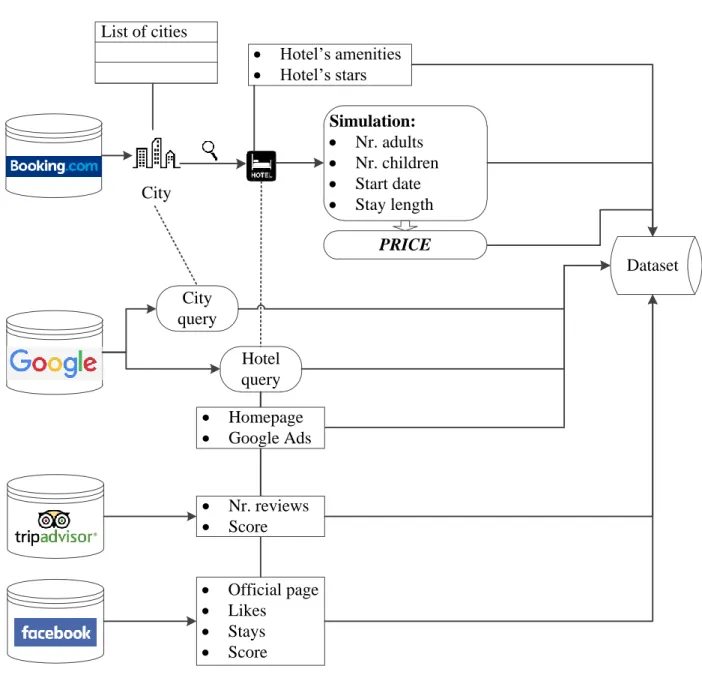
brands for each type of information. As a main source for all online booking simulations, Booking.com was used, as it is considered one of the mainstreams in OTA (Yacouel & Fleischer, 2012). Although Booking.com also implements a scoring system for tourists to rate hotel units, the recent research note by Mellinas et al. (2015) uncovered an important limitation: its rating system ranges from 2.5 to 10, although several previous studies using data from Booking.com seem to account for a more standard 0 to 10 scale. Subsequent study by the same authors concludes its rating system significantly distorts scores, particularly in hotels with low and medium scores (Mellinas et al., 2016). Given such evidence, the present study does not include scores granted on Booking.com; instead, it adopts the most renowned tourism and hospitality scoring platform, TripAdvisor (Jeacle & Carter, 2011), and the social network that spreads across the globe, Facebook, reaching 2.01 billion monthly active users as of June 30, 2017 (Facebook, 2017). Furthermore, recent literature has shown consistency between Booking.com and TripAdvisor (e.g., Marchiori et al., 2011; Băltescu, 2015). Nevertheless, a comparison was made between the scores granted on Booking.com and on TripAdvisor. Table 1 shows consistency between the two platforms for the hotels considered in the dataset. As tourists are becoming increasingly aware of online reviews, it seems to contribute to standardizing hotels’ scores in online platforms. Yet, it is a subject where more research is in demand to fully assess such level of standardization. The fourth source included is Google, the search engines’ conspicuous market leader (Miklošík & Daňo, 2016). Figure 1 shows how each of the four global online data sources was used in the procedure to gather all data (and provides a few examples of the collected features), which is explained shortly.
The procedure for collecting the data consisted in creating a set of online booking scenarios for each of the twenty three cities, considering the following guidelines: attempting to book a room
9
through Booking.com on a few hotel units, varying the number of adults (one or two, considering most hotels do not allow more than two adults in the same room), the number of children (to a maximum of two, considering also most hotels do not allow more than two in the same room with adults, and setting the age to the constant of 4 years), the number of days ahead of reservation (considering short, medium and long term schedules, during 2016 and 2017) and the duration of the stay. To accomplish such task, twenty-three volunteers were assigned a city each and asked to perform bookings considering real scenarios that would make sense in their case for different real situations (including business and leisure travels). After reaching the purchase page (but without finishing it), all required reservation data was collected, thus ensuring real online information would be used for the empirical research. At least two hundred simulations were collected for each city, to assure a reasonable number of different cases.
The experiments were conducted in the first quarter of 2016, with all reservations encompassed within the years of 2016 and 2017 (from February/2016 to August/2017). The hotel characteristics (e.g., number of stars) were gathered from Booking.com, while also performing a search on Google and collecting additional data if the hotel had a website. While a vast number of amenities are available, this study focused specifically on those which are different among the studied hotels. Therefore, we considered free wifi, as Radojevic et al. (2015) also did, but did not included the other two used by the aforementioned authors (air conditioning and lobby bar), since all the units in the dataset offered them. Additionally, eight other amenities were included that presented a differentiating factor among the studied units. While many more could be included, it is very difficult to identify all possible features that may affect customer satisfaction, given the vast array available.
10
Both TripAdvisor and Facebook were accessed to gather customer scores on the hotels. Table 2 shows all the features collected. The selected hotels were the ones shown on the first page results from the query on Booking.com for each city, while the simulations consisted in varying the period of stay and the number of people (features marked with source=“user”). The price considered for this study was the lowest result among the different types of rooms available for the designated number of people and period, considering Booking.com suggests a few possibilities, when available. Google was used for two types of search: first, by querying with the quoted hotel name; then, by querying with “hotels” plus the city name, for assessing the range of hits as a result of the brand image associated with the city name, which may influence hotel prices (Sahin & Baloglu, 2014). For hotels with their own websites, two types of information were gathered: if the website allowed online reservation, and if it provided an online payment system. For the case of Google Ads, besides finding if the hotel appeared in any advertisement, the link to which the ad redirected the browser was also accounted for, as shown in Table 2. From Facebook, a few different metrics were collected. Some hotels have official Facebook pages, while other pages are marked as unofficial. Also, besides the usual number of likes, if a user stays in a hotel and publishes a photo marking it as being taken in the hotel, the number of stays increases. Facebook also provides a scoring system from 1 to 5, similar to TripAdvisor, which was also taken into account, along with the number of reviews (with a higher number strengthening the hotel score, helping to build its reputation, as shown by Yacouel and Fleischer, 2012).
A total of 5603 simulations were made and gathered through the procedure described and illustrated in Figure 1. However, 2466 were discarded (almost 42.6%) due to four main reasons identified in Table 3. Hence, a total of 3137 remained to be used for building the pricing model.
11
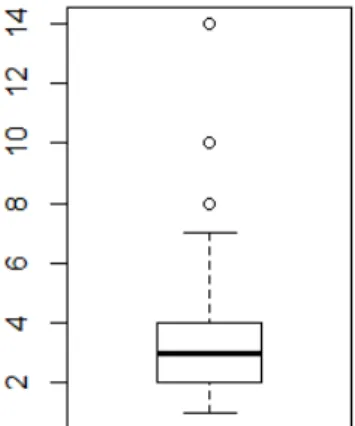
The data preparation procedure resulted in eleven original features being removed (Table 4). Outliers for numerical data were identified using boxplots (e.g., Figure 2), and extremely unbalanced binary features were also discarded, according to Forman’s (2003) recommendation. Also, new features were computed, as described in Table 5. For example, a new feature accounting for the non-working days encompassed in the period of stay was computed to address the different prices practiced by hoteliers depending on the days (Sainaghi, 2010). The resulting dataset included a total of 30 features listed in Table 6, including the price per day (the outcome feature to be modeled) and 3137 simulations.
3.2.Data mining and knowledge extraction
The result of the data collection and preparation procedures was a tuned dataset ready to feed a data mining algorithm to build the pricing model based on the remaining 29 features (identified in Table 6). For modeling price, the technique adopted was an ensemble of multilayer perceptrons, which has provided the most accurate models in several previous studies when compared to other advanced modeling techniques such as support vector machines (Moro et al., 2014). Neural networks are a computerized attempt to mimic the human brain, with neurons interconnected to determine a certain outcome based on patterns previously detected on input features which were used to train the network (Russell & Norvig, 2002). The multilayer perceptron is the most popular neural network architecture, with hidden layers (in most cases, one is enough) composed of several hidden nodes (neurons) and one final output node (Haykin, 2009). Figure 3 exhibits the structure of a simple network with one hidden layer composed of m neurons, and n input features, where each neuron is activated through an activation function ( ( ∑ )).
12
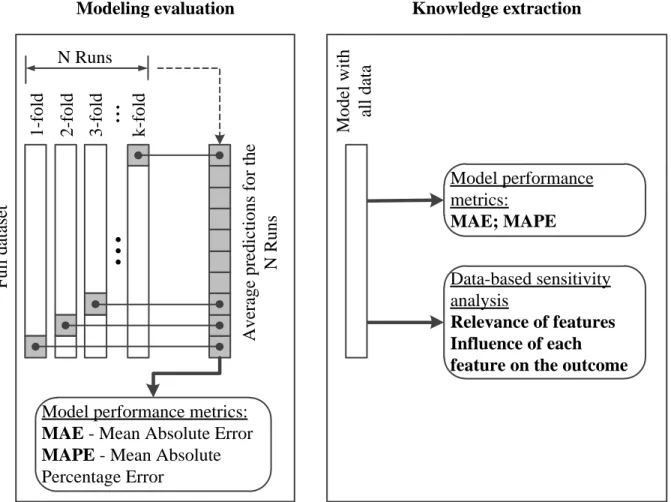
As a mean to assure modeling robustness, the followed procedure comprised two stages: a model evaluation stage; and a knowledge extraction stage (both are illustrated in Figure 4). During model evaluation, the dataset was split into deciles, and a k-fold cross-validation computation was executed, with 9/10 of the simulations used for training the model and the remaining 1/10 for testing its performance in unforeseen data, allowing to assess prediction accuracy (Berry et al., 2004). To further validate the procedure, a total of N=20 runs were executed, and the average predictions were computed to address the fact that artificial neural networks are complex non-linear models, thus each execution may provide different results. In this stage, both mean absolute error (MAE) and mean absolute percentage error (MAPE) were computed and evaluated to assure reasonable performance prediction metrics before stepping into the next stage. Knowledge extraction was accomplished by first building a model upon all the data, thus reflecting the hidden patterns of knowledge from all the gathered simulations. Thereafter, the most relevant features were analyzed in-depth through DSA for acquiring its effects on price, translating it into actionable knowledge to leverage hospitality business.
All the experiments described were programmed into the R statistical platform, a freeware and open source tool with a worldwide community of enthusiasts which provide a myriad of packages for numerous purposes. Among those is the rminer, which implements a simple set of coherent functions for data mining, including the DSA (Cortez, 2010).
4. Results and Discussion
The result of both the modeling evaluation and knowledge extraction model is displayed in Table 7 for both metrics. In the realistic predictive scenario of the modeling evaluation stage, MAE
13
reveals an average discrepancy of 14.32 € to the real prices, with MAPE showing a relative deviation of 12.70%. These metrics express good predictions, considering a multilayer perceptron model achieves an approximation of around 87% when modeling price. Hence, this first stage procedure validates the dataset and modeling technique. For knowledge extraction, all data is used to build the model, and the same data is then used to compute the difference of the model outcomes to the real prices, thus testing the fitting of the actual data. For this reason, MAE and MAPE are obviously better, achieving slightly lower error metrics. With a MAPE of around 10.6%, the model is then opened using DSA to extract knowledge on how it makes its decisions.
DSA provided a rank of the booking simulation features that were used for modeling price. Table 8 shows the results in descending order of its relevance. The first interesting result to note is the fact that, while some features have a significantly higher relevance, there is not a single feature or group of features that clearly stand-out, implying that each individual feature plays a role on price definition. To summarize the findings and provide a visual picture, each feature was categorized under one of five influencing groups: social media, reservation, hotel, city, and web visibility. Figure 5 unveils social media, hotel, and reservation features as the three most influencing groups. The results for Portugal are consistent with the current state of the art, as social media are increasingly relevant in pricing (Noone et al., 2011), to add up to known influence of both hotel (Dev et al., 2017) and reservation (Guo et al., 2013) features. Thus, the presented results emphasize the intrinsic bidirectional relationship between managers, which are concerned with their hotel’s brand image on social media and possibly adjust prices accordingly, and users’ eWOM. In addition to social media impact, web visibility is also playing a significant role, holding a relevance of around 15% to the price model, confirming previous studies (e.g., Yang et al., 2014). Therefore, it is actually possible to accurately model accommodation prices in
14
hotels by including digital marketing variables on both social media and web visibility on searches, which together accounted for 42% of influence on prices (at least for the sample of gathered bookings). Such finding may be considered as a response to the research marketing agenda proposed by Kannan (2016).
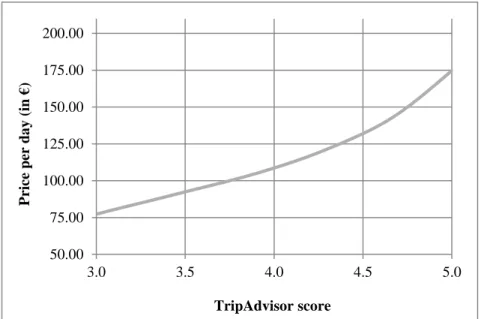
To further enlighten on the influence of the most relevant features, next paragraphs are devoted to analyze the ten features that encompass around 60% of relevance, marked in white in Table 8. Figure 6 shows the pronounced effect that TripAdvisor score has on price. A previous study by Jeong and Mindy Jeon (2008) also found a similar effect on hotel’s performance, with experiments based on New York hotels. Therefore, this finding provides further evidence that hotel managers are paying special attention to TripAdvisor performance when deciding upon pricing strategies. The increasing global awareness toward the most known online reviews’ platforms implies that tourists are making judged decisions based on others’ opinions. Hotel managers are particularly concerned with the undeniable power of TripAdvisor (Ayeh et al., 2013) while, simultaneously, they are trying to use it as a competitive advantage to boost the positive visibility of their units (Calheiros et al., 2017). This dichotomy is expected to continue in the upcoming years.
The second most relevant feature discovered is the number of children included when booking the accommodation, with a relevance of 7.40%, almost 2% below the TripAdvisor score, emphasizing the influence of online reviews’ platforms, in particular, TripAdvisor. Typically, hotels may provide one or two extra beds in the same room by charging an additional fee. Results illustrated in Figure 7 suggest that price increases from 101 to around 128 euros, almost 27% above the original price, while the second additional bed comes at a cost of around 34% over the price of a room with only one extra bed. According to Emel et al. (2007),
price-15
conscious travelers devote particular attention to the cost charged for extra beds, thus managers should carefully balance the fees by minimizing the impact on consumer’s choice while aiming at a higher profit.
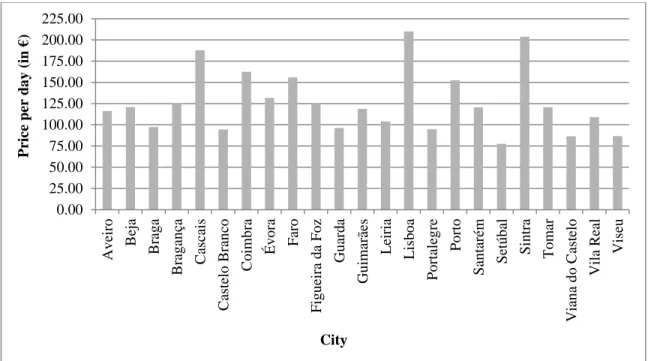
Even in a small country such as Portugal, the location context plays a key role, affecting hotels’ prices: this is the third most relevant feature. It is possible to observe from Figure 8 that the capital and largest city, Lisboa, charges the highest prices. Interestingly, two highly promoted destinations with brand images known to online tourism (Oliveira, 2013), namely, Cascais and Sintra, charge similar prices to Lisboa. The next three cities associated with higher prices are Porto and Coimbra, the second and third largest Portuguese cities, and Faro, the Algarve district capital, highly potentiated by summer tourism (Andraz et al., 2015).
Figure 9 shows that the number of stars positively affects price, a widely known finding (Yacouel & Fleischer, 2012). While the star rate system is determined by independent entities, it reflects a mixed evaluation of services offered, features, rate and satisfaction score, thus higher ranked hotels are typically those that charge the highest price.
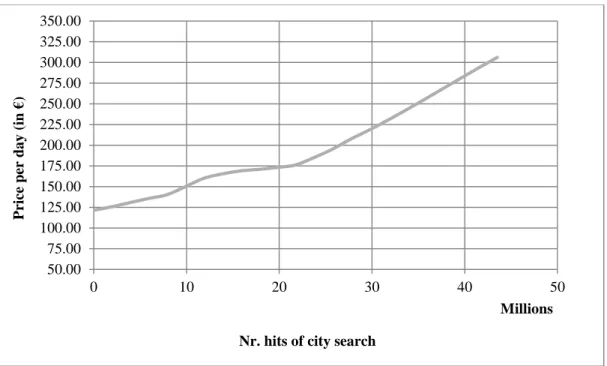
In terms of web visibility, two features were also found to have an influence on price, namely the number of hits when querying Google with the city name plus the word “hotel”, and the flag that indicates if the hotel’s website implements an online payment system for easing clients’ reservations. For both, the results are consistently expected: hotels in cities appearing more often in Google tend to charge higher prices (Figure 10), confirming city’s relevance in pricing (Figure 5); also, hotels offering online payment option charge higher prices (Figure 13). The two features exemplify the need to both appear as an appealing tourist destination in Google while at the same time offering a complete online service to promote direct booking without depending on
third-16
party platforms (e.g., Booking.com). Furthermore, the latter is associated with upscale hotels’ need to meet the expectations of a growing technology generation of tourists (Brochado et al., 2016).
With a relevance of 6%, the number of days ahead of reservation is the sixth most relevant feature, anticipating booking results in lower prices (Figure 11), as expected; nevertheless, scheduling more than a hundred days in advance seems to have a small effect on price fluctuation, whereas, as time goes by toward the date of reservation, the effect becomes more pronounced. Also, Sun et al. (2016) have found that room prices practiced by Hong Kong hotels increase sharply a week prior to check-in, leading to hypothesize that a more mature market such as Hong Kong with high occupation rates acts on the price variable only closer to the predicted check-in date, whereas the Portuguese hospitality industry struggles more to attract tourists.
Figure 12shows the effect of the length of stay (the seventh most relevant feature, contributing with 5.42% of relevance) on price fluctuation. A lengthier stay implies a cost reduction on the price per day, as expected, since hotels invest in attracting tourists for longer periods to keep high occupancy rates. Nevertheless, recent published literature holds conflicting results: while Masiero et al. (2015) support our finding, Riasi et al. (2017) discovered that, on average, hotels charge more per night when the guests stay longer. However, the former study considered bookings in Switzerland, while the latter considered them in the United States. Hence, none of the results are directly comparable to the present study, where Portugal was the considered destination.
The Facebook score holds a relation to room price ranging between around 120 and 150 € (Figure 14). It seems that Facebook’s users tend to be more demanding with more expensive
17
hotels; also, experienced Facebook’s users are price sensitive (Best, 2014). Figure 15 shows that global brands offer lower prices, which is an unexpected result, considering branded hotels benefit from brand premium (Ivanov, 2014; Ivanova et al., 2016). Further studies on Portuguese branded hotels are required to understand this localized phenomenon.
5. Conclusions, implications and limitations
The present research highlights that pricing encompasses a myriad of characteristics, with all the 29 combined features playing a role in modeling price. Nevertheless, TripAdvisor score was found to have the most significant relevance (almost 10%). Therefore, hotel managers can easily use it as a proxy to analyze the range of prices practiced by the competition without needing to perform a more demanding pricing analysis. There are some features directly controlled by hotels that managers believe to be an asset for which tourists are willing to pay more, such as holding an online payment system in their website, as well as some amenities; however, the latter seem to play a lesser relevant role in price definition than other features already widely studied in the literature, such as those related to the geographical location of the hotel (e.g., located in the city, or near a beach). Also, web visibility accounted for 15% of relevance when modeling prices. Clearly this is a confirmation that hotel managers are aware of the groundbreaking digital reality in today's world and are adjusting prices accordingly. Although dynamic pricing has been practiced in the hospitality industry for a while, as it is possible to observe by the influence of the length of stay and the days ahead of reservation, it is imperative for hoteliers to incorporate social media customer feedback when evaluating revenue management, to reflect its impact on the practiced prices (Noone, 2016).
18
The present study has a few limitations that must be stated. The most relevant one is that, while the number of simulations is high, the built dataset cannot encompass all possible scenarios. An imposed limitation during the simulations was to set the age of children to four years old. Finally, this study is country-based. Nevertheless, the procedure is replicable to any other geography; thus, a direction for future research is to build a price fluctuation model in other countries to understand how these behave.
19
References
Alt, R., & Zimmermann, H. D. (2015). Editorial 25/3: Electronic Markets on ecosystems and tourism. Electronic Markets, 25(3): 169–174.
Anderson, C. K. (2012). The impact of social media on lodging performance. Cornell Hospitality Report, 12(15), 4-11.
Andraz, J. M., Norte, N. M., & Gonçalves, H. S. (2015). Effects of tourism on regional asymmetries: Empirical evidence for Portugal. Tourism Management, 50, 257-267.
Ayeh, J. K., Au, N., & Law, R. (2013). “Do we believe in TripAdvisor?” Examining credibility perceptions and online travelers’ attitude toward using user-generated content. Journal of Travel Research, 52(4), 437-452.
Ayeh, J. K., Au, N., & Law, R. (2016). Investigating cross-national heterogeneity in the adoption of online hotel reviews. International Journal of Hospitality Management, 55, 142-153.
Băltescu, C. A. (2015). The online assessment of tourism services. The hotel market from Braşov County. Bulletin of the Transilvania University of Braşov, 8(57), 141-148.
Berry, T. A., McKeen, T. R., Pugsley, T. S., & Dalai, A. K. (2004). Two-dimensional reaction engineering model of the riser section of a fluid catalytic cracking unit. Industrial & Engineering Chemistry Research, 43(18), 5571-5581.
Best, M. L. (2014). The internet that Facebook built. Communications of the ACM, 57(12), 21-23.
20
Brochado, A., Rita, P., & Margarido, A. (2016). High tech meets high touch in upscale hotels. Journal of Hospitality and Tourism Technology, 7(4), 347-365.
Calheiros, A. C., Moro, S., & Rita, P. (2017). Sentiment Classification of Consumer-Generated Online Reviews Using Topic Modeling. Journal of Hospitality Marketing & Management, 26(7), 675-693.
Cortez, P., & Embrechts, M. J. (2013). Using sensitivity analysis and visualization techniques to open black box data mining models. Information Sciences, 225, 1-17.
Cortez, P. (2010). Data mining with neural networks and support vector machines using the R/rminer tool. In Industrial Conference on Data Mining (pp. 572-583). Springer Berlin Heidelberg.
Dev, C., Hamilton, R., & Rust, R. (2017). Hotel Brand Standards: How to Pick the Right Amenities for Your Property.Cornell Hospitality Research Brief, 17(3), 3-7.
Doherty, N. F., & Ellis-Chadwick, F. (2010). Internet retailing: the past, the present and the future. International Journal of Retail & Distribution Management, 38(11/12), 943-965.
Emel, G. G., Taskin, Ç., & Akat, Ö. (2007). Profiling a domestic tourism market by means of association rule mining. Anatolia, 18(2): 334–342.
Facebook (2017). Facebook newsroom – Company Info. http://newsroom.fb.com/company-info/ Accessed Sep 15, 2017.
Forman, G. (2003). An extensive empirical study of feature selection metrics for text classification. Journal of Machine Learning Research, 3, 1289-1305.
21
Guo, Y., Barnes, S. J., & Jia, Q. (2017). Mining meaning from online ratings and reviews: Tourist satisfaction analysis using latent dirichlet allocation. Tourism Management, 59, 467-483.
Guo, X., Ling, L., Yang, C., Li, Z., & Liang, L. (2013). Optimal pricing strategy based on market segmentation for service products using online reservation systems: An application to hotel rooms. International Journal of Hospitality Management, 35, 274-281.
Haykin, S. S. (2009). Neural networks and learning machines. 3rd ed. Pearson.
Ivanov, S. (2014). Hotel Revenue Management: From Theory to Practice. Varna: Zangador
Ivanova, M., Ivanov, S., & Magnini, V. P. (2016). The Routledge handbook of hotel chain management. Routledge.
Jeacle, I., & Carter, C. (2011). In TripAdvisor we trust: Rankings, calculative regimes and abstract systems. Accounting, Organizations and Society, 36(4), 293-309.
Jeong, M., & Mindy Jeon, M. (2008). Customer reviews of hotel experiences through consumer generated media (CGM). Journal of Hospitality & Leisure Marketing, 17(1-2), 121-138.
Kannan, P. K. (2017). Digital marketing: A framework, review and research agenda. International Journal of Research in Marketing, 34(1), 22-45.
Kimes, S. E. (2017). The future of hotel revenue management. Cornell Hospitality Report, 17(1), 3-10.
Labrecque, L. I., vor dem Esche, J., Mathwick, C., Novak, T. P., & Hofacker, C. F. (2013). Consumer power: Evolution in the digital age. Journal of Interactive Marketing, 27(4), 257-269.
22
Leung, X. Y., Bai, B., & Stahura, K. A. (2015). The marketing effectiveness of social media in the hotel industry: A comparison of Facebook and Twitter. Journal of Hospitality & Tourism Research, 39(2), 147-169.
Li, X., Wang, Y., & Yu, Y. (2015). Present and future hotel website marketing activities: Change propensity analysis. International Journal of Hospitality Management, 47, 131-139.
Ling, L., Guo, X., & Yang, C. (2014). Opening the online marketplace: An examination of hotel pricing and travel agency on-line distribution of rooms. Tourism Management, 45, 234-243.
Marchiori, E., Eynard, D., Inversini, A., Cantoni, L., & Cerretti, F. (2011). Harvesting online contents: An analysis of hotel reviews websites. In ENTER (pp. 101-112).
Masiero, L., Nicolau, J. L., & Law, R. (2015). A demand-driven analysis of tourist accommodation price: A quantile regression of room bookings. International Journal of Hospitality Management, 50, 1-8.
McGuire, K. A. (2016). Hotel Pricing in a Social World - Driving Value in the Digital Economy. New Jersey: Wiley.
Melián-González, S., & Bulchand-Gidumal, J. (2016). A model that connects information technology and hotel performance. Tourism Management, 53, 30-37.
Mellinas, J. P., María-Dolores, S. M. M., & García, J. J. B. (2015). Booking. com: The unexpected scoring system. Tourism Management, 49, 72-74.
Mellinas, J. P., María-Dolores, S. M. M., & García, J. J. B. (2016). Effects of the Booking. com scoring system. Tourism Management, 57, 80-83.
23
Miklošík, A., & Daňo, F. (2016). Search Engine Optimisation and Google Answer Box. Communication Today, 7(1), 82-91.
Moon, S., & Kamakura, W. A. (2017). A picture is worth a thousand words: Translating product reviews into a product positioning map. International Journal of Research in Marketing, 34(1), 265-285.
Moro, S., Cortez, P., & Rita, P. (2014). A data-driven approach to predict the success of bank telemarketing. Decision Support Systems, 62, 22-31.
Moro, S., Cortez, P., & Rita, P. (2015). Using customer lifetime value and neural networks to improve the prediction of bank deposit subscription in telemarketing campaigns. Neural Computing and Applications, 26(1): 131–139.
Moro, S., Rita, P., & Vala, B. (2016). Predicting social media performance metrics and evaluation of the impact on brand building: A data mining approach. Journal of Business Research, 69(9), 3341-3351.
Moro, S., Rita, P., & Coelho, J. (2017). Stripping customers' feedback on hotels through data mining: The case of Las Vegas Strip. Tourism Management Perspectives, 23, 41-52.
Moro, S., & Rita, P. (2016). Forecasting tomorrow’s tourist. Worldwide Hospitality and Tourism Themes, 8(6), 643–653.
Murphy, H. C., & Chen, M. M. (2016). Online Information Sources Used in Hotel Bookings: Examining Relevance and Recall. Journal of Travel Research, 55(4), 523-536.
24
Noone, B. M., McGuire, K. A., & Rohlfs, K. V. (2011). Social media meets hotel revenue management: Opportunities, issues and unanswered questions. Journal of Revenue and Pricing Management, 10(4), 293-305.
Noone, B. M. (2016). Pricing for hotel revenue management: Evolution in an era of price transparency. Journal of Revenue and Pricing Management, 15(3-4), 264-269.
Noone, B. M., Enz, C. A., & Glassmire, J. (2017). Total hotel revenue management: a strategic profit perspective. Cornell Hospitality Report, 17(8), 3-15.
Nunkoo, R., Gursoy, D., & Ramkissoon, H. (2013). Developments in hospitality marketing and management: Social network analysis and research themes. Journal of Hospitality Marketing & Management, 22(3), 269-288.
Oliveira, E. (2013). Making Strategies in Destination Branding: What is the online tourism promotional material saying about Portugal. In International Conference on Sustainable Issues and Challenges in Tourism (pp. 9-15), Taylor & Francis.
Oses, N., Gerrikagoitia, J. K., & Alzua, A. (2016a). Evidence of hotels’ dynamic pricing patterns on an internet distribution channel: the case study of the Basque Country’s hotels in 2013–2014. Information Technology & Tourism, 15(4), 365-394.
Oses, N., Gerrikagoitia, J. K., & Alzua, A. (2016b). Modelling and prediction of a destination’s monthly average daily rate and occupancy rate based on hotel room prices offered online. Tourism Economics, 22(6), 1380-1403.
25
Paraskevas, A., Katsogridakis, I., Law, R., & Buhalis, D. (2011). Search engine marketing: Transforming search engines into hotel distribution channels. Cornell Hospitality Quarterly, 52(2), 200-208.
Park, K., Ha, J., & Park, J. Y. (2017). An Experimental Investigation on the Determinants of Online Hotel Booking Intention. Journal of Hospitality Marketing & Management, DOI: 10.1080/19368623.2017.1284631.
Radojevic, T., Stanisic, N., & Stanic, N. (2015). Ensuring positive feedback: Factors that influence customer satisfaction in the contemporary hospitality industry. Tourism Management, 51, 13-21.
Riasi, A., Schwartz, Z., Liu, X., & Li, S. (2017). Revenue Management and Length-of-Stay-Based Room Pricing. Cornell Hospitality Quarterly, DOI: 10.1177/1938965517704372.
Russell, S. J., & Norvig, P. (2002). Artificial intelligence: a modern approach (2nd Edition). Upper Saddle River: Prentice hall.
Sahin, S., & Baloglu, S. (2014). City branding: investigating a brand advocacy model for distinct segments. Journal of Hospitality Marketing & Management, 23(3), 239-265.
Sainaghi, R. (2010). Seasonality on hotel performance: the case of Milan. Anatolia, 21(1), 173-178.
Schuckert, M., Liu, X., & Law, R. (2015). Hospitality and tourism online reviews: Recent trends and future directions. Journal of Travel & Tourism Marketing, 32(5), 608-621.
Schwertman, N. C., Owens, M. A., & Adnan, R. (2004). A simple more general boxplot method for identifying outliers. Computational Statistics & Data Analysis, 47(1), 165-174.
26
Sun, S., Law, R., & Tse, T. (2016). Exploring price fluctuations across different online travel agencies: A case study of room reservations in an upscale hotel in Hong Kong. Journal of Vacation Marketing, 22(2), 167-178.
Tse, T. S. (2013). The marketing role of the internet in launching a hotel: the case of hotel ICON. Journal of Hospitality Marketing & Management, 22(8), 895-908.
Xu, X., & Li, Y. (2016). The antecedents of customer satisfaction and dissatisfaction toward various types of hotels: A text mining approach. International Journal of Hospitality Management, 55, 57-69.
Xu, X., Xiao, G., & Gursoy, D. (2017). Maximizing Profits Through Optimal Pricing and Sustainability Strategies: A Joint Optimization Approach. Journal of Hospitality Marketing & Management, 26(4), 395-415.
Yacouel, N., & Fleischer, A. (2012). The role of cybermediaries in reputation building and price premiums in the online hotel market. Journal of Travel Research, 51(2), 219-226.
Yang, Y., Pan, B., & Song, H. (2014). Predicting hotel demand using destination marketing organization’s web traffic data. Journal of Travel Research, 53(4), 433-447.
27
Tables
Table 1 – Comparison of TripAdvisor and Booking.com scores.
TripAdvisor score Booking.com Average Std.Dev. 3.0 7.43 0.44 3.5 7.80 0.35 4.0 8.33 0.31 4.5 8.95 0.28 5.0 9.24 0.32
Table 2 - Features collected.
Feature name Source Type Description
city --- Categorical City
hotel.name User Categorical Hotel name
stars Booking Numerical Stars in the hotel ranking system
outdoor.pool Booking Categorical If it has outdoor pool (yes/no)
indoor.pool Booking Categorical If it has indoor pool (yes/no)
spa Booking Categorical If it has SPA (yes/no)
free.park Booking Categorical If it has free park (yes/no)
free.wifi Booking Categorical If it has free wifi (yes/no)
late.checkout Booking Categorical If it allows late checkout (yes/no)
near.beach Booking Categorical If it is located near a beach (yes/no)
near.city.center Booking Categorical If it is located near city center (yes/no)
all.inclusive.option Booking Categorical If it has all inclusive option (yes/no)
day.reserv User Date Day when the reservation was made
stay.start.dt User Date Start of the period of stay
stay.finish.dt User Date End of the period of stay
stay.length User Numerical Length of stay in number of days
nr.adults User Numerical Number of adults booked
nr.children User Numerical Number of children (with 4 years old)
price Booking Numerical Lowest price available for the stay
nr.hits Google Numerical Number of hits when searching for the hotel name in
Google (within quotation)
nr.hits.hotel.plus.city Google Numerical Number of hits when searching for the string "hotels
<city name>" in Google
website Google Categorical If it has a website
website.booking Hotel
website
Categorical If its website (assuming it has one) allows online reservation
28
website.online.pay Hotel
website
Categorical If its website (assuming it has one) allows online payment
google.ads Google Categorical If the hotel appears in Google Ads (yes/no)
google.ads.link Google Categorical The page that the Google Ads links to: Hotel website;
Online travel agency; Others.
has.facebook Facebook Categorical If the hotel has a Facebook page
fb.official Facebook Categorical If it is an official Facebook page
fb.likes Facebook Numerical Number of likes in Facebook (0 if no Facebook page)
fb.stays Facebook Numerical Number of stays identified in Facebook (0 if no page)
fb.nr.reviews Facebook Numerical Number of reviews of the hotel in Facebook (0 if no
page)
fb.score Facebook Numerical Score of the hotel in Facebook
tripadvisor.nr.reviews TripAdvisor Numerical Number of reviews of the hotel in TripAdvisor
geo.type Booking Categorical {Urban; Resort; Others}
global.brand Booking Categorical If it is a global or an independent brand (yes/no)
service.level Booking Categorical {Word-class; Mid-range; Limited}
tripadvisor.score TripAdvisor Numerical Score of the hotel in TripAdvisor
Table 3 - Simulations discarded.
Nr. simulations
Discarded Reason
5603 1345 A significant portion of the simulations resulted in that there
was no room available for the hotel in the chosen period (since there was no price to be modeled, the rows were discarded)
4258 551 Some of the accommodation units were not hotels at all
(e.g., hostels), thus were not rated with the star system, which was considered highly influencial by Radojevic et al. (2015)
3707 489 Although Facebook is the most widely studied social
network concerning brand image, some hotels do not have yet a Facebook page.
3218 81 Most of the simulations encompassed a stay period of seven
or less days. Figure 2 enabledto identify outliers, which
were removed (Schwertman et al., 2004).
29
Table 4 - Features discarded.
Feature Reason
hotel.name Data was collected for 216 hotels, a too diverse number for being
useful for modeling
day.reserv Both of these features were used for computing the number of
days ahead of schedule stay.start.dt
stay.finish.dt This feature does not add information, as the dataset also contains
the length of stay
price The price collected represents all the days of the stay, while the
price to be modeled is the price per day, which was computed by dividing the price by the length of stay
google.ads This feature was removed considering every search resulted in at
least one advertisement, hence it was set to “Yes” for every case
has.facebook Since all simulations with hotels that did not have a Facebook
page were discarded, this feature turned useless
website Since most hotels have websites and allow online booking, these
features were removed, keeping only "website.online.pay", which is directly dependent on the remaining two.
website.booking
free.wifi Only 2.1% did not offer wifi; offering wifi is a trend which is
expected to increase in the future (Melián-González & Bulchand-Gidumal, 2016).
all.inclusive.option Only 2.73% of the hotels considered offered all inclusive option.
Table 5 - New features computed.
Feature name Type Description
reserv.days.ahead Numerical stay.start.dt - day.reserv (in days); See Table 1 for
details on the two features used for computing this one
season Categorical For the Northern Hemisphere, where Portugal is
located: Spring (21/March - 20/June); Summer (21/June - 20/September); Autumn (21/September - 20/December); Winter (21/December - 20/March) Note: for 150 cases of the dataset, the season changed during the stay; for these, it was considered the season for the start date
non.working.days Numerical Accounts for the total number of weekend days
(Saturdays and Sundays) and holidays during the length of stay
30
Table 6 - Features used for modeling.
Features
From Table 2 city, stars, outdoor.pool, indoor.pool, spa, free.park, late.checkout, near.beach,
near.city.center, stay.length, nr.adults, nr.children, nr.hits, nr.hits.hotel.plus.city, website.online.pay, google.ads, fb.official, fb.likes, fb.stays, fb.nr.reviews, fb.score, tripadvisor.nr.reviews, geo.type, global.brand, service.level, tripadvisor.score
From Table 5 reserv.days.ahead, season, non.working.days, price.per.day
Total 30
Table 7 - Model performance metrics.
Stages \ Metrics MAE MAPE
Modeling evaluation 14.32 € 12.70%
Knowledge extraction 11.42 € 10.64%
31
Table 8 - Individual relevance of each feature for modeling price.
# Feature Influencing group Relevance Total
1 hotel.avg.score.tripadvisor Social media 9.32%
2 nr.children Reservation 7.40%
3 city City 6.92%
4 stars Hotel 6.36%
5 nr.hits.hotel.plus.city Web visibility 6.31%
6 reserv.days.ahead Reservation 6.00%
7 stay.length Reservation 5.42%
8 website.online.pay Web visibility 4.17%
9 fb.score Social media 4.09%
10 global.brand Hotel 3.86% 59.84%
11 fb.likes Social media 3.75%
12 fb.stays Social media 3.29%
13 service.level Hotel 3.07%
14 near.beach Hotel 2.92%
15 google.ads Web visibility 2.60%
16 geo.type Hotel 2.55%
17 fb.nr.reviews Social media 2.54%
18 nr.hits Web visibility 2.28%
19 non.working.days Reservation 2.17%
20 season Reservation 2.10%
21 nr.reviews.tripadvisor Social media 1.93%
22 fb.official Social media 1.89%
23 nr.adults Reservation 1.88% 24 late.checkout Hotel 1.86% 25 near.city.center Hotel 1.61% 26 indoor.pool Hotel 1.23% 27 outdoor.pool Hotel 1.18% 28 spa Hotel 0.91% 29 free.park Hotel 0.42% 100.00%
32 Figures Dataset City List of cities · Hotel’s amenities · Hotel’s stars Simulation: · Nr. adults · Nr. children · Start date · Stay length PRICE City query Hotel query · Official page · Likes · Stays · Score · Nr. reviews · Score · Homepage · Google Ads
33
Figure 2 – Boxplot for the period of stay.
x
1x
2x
n...
n
1| f
an
m| f
a...
n
o| f
a w1,1 wm,1 w1,2 w1,n wm,2 wm,nInput
layer
Hidden
layer
Output
layer
34 1 -f o ld 2 -f o ld 3 -f o ld k -f o ld
..
.
..
.
A v er ag e p re d ic ti o n s fo r th e N R u n s F u ll d at as etModel performance metrics: MAE - Mean Absolute Error MAPE - Mean Absolute Percentage Error N Runs Modeling evaluation M o d el w it h al l d at a Model performance metrics: MAE; MAPE Data-based sensitivity analysis Relevance of features Influence of each feature on the outcome Knowledge extraction
Figure 4 - Data mining procedure.
Figure 5 - Relevance per influencing group of features.
Social media = 26.79% Hotel = 25.97% Reservation = 24.96% Web visibility = 15.36% City = 6.92%
35
Figure 6 - Influence of TripAdvisor score.
Figure 7 - Influence of the number of children. 50.00 75.00 100.00 125.00 150.00 175.00 200.00 3.0 3.5 4.0 4.5 5.0 P rice per da y ( in €) TripAdvisor score 101.60 € 127.97 € 171.24 € 0.00 25.00 50.00 75.00 100.00 125.00 150.00 175.00 0 1 2 P rice per da y ( in €) Number of children
36
Figure 8 - Influence of the city.
Figure 9 - Influence of the number of stars. 0.00 25.00 50.00 75.00 100.00 125.00 150.00 175.00 200.00 225.00 Av eir o B eja B rag a B rag an ça C ascais C astelo B ran co C o im b ra É v o ra Far o Fi g u eir a d a Fo z Gu ar d a Gu im ar ãe s L eir ia L is b o a Po rtaleg re Po rto San tar ém Set ú b al Si n tr a T o m ar Vian a d o C astelo Vil a R ea l Vis eu P rice per da y ( in €) City 50.00 75.00 100.00 125.00 150.00 175.00 200.00 2.0 2.5 3.0 3.5 4.0 4.5 5.0 P rice per da y ( in €) Number of stars
37
Figure 10 - Influence of city search hits.
Figure 11 - Influence of the days ahead of reservation. 50.00 75.00 100.00 125.00 150.00 175.00 200.00 225.00 250.00 275.00 300.00 325.00 350.00 0 10 20 30 40 50 P rice per da y ( in €)
Nr. hits of city search
Millions 100.00 125.00 150.00 175.00 200.00 0 50 100 150 200 250 300 P rice per da y ( in €)
38
Figure 12 - Influence of the length of stay.
Figure 13 - Influence of the hotel having a web site with online payment. 110.00 111.00 112.00 113.00 114.00 115.00 116.00 117.00 118.00 119.00 120.00 1 2 3 4 5 6 7 P rice per da y ( in €)
Stay length (in days)
1 1 5 .4 5 € 1 3 7 .2 7 € 100.00 110.00 120.00 130.00 140.00 150.00 No Yes P rice per da y ( in €)
39
Figure 14 - Influence of the hotel score in Facebook.
Figure 15 - Influence of being (Yes) or not (No) a global brand hotel. 100.00 110.00 120.00 130.00 140.00 150.00 3 4 5 P rice per da y ( in €)
Hotel score in Facebook
1 3 5 .6 0 € 1 0 6 .8 1 € 100.00 110.00 120.00 130.00 140.00 150.00 P rice per da y ( in €) No Yes