BJRS
RADIATION SCIENCES
07-02A (2019) 01-08ISSN: 2319-0612
Accept Submission 2018-10-31
Evaluation of the uncertainty associated with sample
holders in NAA measurements in LAN/IPEN
G. S. Zahn; R. B. Ticianelli; M. Saiki; F. A. Genezini
Instituto de Pesquisas Energéticas e Nucleares (IPEN-CNEN/SP) - Av. Professor Lineu Prestes 2242 05508-000 São Paulo, SP
ticianelli@ipen.br
ABSTRACT
In IPEN’s Neutron Activation Laboratory (LAN/IPEN), thin stainless steel sample holders are used for gamma spec-trometry in NAA measurements. This material is very practical, but its chemical composition may be troublesome, as it presents large amounts of elements with intermediate atomic number, with attenuation factors for low-energy gamma-rays that must not be neglected. In this study, count rates obtained using different sample holders were compared. To accomplish that, an Am-241 source, with 59-keV gamma emission, was used so that low-energy gamma attenuation differences can be determined. Moreover, in order to study the energy dependence of these differences, a Ho-166m source was also used. From these results, it was possible to analyze the experimental error associated to the variations between sample holders, with the aim of introducing an addictive term to the uncertainty analysis of comparative Neu-tron Activation Analysis results.
1. INTRODUCTION
In any analytical technique, the thorough analysis of the uncertainties is of paramount importance – in fact, the Guide to the Expression of Uncertainty in Measurement, for instance, states that “When reporting the result of a measurement of a physical quantity, it is obligatory that some quantitative indication of the quality of the result be given so that those who use it can assess its reliability” [JCGM, 2008]. Moreover, if the reported uncertainties are to precisely estimate the possible error in the results of a measurement, both the explicit and implicit sources of uncertainty must be carefully addressed.
1.1. Comparative Neutron Activation Analysis
Neutron Activation Analysis (NAA) is an analytical technique where a sample is irradiated with neutrons, and the radioactivity induced in the sample by capture reactions is used to determine its elemental composition. In order to greatly reduce the number of parameters needed for this deter-mination, the comparative version of NAA is often used, where the sample is irradiated together with a comparator with known concentration of the elements of interest – in this variation, the con-centration of a given element in the sample is simply given by:
(1)
where C are the concentrations, A the measured count rates, m the masses, Δt the time between measurements in the comparator and sample, and the decay constant of the radionuclide – the subscripts s and c refer to the sample and the comparator, respectively [LOVELAND, 2006].
In a previous paper [ZAHN, 2015], the authors have extensively studied the contribution of the ex-plicit terms in the equation to the final uncertainty; there are, however, possible contributions from experimental terms that are removed from the equation in the comparative analysis and assumed to be identical for the sample and the comparator, but are not necessarily so – this is the case of both the detection efficiency and the neutron flux. A rather thorough discussion on the sources of uncer-tainty in comparative NAA measurements can be found in [WEIZHI, 2001; GREENBERG, 2011]. In the specific case of the detection efficiency, one possible source of error is the presence of ab-sorbers between the source and the detector. In most laboratories, the activity of a given
radionu-clide in the sample is determined by counting the samples in a HPGe detector, where characteristic gamma-rays are quantified in a spectrum. In this case, the radioactive samples are usually mounted in sample holders, in order to give adequate physical support for different samples, as well as to avoid contamination of the detector and/or of the surroundings.
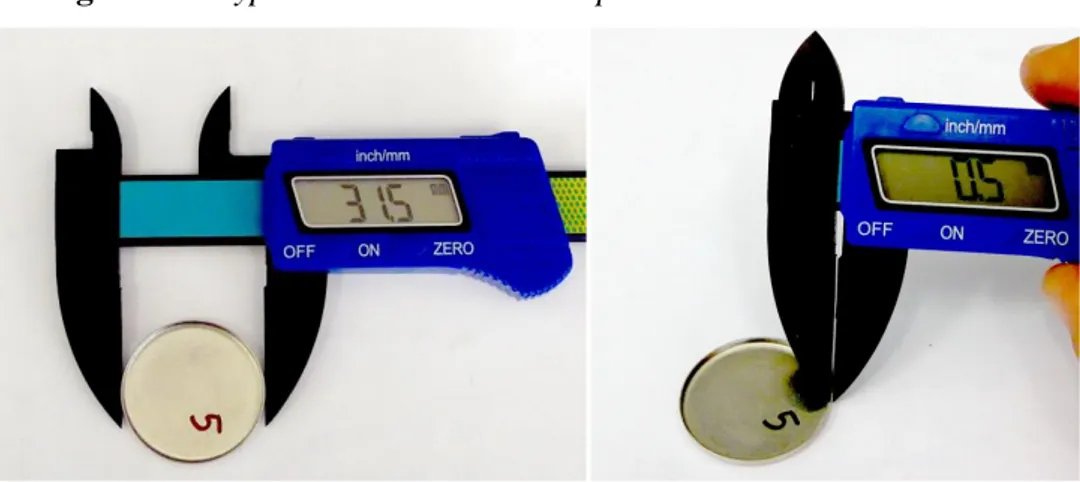
In the Neutron Activation Laboratory of IPEN-CNEN/SP (LAN), the samples are usually irradiated inside polyethylene bags, which are essentially transparent to gamma radiation of any energy. How-ever, as the bags themselves may become radioactive after the irradiation, the irradiated sample bags have to be then placed inside some container, to avoid contamination and seal the radioactive sample. The procedure, then, consists in placing the irradiated sample bags over a thin (~0.5mm thick) stainless steel disc, shown in Fig. 1, and then cover the sample with adhesive tape.
Figure 1: A typical stainless steel sample holder used in LAN-IPEN
As the samples are mounted over individual holders, these stainless steel discs actually stand be-tween the sample and the detector. This material is very practical, as it is chemically inert, washa-ble, and easy to reuse and decontaminate, if needed; moreover, it offers an extremely rigid base for samples, reducing the risk of mechanical issues. Nevertheless, its composition may be troublesome in terms of radiation transparency, as it presents large amounts of elements with intermediate atom-ic number, whatom-ich may attenuate low-energy gamma-rays. Therefore, it is possible that minimal dif-ferences in composition or thickness of the stainless steel discs may lead to difdif-ferences in gamma-ray attenuation, thus requiring an additional factor to be added in the uncertainty analysis of com-parative NAA measurements made using these sample holders.
In this work, an experimental assessment of the difference in gamma-ray attenuation was performed in a set of sample holders, and the standard deviation of the count rates observed within this set was used as an estimate of the uncertainty associated with the difference in radiation attenuation in sam-ple holders.
2. MATERIALS AND METHODS
In order to determine the variation in gamma-ray absorption of distinct sample holders, standard sources of 241Am (25 kBq) and 166mHo (40 kBq) were used. The sources were positioned in the cen-ter of the sample holder to be analyzed and then counted for 3600s (Live Time) in a 20% Canberra HPGe detector with a beryllium window; in order to account for possible experimental deviations, each measurement was performed in triplicate, with the source removed from the detector and repo-sitioned each time. Spectra were analyzed using Canberra’s Genie2000 software and the count rates observed for the different gamma-ray peaks using each sample holder were compared.
As the attenuation variations would be more noticeable for low-energy gamma-rays, initially six distinct sample holders, chosen randomly among the ones available for use in LAN, were analyzed using the 241Am source, which presents a very intense gamma-ray at 59.5 keV [LNHB, 2017]. After this, four of these sample holders (the two which presented the largest attenuation and the two which presented the lowest one) were selected, and the same analysis was repeated using the 166mHo source, which has plenty of gamma-ray transitions – the most important ones, used in this work, were at 80.6, 121.2, 184.4, 215.9, 259.7, 280.5, 300.7, 365.8, 411.0, 451.5, 529.8, 571.0, 670.5, 711.7, 752.3, 810.3, 830.6 and 951.0 keV [LNHB, 2017]. These results allowed studying the ener-gy dependence of the count rate variation, which in turn can be used to assess the differences in gamma-ray attenuation between sample holders.
3. RESULTS AND DISCUSSION
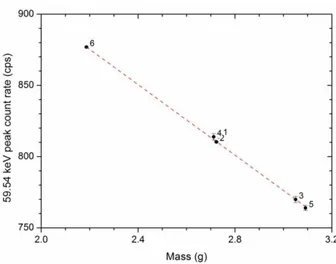
The average count rates observed for the 59.54keV peak from 241Am for each of the six sample holders are shown in Fig.2 as a function of the mass of the holder. It can be noticed that there is a
linear dependence of the attenuation to the mass – the mass difference may originate in the produc-tion process or may be caused by corrosion after successive cleaning processes; this result also sug-gests that the chemical composition of the sample holders in this test is very similar. The attenua-tion difference is absolutely relevant at this energy, with a 14% difference between the highest and lowest count rates observed. The average count rate was 80841 counts per second, resulting in a relative standard deviation of 5% for this dataset, which will be assumed to be a good estimate of the uncertainty associated with the differences in radiation attenuation among sample holders. As the usual uncertainties in Comparative NAA measurements are between 1-10%, this means that at this energy an additional uncertainty term would be definitely required.
Figure 2: Count rates observed for the 59.54 keV peak of 241Am for each of the sample
holders as a function of the holder’s mass; the points represent the average of three meas-urements, the error bars are the 1- standard deviations, and the numbers inside the figure
represent the holder identification number.
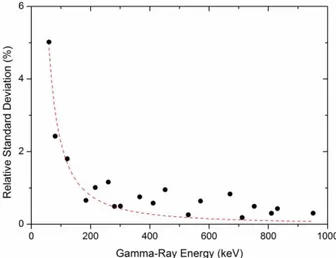
As most of the gamma transitions of interest for NAA are of much higher energy, this 5% variation is probably a worst case scenario. Thus, in order to check for the energy dependence of this varia-tion, sample holders numbered 1, 3, 5 and 6 were analyzed using the 166mHo source. The relative
standard deviation of the results obtained for the four holders at each energy was then assumed to represent an estimate of the uncertainty associated with the variation in gamma-ray attenuation among sample holders for that energy. The relative standard deviations obtained in both the
meas-urements with the 166mHo and the 241Am sources are shown in Fig.3 as a function of the gamma-ray energy; in this figure, the red dashed line represents the fit to the simplified attenuation function presented in Eq.2 [KNOLL, 2011], where E is the gamma-ray energy, in keV, and the proportionali-ty value (2235145) was determined in a least-squares fit to the experimental data.
𝑅𝑆𝐷 = (2235 ± 145) × 𝐸−3 2⁄ (2) These results indicate that the variation of the gamma-ray attenuation by the sample holders cannot be ignored in the uncertainty analysis of comparative NAA measurements, especially for energies below 300-400 keV. The actual value of this uncertainty can be determined by Eq.2, but a simple estimate can be made as follows:
• For energies below 150 keV, the additional uncertainty is very relevant, and should be precisely determined – at E~50 keV it is as large as 5%, for E~80 keV it is of approxi-mately 2.5%, and for E~120 keV it is 2%;
• For energies 150 and 400 keV, a 1% added uncertainty should cover the attenuation var-iation;
Above 400 keV, the uncertainty arising from the variation of the gamma-ray absorption in the sam-ple holders can be assumed as 0.5%.
Figure 3: Relative standard deviation observed in the measurements as a function of the
4. CONCLUSIONS
The variation in the gamma-ray attenuation in the stainless steel sample holders used in LAN-IPEN was shown not to be negligible, especially at energies below 400 keV. For low energies, the added uncertainty due to this variation can be as large as 5% (for 55 keV), decreasing rapidly to values between 1-2%. The addition of this source of uncertainty to the NAA measurement analysis shall improve the accuracy of the final results, improving the overall reliability of the NAA analyses made in LAN-IPEN.
REFERENCES
JCGM-Joint Committee for Guides in Metrology, JCGM 100:2008 - Evaluation of measurement data Guide to the expression of uncertainty in measurement, JCGM, 2008.
LOVELAND, W. D.; MORRISSEY, D. J.; SEABORG, G. T. Modern Nuclear Chemistry, Hobo-ken, , John Wiley & Sons, Inc, 2006.
ZAHN, G. S.; TICIANELLI, R. B.; LANGE, C. N.; FÁVARO, D. I. T.; FIGUEIREDO, A. M. G. Uncertainty Analysis in Comparative NAA Applied to Geological and Biological Matrices, In: IN-TERNATIONAL NUCLEAR ATLANTIC CONFERENCE, 2015, São Paulo. Annals… São Paulo: Comissão Nacional de Energia Nuclear, 2015.
WEIZHI, T.; BANGFA, N.; PINGSHENG, W.; LEI, C.; YANGMEI Z. Metrological role of neu-tron activation analysis. IA. Inherent characteristics of relative INAA as a primary ratio method of measurement, Accreditation and Quality Assurance, v. 6, p.488–492, 2001.
GREENBERG, R.; BODE, P.; DE NADAI FERNANDES, E. A. Neutron activation analysis: A primary method of measurement, Spectrochimica Acta Part B: Atomic Spectroscopy, v.66, p.193–241, 2011.
LNHB-Laboratoire National Henri Becquerel Table de Radionocléides, 2017 Available at: <http://www.nucleide.org/DDEP_WG/DDEPdata.htm>. Last accessed: 22-Nov-2017.