A Work Project, presented as part of the requirements for the Award of a Master Degree in Management from the NOVA – School of Business and Economics.
Analysis of a global strategic volume and
quantity planning process
A case study at Siemens Digital Factory, Control Products
Lisa Neidl, # 2684
A Project carried out on the Master Management Program, under the supervision of: Prof. José Crespo de Carvalho
I
Contents
Figures ... II Abstract ... III 1. Introduction ... 1 2. Research methodology ... 23. The case: Global strategic volume and quantity planning at Siemens DF CP ... 4
3.1. Process in the current project “Global strategic volume and quantity planning” ... 4
3.2. Purpose and importance of the project ... 7
4. Review of alternative approaches: theory and practical examples ... 8
4.1. Business process redesign ... 8
4.2. Specific literature on the forecasting process ... 8
4.2.1. Forecast accuracy ... 8
4.2.2. Forecast vs. plan vs. goal... 10
4.2.3. Other planning system constructs and process parameters ... 10
4.3. Practical examples ... 11
4.3.1. Quantity planning process at Siemens Digital Factory (DF), business unit Factory Automation (FA) ... 11
4.3.2. Quantity planning process at Siemens Energy Management (EM), business unit Low Voltage Products (LP) ... 13
4.3.3. Planning process at Leitax (case study)... 14
4.4. Aggregation of common parameters into a conceptual framework ... 15
5. Learnings for global strategic quantity and volume planning process at Siemens DF CP ... 17
5.1. Steps to better forecast accuracy ... 17
5.1.1. Cross-functional collaboration ... 17
5.1.2. Controlling ... 19
5.1.3. IT Tool ... 19
5.1.4. Suggestions for current process ... 20
5.2. Steps to postponed decisions ... 21
5.3. Advanced scenario analysis... 22
6. Conclusion ... 23 Reference list ... IV Appendices ... VI
II Figures
Figure 1: Product structure at Siemens DF CP ... 4
Figure 2: Planning constructs at Siemens DF CP... 5
Figure 3: Planning process at Siemens DF CP ... 5
Figure 4: Impact of time horizon on forecast accuracy ... 9
Figure 5: Planning constructs at Siemens DF FA ... 12
Figure 6: Planning constructs at Siemens EM PL ... 13
Figure 7: Planning constructs at Leitax ... 14
Figure 8: Factors shaping the forecasting process ... 16
Figure 9: Conceptual framework for a quantity planning process ... 16
III Abstract
The purpose of this paper is to analyze the global strategic quantity planning process in the busi-ness unit Control Products of the Digital Factory division (DF CP) at Siemens and to give rec-ommendations for improvement. Using a case study approach, a conceptual framework was developed. The research shows that a strategic quantity planning process must be designed spe-cifically depending on the business and the company. This leads to the conclusion that evaluating the accuracy constantly in order to learn about the business and to improve the process is crucial. Moreover, cross-functional collaboration has been identified as a main success factor.
1 1. Introduction
The purpose of this work is to analyze the current global strategic volume and quantity process within a Siemens Business Unit in order to give conceivable recommendations. The Siemens AG is divided into seven divisions which again are subdivided into business units. Refer to Appendix 1 for a more detailed overview of the Siemens organization. This paper focuses on the business unit Control Products (CP) as part of the Digital Factory division (DF) which manufactures prod-ucts and systems to switch, protect and control low voltage devices for industrial use. These are produced in eight main factories worldwide (China, Czech Republic, Turkey, Brazil, Mexico, India and two in Germany) in a serial and mass production process (DF CP Visitor Service, 2017). A map with all DF CP locations is presented in Appendix 2. The CP business is character-ized by a large number of different products (35.000 sold per year) and product generations as well as a high number of mainly anonymous B2B end customers (around 44.000); project busi-ness. Most of the products are produced on stock, some pseudo in stock (depending on order vol-ume and batch size) and only a few are made on order (Own research at DF CP).
Producing a high number of products worldwide and selling them in global markets requires a global strategic production planning which means preparing information and taking decisions on the production facility, the relocation of a certain production and the setup of manufacturing equipment among others. The importance of an accurate long-term forecast might be obvious looking at the consequences such as under- or over-dimensioned manufacturing equipment with impacts on loss and profit. An illustration in Appendix 3 underlines this with a graphical presen-tation. The company recognized the importance of these decisions; hence, the department GST (Global Setup Team) that was founded for strategic global footprint projects takes over the role of the global strategic quantity planner for all locations. The currently running project to support and
2
improve this process is accompanied by this thesis to cover the aspects “what and how do the others” and “what can we learn”. The importance of this paper can be justified by the impact of
the decisions that result from this planning process. Whereas a lot of theory on operational pro-duction planning can be found, extensive literature on strategic quantity planning is lacking. Thus, this paper contributes to an overall understanding of the important aspects of a long-term quantity planning process and identifies some crucial parameters.
Chapter two will briefly explain the research methodology and state the main research questions. Chapter three will illustrate the current global strategic volume and quantity planning process and emphasize the importance of the corresponding project. Alternative approaches will be discussed in chapter four before a new conceptual framework is presented. Chapter five will elaborate on conceivable adjustments that can be made to the current process. Finally, in chapter six the con-clusion will discuss the answers to the research questions, summarize the main key takeaways and give ideas for future research.
2. Research methodology
This chapter will justify the single-case study approach for this research. As mentioned before, there is little concrete theory in the area of strategic quantity planning. According to Eisenhardt (1989), a case study approach should be used in this case. Data, mainly collected through direct observations and open-ended discussions with people involved in the process, support this ap-proach (Yin, 2012). Other than proposed by Eisenhardt (1989), in this research, first the specific case, the global strategic volume and quantity planning process at Siemens DF CP MF GST, was known and from observing reality research questions have been elaborated. One goal of case studies is to develop generally valid theory (Eisenhardt, 1989 and Yin). It will become clear that
3
due to the very specific topic it is not recommended to consider the developed theory as generally valid, however, it could give companies an overview of important parameters in the quantity planning process and help them in the decision-making process. The timeframe of this work does not allow for the generation of robust quantitative data and a testing of the results. As outlined by Eisenhardt (1989), it is helpful to specify a priori some constructs and to compare emergent con-cepts with existing literature. Papke-Shields (1997) identifies in her research some planning sys-tem constructs in the strategic manufacturing process. These will be integrated into a more sophisticated framework for strategic volume and quantity planning processes. This framework contains the similarities with existing literature as well as the new process parameters.
After an extensive literature review and a better understanding of the planning process, three main research questions have been developed. First, how should the general structure of the pro-cess, e.g. the planning horizon and the granularity be designed? Second, how can the cross-functional collaboration be improved in the planning process? Third, how should the process steps be implemented in detail, e.g. the indication of a range or different methods depending on the life cycle phase? All three questions should be answered regarding the process at Siemens DF CP; thus, the result will not be generally valid for all organizations. The formulation of research questions as „how“ and „why“ questions as well as the focus on a contemporary real life situation
4
3. The case: Global strategic volume and quantity planning at Siemens DF CP
3.1. Process in the current project “Global strategic volume and quantity planning”
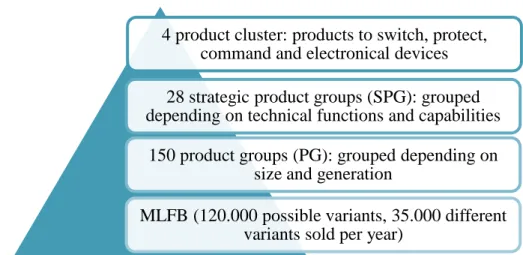
In this part the global strategic volume and quantity planning process as designed in the current project at CP will be presented. This process involves different functions within the business unit, namely business development, product management, local logistics and the strategic manufactur-ing plannmanufactur-ing (GST). The business unit is given a certain target from the division management and the responsibility of the business unit (BU) is to determine the product basket and the market strategy this goal to achieve. This target is an aggregated volume number without an indication of quantities which means that, at the end of the day, the detailed plan of the BU needs to equal the top-down target number from the division. At the bottom, the strategy and results of the quantity planning need to be aligned with decisions on capacity planning, safety stocks and strategic pro-curement. This shows that the strategic quantity planning process is an important step to align the operative production with the aggregated overall strategic goal. Before analyzing the process in detail, some background information on the product classification of the CP products is needed; to this end, the following pyramid shows the categories that are relevant in the planning process.
4 product cluster: products to switch, protect, command and electronical devices 28 strategic product groups (SPG): grouped depending on technical functions and capabilities
150 product groups (PG): grouped depending on size and generation
MLFB (120.000 possible variants, 35.000 different variants sold per year)
5
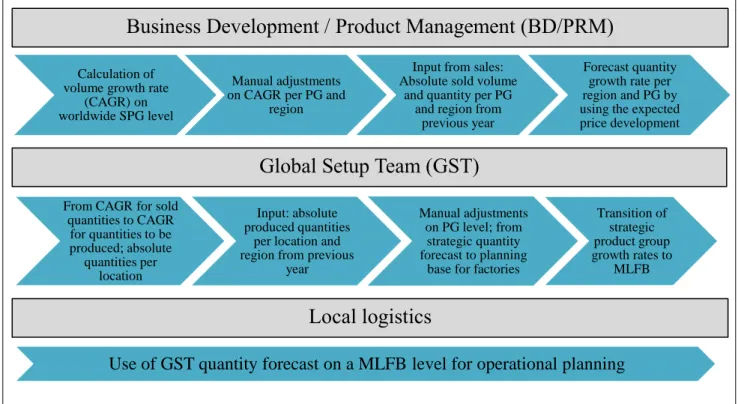
Usually all products within one product group are part of the same generation and show a very similar technical content. The exactly same products have the same MLFB which is similar to a serial number. Due to the lack of a standardized clear global planning process a new process is constructed within the project “Global strategic volume and quantity planning”. The following figure shows the process as contemplated in the project and gives an overview of the responsibili-ties of the involved functions.
Short term Long term
Horizon 2 years 5 years
Frequency Quarterly Yearly
Geographical
perspec-tive Regional
Regional
Product perspective MLFB Product group -> MLFB Cross-functional
collab-oration GST derives forecast from PRM growth rate by applying a realism factor Factors Sales & marketing information, projects, life cycle; historical quantities;
ex-pected global economic development Forecasted numbers Monthly Yearly
Figure 2: Planning constructs at Siemens DF CP, Source: Slides DF CP MF GST, 2017.
Figure 3: Planning process at Siemens DF CP, Source: Slides DF CP MF GST, 2017.
Local logistics
Global Setup Team (GST)
Use of GST quantity forecast on a MLFB level for operational planning
Calculation of volume growth rate
(CAGR) on worldwide SPG level
Manual adjustments on CAGR per PG and
region
Input from sales: Absolute sold volume
and quantity per PG and region from
previous year
Forecast quantity growth rate per region and PG by using the expected price development
From CAGR for sold quantities to CAGR for quantities to be produced; absolute quantities per location Input: absolute produced quantities
per location and region from previous
year
Manual adjustments on PG level; from strategic quantity forecast to planning
base for factories
Transition of strategic product group growth rates to
MLFB
Business Development / Product Management (BD/PRM)
6
PRM uses forecasted market growth rates from the business development to determine an ex-pected volume growth rate, the compound annual growth rate (CAGR) worldwide per SPG. This growth rate will automatically be transferred to the product groups and adjusted by manual changes on a regional and product group level if necessary. These adjustments consider factors such as regional development, effects from competitors, phase in and outs, special projects and marketing activities. The next step is to switch from volume growth rate to a quantity growth rate via the expected customer price development. Since in the past this growth rate, especially for the introduction of new products, was sometimes too high, the GST will apply a so called, commonly agreed “realism factor”. This is a percentage that decreases the forecasted growth rate by a
cer-tain rate with the intention of improving the forecast accuracy. GST will determine absolute numbers that need to be produced by the locations. The growth rate of the product group will be transferred automatically onto the MLFB so that the locations receive the forecasted quantities on a MLFB level; this also allows other users of the forecast to aggregate the quantities to the level they need which might be different to the product group or SPG groups used in the planning.
The planning is in the first step done in an excel spread sheet using macros and a data base pro-vides current and historical sales and production numbers to prove algorithms and usability. Ap-pendix 4 gives an overview of the IT construct showing where the use of macros is incorporated as well as the interface from sales to production. Depending on further demands (usability, multi usage ability, speed etc.) further investigation may follow towards an alternative IT platform.
At the time of writing this paper, the final decision regarding some planning parameters such as the planning method in a certain life cycle phase o hasn’t been taken yet. Therefore, chapter five5
will discuss some conceivable approaches to these topics. Now that the process has been ex-plained the importance of the project will be discussed.
7 3.2. Purpose and importance of the project
The motivation for this project is the current lack of a standardized quantity planning process that covers the needs of the CP business unit. The CP needs a long-term quantity forecast that is de-tailed and accurate enough to form the base for decisions such as the installation of new equip-ment. Since these decisions often involve high investments, consistent volume and quantity forecasts represent a fundamental data for cost optimized production. For instance, if the size of the lines better matches the real quantities the production is more cost effective than maintaining a manufacturing line that is able to produce many more units than needed (DF CP Slides, 2017).
The described process gives an idea of the involvement of different functions in the planning pro-cess. It will probably be a major task for some participants since it does not only include the quantity forecast but also a regular detailed reporting and evaluation. This is an essential step since generating relevant and robust data helps to achieve learning and process improvements in the long-term. However, the expected positive effects of the project justify clearly this effort.
It is expected that especially after some planning periods this process will increase the planning quality for an improved decision-making basis (DF CP Slides, 2017). One source and common platform for all strategic volume and quantity related inputs and outputs as well as for committed strategic volume targets to external and strategic internal budgets will be created. A clear defined and effort-optimized process with the likely role of GST as a coordinator between product man-agement and local logistics will help to improve the efficiency of the process.
The findings of both, Hughes (1985) and Moon et al (1998) affirm these internal reasons. For instance, Hughes (1985) asserts that better forecast accuracy leads to better decisions; if the new
8
process improves forecast accuracy, production will be more cost-optimized. Moon et al (1998) emphasize the importance and positive impact of accurate forecasts on the business.
This chapter illustrated the planning process within the CP project “Global strategic volume and quantity planning” and explained its significance. It pointed out that several parameters
character-ize this planning process such as the cross-functional coordination or the planning horizon and granularity that can be implemented in different ways. Thus, the next chapter will discuss alterna-tive approaches of such a planning process.
4. Review of alternative approaches: theory and practical examples 4.1. Business process redesign
Prior to the discussion of specific literature about the forecasting process, some basics about pro-cess redesign and improvement get presented briefly. Conger (2011) explains, that obviously, before thinking about improvements the “as is phase” must be drawn. In this paper, this is done
by illustrating the current forecasting process in chapter three. According to Kubeck (1995) the scope of the project influences the type of change: the more the change concerns the entire organ-ization the more radical is the change and the implementation challenging.
4.2. Specific literature on the forecasting process 4.2.1. Forecast accuracy
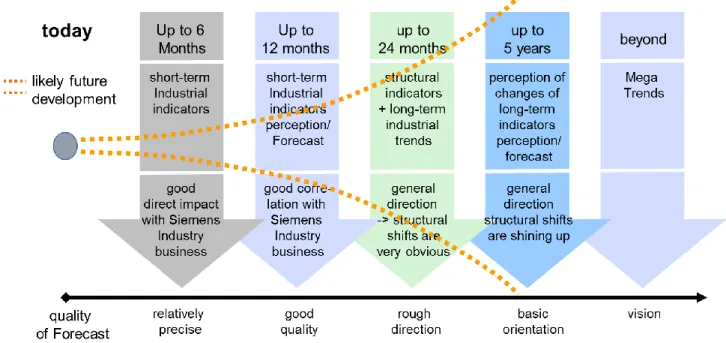
As mentioned in part 3.2, one objective of the current planning project is to improve forecast ac-curacy. However, this accuracy depends on various parameters. Hogarth (1981) emphasizes the inaccuracy of any long-term forecast. The following graph illustrates this phenomenon.
9
Figure 4: Impact of time horizon on forecast accuracy, Source: Gumann, 2017
Besides the time horizon, the granularity of the product cluster and the geographical perspective can affect the accuracy. It is important to bear in mind the uncertainty in every forecast. There-fore, Chopra (2016) suggests the calculation of a forecast error and its probability. He asserts that the observed demand is constituted by a systematic component of demand which should be fore-casted and a random component which should not be forefore-casted and which equals the forecast error. The forecast error can be calculated by using the mean squared error (MSE), the mean ab-solute deviation (MAD) or the mean abab-solute percentage error (MAPE). The detailed calculation can be found in the literature, for instance, in Chopra (2016).
Moreover, the life cycle may also have an impact on the accuracy of the forecast. It is more diffi-cult to estimate quantities for a new product than for a mature product. Stadtler et al (2002) depict two different methods to include the life cycle phase into the forecasting process: the life-cycle-management and the phasing method. The former “indexes the complete time-series and
10
for a specific period in the life-cycle” (Stadtler et al, 2002: 138-139). The latter divides the whole life cycle in three phases: phase in, a constant phase and phase out. Each phase is given a linear growth rate. In practice, however, a linear growth rate during phase in and out is very unlikely.
4.2.2. Forecast vs. plan vs. goal
Another important aspect and useful input for this work is to understand the differentiation be-tween forecast, plan and goal. A forecast has to be realistic and it should be useful for both, mar-keting and production (Fildes, 1992). According to Hughes (1985), sales goals should always be optimistic and higher than forecasts. For instance, IBM in Brazil derives its forecast from the goal, so first the goal is determined top-down and then the forecast is created bottom-up (Gonik, 1978). Whereas a goal should be optimistic and motivates staff, e.g., sales should be given goals to increase their selling ambition, a plan can be the reaction on a forecast, meaning that a plan determines how a forecast will be achieved (Vollmann et al, 1997).
4.2.3. Other planning system constructs and process parameters
Papke-Shields (1997) deliberates on several planning system constructs. The forecast horizon has already been discussed in the previous chapter. A rather important construct that should be well defined is the planning flow, meaning top-down vs. bottom-up. Moon et al (1998) suggest a combination of both since this fosters discussions and collaboration between the functions and, thus, forces the participants to rethink assumptions and decisions.
The planning formality determines the formality and structure of the process. It distinguishes between a very structured formal process with a written procedure and an informal non-systematic planning process. This applies for the reporting and evaluation of the forecast process
11
as well. The planning intensity and participation describe the frequency of interaction between the involved parties and the degree of communication (Papke-Shields, 1997).
Chopra (2016) identifies factors that influence demand such as the economic worldwide devel-opment, technological develdevel-opment, political constraints, currency exchange effects, interest rates and prices. Depending on the business some factors might have a stronger influence than others. Besides that, Chopra lists five important points for effective forecasting. Having these factors in mind when thinking about process improvement, this might lead to a better structure and under-standing. First, it is important to understand the objective of forecasting; at DF CP this is the gen-eration of a realistic forecast for the resource planning such as production equipment. Second, he stresses the increasing importance of an integrated demand planning throughout the supply chain. Other aspects are the identification of major factors that influence the own business and the selec-tion of an appropriate level of aggregaselec-tion. Lastly, establishing performance and error measures supports a continuous improvement process and better forecast accuracy in the long term.
This section has introduced some theoretical constructs that help in the analysis of the process and give ideas for the recommendations. Since practice mostly differs from theory the next part looks at some practical examples within and outside Siemens.
4.3. Practical examples
4.3.1. Quantity planning process at Siemens Digital Factory (DF), business unit Factory Automation (FA)
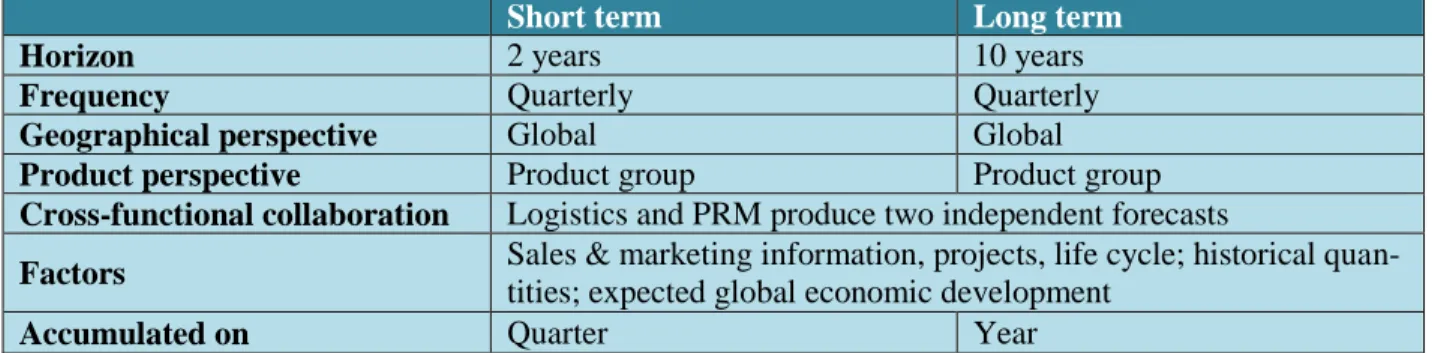
The first practical example illustrates the quantity planning process for the Digital Factory (DF) division, business unit Factory Automation (FA). The following table provides an overview of the planning constructs.
12
Figure 5: Planning constructs at Siemens DF FA, Source: Presentation at DF FA
The forecast combines the short and long-term using models and experience from the past to ex-trapolate the future. Restricting the responsibility to forecast on a very experienced and stable group of people assures continuity and reliability. Nevertheless, the sales plan lies usually above the expected economic development; therefore, logistics applies rather conservative numbers in order to avoid over-dimensioned stocks and equipment capacities. Some products always tend to lie significantly above or below the expected growth. This knowledge will be incorporated in the
forecast as well.
Similar to DF CP, the sales forecast at DF FA reflects the market view and differs from the forecast for production. However, logistics at DF FA bases its forecast on historical quantities whereas DF CP calculates quantity growth rates from forecasted volume growth rates. However, it is important to point out some differences in the business. The DF FA forecasts primarily for two plants, in Amberg and Chengdu, whereas the DF CP is responsible for seven plants. Besides that, DF FA is a global market leader. The forecasting process at DF FA has been implemented for many years and an automated daily reporting supports the evaluation of the planning quality; hence, DF FA benefits from many years of learning and generation of relevant, robust historical data.
Short term Long term
Horizon 2 years 10 years
Frequency Quarterly Quarterly
Geographical perspective Global Global
Product perspective Product group Product group Cross-functional collaboration Logistics and PRM produce two independent forecasts
Factors Sales & marketing information, projects, life cycle; historical quan-tities; expected global economic development
13
4.3.2. Quantity planning process at Siemens Energy Management (EM), business unit Low Voltage Products (LP)
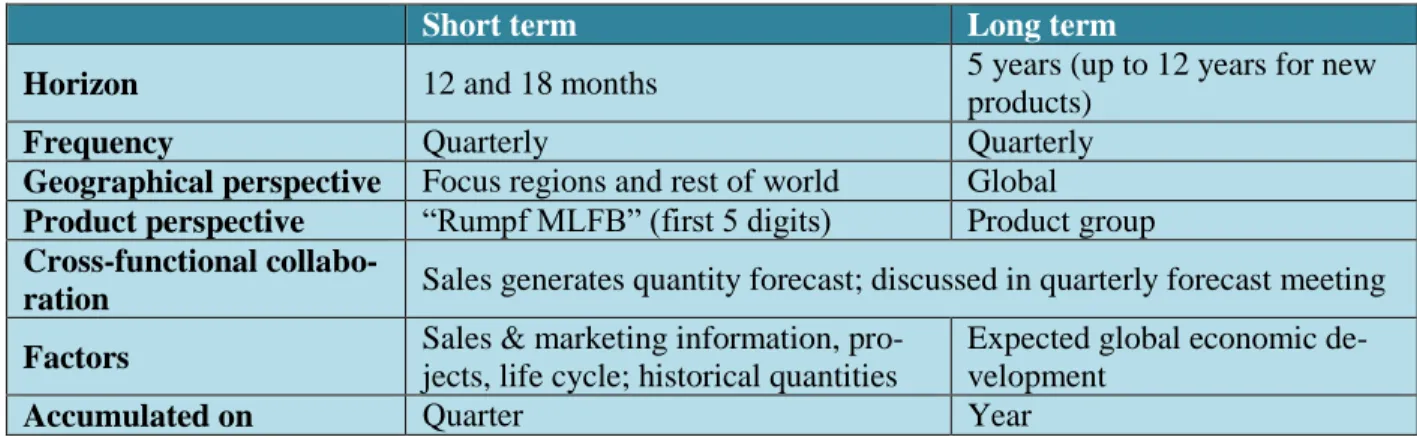
The planning process at the EM LP can be used as an interesting example of improved cross-functional collaboration. Their planning process for category A products (phase in and outs, im-portant products with volatile demand) is different from the planning for category B products (mature products with stable demand). Since a strategic quantity planning process for category A products is more sophisticated, the following table concentrates on this process. Category B products are normally planned worldwide and on a product group level. The forecasts for catego-ry A products are made centrally whereas categocatego-ry B products are forecasted in the plants.
The process begins with a sales forecast that is derived from a given target volume from the BU management. Sales develops a quantity forecast for focus regions (80% of entire worldwide vol-ume) and the rest of the world (20%). PMI (Product development & manufacturing – Internation-al Operations) uses this forecast to determine the production quantities in the plants. In the forecast meeting the forecast is discussed by sales, PRM and PMI and at the end all agree on a final version that will be used for both, production and sales. There is one group of people that is responsible for the forecast meeting and the final numbers.
Short term Long term
Horizon 12 and 18 months 5 years (up to 12 years for new products)
Frequency Quarterly Quarterly
Geographical perspective Focus regions and rest of world Global Product perspective “Rumpf MLFB” (first 5 digits) Product group Cross-functional
collabo-ration Sales generates quantity forecast; discussed in quarterly forecast meeting Factors Sales & marketing information,
pro-jects, life cycle; historical quantities
Expected global economic de-velopment
Accumulated on Quarter Year
14
Both, DF FA and EM LP, start with quantities instead of volumes and combine the short- and long-term forecasting. EM LP might be better compared with DF CP since it also plans produc-tion for several plants worldwide. The current process at EM LP was only implemented two years ago; at the beginning, convincing sales to generate quantity forecasts was a challenge, however, today both functions are content with the process and the cross-functional collaboration.
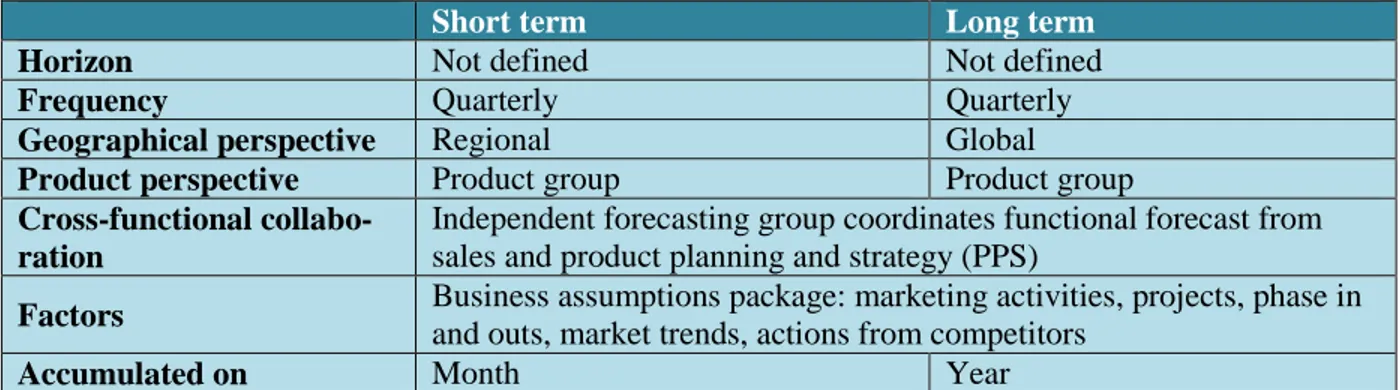
4.3.3. Planning process at Leitax (case study)
The last practical example illustrates a case study that worked on the planning process of an American manufacturer. Since the new process helped to improve forecast accuracy and cross-functional collaboration this example is considered here. The study implements a combined short and long-term forecast. The research team applied a process perspective, meaning that despite different incentives among the functions they reached integration by designing new processes.
The company set up an independent demand management organization (DMO) that is responsible for a consensus forecast meeting as well as the forecast quality control and the generation of a purely statistical forecast that is based on historical numbers. At the beginning of the planning process the business assumptions package (BAP) is agreed on by all involved functions. The fol-lowing table gives an overview of the main planning constructs.
Short term Long term
Horizon Not defined Not defined
Frequency Quarterly Quarterly
Geographical perspective Regional Global Product perspective Product group Product group Cross-functional
collabo-ration
Independent forecasting group coordinates functional forecast from sales and product planning and strategy (PPS)
Factors Business assumptions package: marketing activities, projects, phase in and outs, market trends, actions from competitors
Accumulated on Month Year
15
PPS develops a top-down forecast on a regional and product group level whereas sales elaborates a bottom-up forecast using the input from regional managers. DMO prepares a purely statistical forecast based on historical data that is used for comparison with the two functional forecasts. In case of significant deviations, the functions are asked to justify their assumptions and numbers. All three forecasts are combined to one consensus forecast through a mathematical process that gives more weight to the sales forecast in the short term and more weight to the PPS in the long-term; over the years they understood that the sales forecast is more accurate in the short term and the PPS in the long-term. The consensus meeting is also used to discuss specific topics such as phase in and outs, promotions or special projects. Moreover, the forecast quality is evaluated and DMO uses the results to improve algorithms and process steps. Besides better accuracy, the par-ticipants report more commitment and feel more responsible for the forecasting results.
Having said this, it must be mentioned that this study examined a consumer electronics firm sell-ing products with a life cycle of about fifteen months. The PPS is comparable to PRM at DF CP since it is responsible for all aspects of the life cycle. At Leitax, this function is responsible for a realistic forecast for production. Despite different business characteristics the process is interest-ing and other literature affirms the quality combined bottom-up and top-down forecasts. This approach enhances discussion of assumptions which may lead to better thought-out forecasts.
4.4. Aggregation of common parameters into a conceptual framework
Both, the theoretical approaches and the practical examples helped to identify some common parameters that shape the forecasting process and that can be implemented in different ways in practice. After an extensive research, it soon became clear that the strategic quantity planning is
16
very specific depending on the organization and there is no generally valid approach for all busi-nesses. Thus, the following matrix tries to capture the factors that affect this process.
Factors shaping the forecasting process
Type of production Mass, serial, single item Addressed markets International vs. national Number of plants One vs. many
Planning policy Centralized vs. decentralized
Distribution channels Directly to end customer, via warehouse, via wholesaler Product Life Cycle Short, medium vs. long (e.g. 8 months, 3 years, 20 years) Production policy Make to order, make to stock
Type of product Core vs. non-core
Number of customers Few vs. many (anonymous)
Figure 8: Factors shaping the forecasting process, Source: own research
The following framework is an extension to the Papke-Shields (1997) work that only considers constructs such as the horizon but no detailed process steps. It can be used as a supportive tool in the decision-making process in the implementation or redesign phase of a forecasting process.
Level 1: Planning constructs
Horizon Short-, medium-, long term (up to 2 years, 2-5 years, more than 5 years) Frequency Monthly, quarterly, semiyearly, yearly
Granularity Periods (weeks, months, quarters, years), product perspective (cluster, group, serial numbers), geographical perspective (countries, regions, global)
Flow Bottom-up vs. top-down
Formality Formal (written procedure, official documents) vs. informal procedure
Level 2: Cross-functional collaboration
Functions involved Sales, product management, business development, strategic manufacturing planning, operational logistics
Responsibility / ac-countability
A certain function, an independent planning department, cross-functional forecasting group, higher management
Alignment Target vs. process driven
Level 3: Process parameters
Units Volume vs. quantity
Forecast quality Mean squared error (MSE), mean absolute deviation (MAD), mean absolute percentage error (MAPE)
Life Cycle Phases Phase in and out, constant / mature phase: different ranges, phasing method Range & probabilities Best, worst, base case; with / without reasoning; add probability to each case Use of historical data Monthly, quarterly, yearly growth rates; period to be use
Controlling Granularity levels; responsibility; frequency
17
This chapter did not only present relevant theory but it also discussed three other practical exam-ples. The new findings were combined in a more sophisticated conceptual framework than exist-ing theory and will support the recommendations and learnexist-ings in the next section.
5. Learnings for global strategic quantity and volume planning process at Siemens DF CP
This paper addresses the objective of DF CP to improve forecast accuracy with the main goal of making better strategic decisions. Better forecast accuracy can be reached either by improving the influencing parameters or by shortening the forecast horizon, e.g. by shortening delivery times of equipment or material. Since the research questions look at the forecasting process the recom-mendations relate mainly to them, but two other brief aspects that might lead to improved deci-sion-making will be added to complement this work.
5.1. Steps to better forecast accuracy 5.1.1. Cross-functional collaboration
Not only theory but also experts in the field highlight the importance of cross-functional collabo-ration in the planning process. Due to different functional goals and incentives this poses a chal-lenge in many organizations. Thus, the following section provides some learnings from other practical cases that could be implemented at Siemens DF CP.
5.1.1.1. Creation of independent forecasting group
Both, literature (e.g. Moon et al, 1998) and other practical examples, e.g. the Leitax Case, suggest the creation of an independent forecasting group that is responsible for the coordination of the forecasting process. This approach should help to optimize cross-functional collaboration (Moon et al, 1998). An independent group at DF CP could make sure that the opinions of different
func-18
tions such as sales, product management, business development and manufacturing are consid-ered equally to avoid political influences. GST seems to take this role to some extent since it is currently responsible for the mapping and creation of the new process. However, it is rather a manufacturing function than a completely independent group with all different point of views. The forecasting group should have an overview of the entire product portfolio in order to better benefit from learnings. Therefore, at DF CP a group with employees from sales, product man-agement, business development and manufacturing that is responsible for the coordination of the forecasting process could be established in the medium or long term.
5.1.1.2. Cultural and managerial aspects
Managerial and cultural influences should foster the cross-functional collaboration. When im-plementing a new forecasting process, training for forecasters and users increases efficiency and ensures the correct use of the tool (Moon, 1998). It can also serve to deepen the understanding of the importance of a forecast for both, sales and production side. This is prerequisite for the crea-tion of incentives and bonuses that reward not only sold volume and EBIT but also forecast accu-racy. In this regard, the objectives-forecast-actual method (OFA) is presented shortly (Gonik, 1978). First, IBM used this method in Brazil, aiming for a better accuracy of the sales forecast without undermining the importance of selling high volumes. A matrix determines the bonuses for sold volume and for forecast accuracy. Refer to Appendix 5 for a detailed understanding of the calculation). Sales employees showed more commitment in the forecasting process and were eager to improve their accuracy (Gonik, 1978). However, it is not clear which time horizon was used. Since long term forecasts are never accurate, (Hogarth, 1981) it is suggested to apply rang-es to keep up the possibility of the highrang-est bonus for a good accuracy within the defined range. This method could be used for PRM in the current process since they would not only be
meas-19
ured on EBIT. In case an independent forecasting group is established, this group should be re-warded for good forecast quality but not be penalized.
5.1.2. Controlling
An essential part of the forecasting process is a continuous controlling process of the forecast quality to identify patterns and errors and adjust methods or single process steps accordingly. The forecast should record the forecasted quantity on each level, e.g. the global quantity on the SPG level or the quantity for a single product group in a certain region. The controlling process needs real data to generate deviations. This process could help to learn more about the factors that in-fluence the business. The evaluation might also contribute to an improved estimation of factor that translates the sales forecast into a production plan. Having said this, one should never jump to conclusions. A statistical correlation or deviation can be used as a sign for a possible causal relation but it should never be considered as one without a deep analysis since external, unknown factors or coincidences can also cause statistical deviations. Moreover, it is not only essential to compare real data with forecasted data but also to assess the forecast accuracy from year to year.
5.1.3. IT Tool
Especially the observations and discussions in the field allowed for some important insights into the importance of a well-functioning, user friendly IT tool without many interfaces. The tool should be flexible and changes should be easy to introduce. Manual transfers from one tool into another should be avoided because each manual transfer bears an error potential. Since the evalu-ation should measure the forecast quality on different levels it is recommended to generate auto-matically absolute quantities when adjusting the growth rate. These quantities can then be compared to the real data. The reporting should be generated automatically which means that
20
ideally, forecasted quantities and real quantities should be in the same IT tool or the tool generat-ing the report can easily extract data from the relevant tools.
5.1.4. Suggestions for current process
Since discussions in the field showed that a common forecast for the sales and the production side would not make sense for DF CP, this process distinguishes between a sales forecast and a production plan. The highlighted process steps indicate changes compared to the current process.
Determine CAGR on global SPG level G S T P R M G r o u p PRM + GST: Record busi-ness assump-tions in excel or IT tool, acces-sible by all involved func-tions Final agreement on assumptions; continuous monitoring of assumptions and adjust
fore-cast if needed
Compare aggre-gated CAGR with
CAGR per SPG
Discuss devia-tions; agree on
final numbers
Via expected customer price development to CAGR for quantities
Indication of rang-es and corrrang-espond- correspond-ing probabilities Statistical fore-cast Controlling process, year-ly; implement changes From CAGR per SPG to
CAGR per PG per region, record assumptions
Derive production plan from sales forecast and determine quantities on PG
level per location
PRM, GST and group: Consensus meeting: discuss both, sales and pro-duction view and compare with statis-tical fore-cast; final numbers released by group Rewards based on forecast qual-ity; no penal-ties
Figure 10: New proposed planning process at Siemens DF CP, Source: own research
START
21
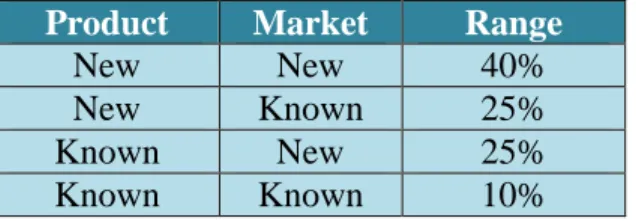
The aim of this approach is a well-defined and coordinated process between production and sales supported by an independent forecasting group. Even though currently GST takes over the coor-dinating role, an independent group containing different functions might strengthen the objec-tiveness. The additional use of a purely statistical forecast should put the judgmental forecast into question and lead to more accurate forecasts. Recording all assumptions at the beginning ensures the sharing of knowledge and if PRM records how they incorporate this information into their forecast GST can better assess these numbers and derive a more accurate production plan (Kraiselburd et al, 2007). Rewarding the forecasting group increases not only motivation but also the importance of the topic. This group could be composed by the equivalent department manag-ers or by one employee of each function. For new products, the following matrix with possible ranges could be used. The controlling will contribute to a better estimation of the ranges.
Product Market Range
New New 40%
New Known 25%
Known New 25%
Known Known 10%
Figure 11: Matrix for new products, Source: own illustration based on slides from DF CP
Ideally, PRM would add a probability curve to the range because this would help to better esti-mate the risk attached to the decision of a certain production equipment based on a forecasted number within the range (Kahn, 2014).
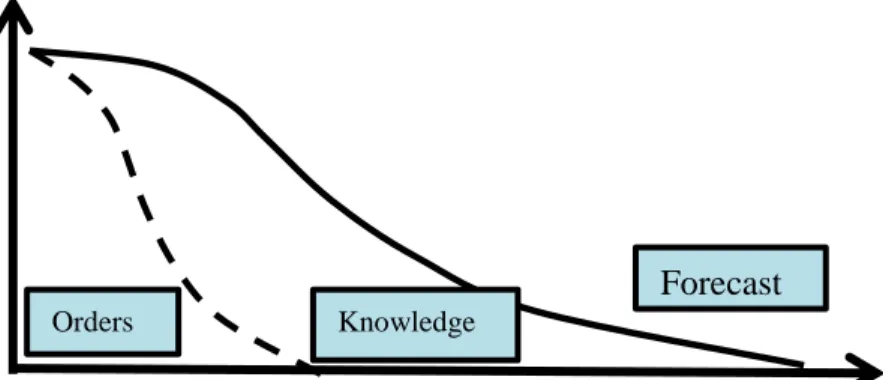
5.2. Steps to postponed decisions
As explained, the longer the time horizon the less accurate the forecast. Therefore, Vollmann et al (2005) suggest taking decisions as late as possible. For DF CP this means that despite a planning
22
horizon of five years decisions regarding the investment in new equipment, for instance, should be postponed as long as possible. The graph illustrates this idea of make-to-knowledge.
Figure 12: Make-to-knowledge concept, Source: own illustration based on Vollmann et al, 2005
Following the example of investment in new equipment, delivery lead times and installation times influence the timing of the order and thus, the decision. If, for instance, contracts and col-laboration with a supplier can be improved, a shorter delivery time might apply and thus, deci-sions can be taken later and based on more accurate numbers. The use of simulation software might help to shorten the testing phase and indicate possible problems early in the process. Be-sides that, a more flexible production system, for instance more flexible lines that can produce more than one product group, could have a positive impact. Regardless the structure of the plan-ning process, this aspect should always be scrutinized when taking important decisions.
5.3. Advanced scenario analysis
The third aspect that could contribute to better decisions is a more sophisticated use of scenario analysis including the calculation of risks and the development of adequate countermeasures. Since the extent of this work does not allow for a detailed analysis of the current situation in this regard, this section only aims for underlining the importance of such mechanisms. As outlined earlier, the investment decision for new equipment poses often a challenge. A detailed calculation
Forecast
23
of various scenarios with assumptions about the sold quantity provides a good base for the devel-opment of risk mitigation strategies. For instance, a calculation might show the amount of lost sales when installing under-dimensioned equipment for an expected quantity forecast. However, other short- or medium term strategies can be implemented, such as parallel production or run-ning more shifts to cover the demand. If the calculation shows that this is less costly than in-stalling over-dimensioned equipment the production plan and risk mitigation strategies should be aligned with the forecast and the different scenarios.
This chapter discussed conceivable changes to the current situation and presented a new proposed process. This process contains the creation of an independent forecasting group which is respon-sible for the coordination and the controlling process.
6. Conclusion
Siemens DF CP is seeking to optimize the strategic quantity forecast to guarantee better long term planning decisions. To this end, a current project at Siemens DF CP which is accompanied by this thesis tries to provide the necessary tools. This paper outlines a theoretical framework and presents recommendations that could be tested in practice. Before drawing a final conclusion the answers to the three research questions will be discussed.
The first question investigated about the planning constructs such as the granularity. The horizon of five years should be applied in order to have an idea of the future; however, decisions should rather be based on the forecast of the next two years. The mentioned make-to-knowledge steps should support this measure. Instead of a yearly planning frequency a semi-annually planning (or even event-driven) might generate more reliability and acceptance of data for operational plan-ning tasks.
24
The second research question looked at an improved cross-functional collaboration. This will be reached by the creation of an independent cross-functional forecasting group that is responsible for the coordination and considers the opinions of all functions equally. This group will be ac-countable for the final numbers and will be rewarded depending on the forecast quality. Current-ly, GST takes the coordinating role but a cross-functional group might be more objective than GST being a manufacturing function and hence, representing the production side.
The third research question examined the detailed process steps. The work in the field showed that ideas such as integrating regional sales into the forecasting process, basing the forecast on quantities instead of volumes or aiming for one final forecast number for sales and production would not deliver the desired improvements in practice in this case. Thus, a comparison of top-down (SPG) and bottom-up (aggregation of broken-top-down numbers) numbers as well as a com-parison of the judgmental forecast with a purely statistical forecast should contribute to a better thought out forecast. A forecast meeting integrating representatives of all involved functions and the independent forecasting group should ensure well-coordinated numbers. The indication of ranges and probabilities in the PRM forecast depending on the product life cycle should provide a better base for GST to decide on which numbers to base the equipment planning. A regularly controlling process provides the forecasting group with data that is necessary to improve the forecasting method and to learn about factors that influence the business.
These answers refer to the case at Siemens DF CP and should not be used generally by any other organization. The strategic forecasting process should be designed specific to the organization and business; thus, one must find over time which process satisfies best the requirements. One of the main learnings of this research is that cross-functional collaboration is considered one of the most important success factors, not only from theorists but also from participants. Even though a
25
smooth forecasting process is launched, especially a long-term forecast will never be accurate; nevertheless, improved forecast accuracy can lead to better decisions. It is crucial for DF CP to consider the planning process as a learning process. The current approach at DF CP contains al-ready important aspects such as the participation of different functions and the integration of judgmental factors. However, the aim is to improve the process continuously and to adjust it ac-cording to the learnings over time. For this process, the impact of the ideas and learnings of this work can be analyzed and suitable measures implemented in practice.
Having said this, the limitations in this work cannot be neglected. First, the given recommenda-tions have not been tested in practice and thus, they only represent conceivable changes but do not guarantee for better forecasting results. Second, the theoretical frameworks provide an over-view, but each company should bear in mind that this process needs to be designed very specific to its requirements. And lastly, despite a careful research, it is possible that due to the limited timeframe as well as the size and hierarchies of the company some aspects within the organiza-tion that influence the forecasting process haven’t been discovered and considered in this work.
These limitations leave room for further research. Therefore, the effect of the recommendations and their practical implementation could be tested. Besides that, the feasibility of a collaborative planning throughout the supply chain at DF CP could be analyzed. And finally, the role of a changing global environment on the importance of forecasting and planning processes could be an interesting topic to elaborate on. Maybe this would confirm that the flexibility in a company becomes increasingly important since external factors do not allow for at least nearly accurate long-term forecasts.
IV Reference list
Chopra, Sunil, and Meindl, Peter. 2016. Supply Chain Management: Strategy, Planning, and
Operation. 6th ed. Harlow, Essex: Pearson Education Limited.
DF CP Visitor Service. 2017. “Welcome to Siemens Location Amberg”. Siemens Intranet, Re-trieved 30.01.2017
Eisenhardt, Kathleen M. 1989. “Building Theories from Case Study Research“. Academy of Management Review, 14 (4): 532-550.
EM LP PMI IO. 2015. “Forecast process PMI products”. Slides presented at meeting 20.03.2017 in Regensburg.
Fildes, Robert, and Beard, Charles. 2011. “Forecasting systems for production and inventory control.” In Forecasting 5th
ed., ed. Fildes, Robert, and Allen, Geoffrey P., 19-43. London: SAGE Publications Ltd.
Gonik, Jacob. 1978. “Tie salesmen’s bonuses to their forecast”. Harvard Business Review. No. 78305
Gumann, Alexander. 2017. “Business Cycle Analysis and Forecasting”. Slides presented at meeting 06.02.2017 in Amberg.
Hogarth, Robin M., and Makridakis, Spyros. 1981. “Forecasting and planning: an evaluation.” In Forecasting 5th ed., ed. Fildes, Robert, and Allen, Geoffrey P., 367-395. London: SAGE Pub-lications Ltd.
Hughes, David G. 1985. “Sales forecasting requirements.” In The handbook of forecasting: A
manager’s guide. 2nd
ed., ed. Makridakis, Spyros and Wheelwright, Steven C., 17-33. New York: John Wiley & Sons, Inc.
Kahn, Kenneth B., 2014. “Solving the problems of new product forecasting”. :Business Horizon / Elsevier, 57: 607-615.
Kraiselburd, Santiago, and Watson, Noel. 2007. “Alignment in cross-functional and cross-firm supply chain planning.” Harvard Business School.
Moon, Mark A., Mentzer, John D., Smith, Carlo D. and Garver, Michael S. 1998. “Seven keys to better forecasting”. Business Horizons
Oliva, Rogelio, and Watson, Noel H. 2009. “Cross-functional alignment in supply chain plan-ning: A case study of sales and operations planning”. Harvard Business School.
Papke-Shields, Karen E. 1997. “Strategic manufacturing planning: examining the relationship between planning system design, manufacturing context, and planning effectiveness.” PhD diss. University of South Carolina.
V
Stadtler, Helmut, and Kilger, Christoph. 2002. Supply Chain Management and Advanced Planning: Concepts, Models, Software and Case Studies. 2nd ed. Heidelberg: Springer Verlag. Vollmann, Thomas E., Berry, William L., Whybark, Clay D., and Jacobs, Robert F. 2005. “Manufacturing Planning and Control for Supply Chain Management”. 5th
ed. New York: The McGraw-Hill Companies, Inc.
Weinstein, David. 1985. “Forecasting for industrial products.” In The handbook of forecasting:
A manager’s guide. 2nd
ed., ed. Makridakis, Spyros and Wheelwright, Steven C., 450-467. New York: John Wiley & Sons, Inc.
Yin, Robert K. 2014. Case study research: design and methods. 5th ed. Thousand Oaks, Califor-nia: SAGE Publications, Inc.
Yin, Robert K. 2012. Applications of case study research. 3rd ed. Thousand Oaks, California: SAGE Publications, Inc.
VI Appendices
Appendix 1: Organizational chart
Source: Own illustration based on Siemens Intranet, 2017.
Appendix 2: Map DF CP manufacturing sites
Source: DF CP Visitor Service, 2017.
Siemens AG
Building Technologies Energy Management Power and Gas Digital Factory Motion Control Control Products Factory Automation Product Lifecycle Customer Services DF & PDHealthcare Financial Services Wind Power Mobility
Process Industries &
VII Appendix 3: Under and over investment challenge
Source: Own illustration, 2017.
Appendix 4: Overview IT model
Source: Own illustration based on Siemens DF CP Slides, 2017.
Production View
User Inter-face Data BaseSave data Generate data
Macro Sales View User Inter-face Data Base Show data Save data Daten er-zeugen Macro Macro Macro
Input from BA Dash: - Current revenues and quantities per product group and region
Data import
Administration by BD/PRM: - Growth rate on SPG level - Adjustments for regions and product groups
Manually
Mana-ge data Manually
Input for manufacturing locations:
- Current quantities per MLFB - Sales markets Managa data Administration by GST: - „Realism rate“
- Adjustments for locations
manuell
Daten pfle-gen
Genera-te data Genera-te data Macro
Matching list MLFB with product group
Use of data Q u a n t i t i e s Time horizon Production equipment according to forecast Real quantity Real quantity Underinvestment Overinvestment User Inter ter-face Macro Show data Data import Generate data
VIII Appendix 5: Objectives-Forecast-Actual (OFA) matrix
F/O (Forecast divided by objective)
A/O x 100
(Actual results divided by objective, then multiplied by 100) 0 0,5 1,0 1,5 2,0 2,5 3,0 3,5 4,0 4,5 5,0 0 - - - - 50 30 60 30 - - - - 100 60 90 120 90 60 30 - - - - - 150 90 120 150 180 150 120 90 60 30 - - 200 120 150 180 210 240 210 180 150 120 90 60 250 150 180 210 240 270 300 270 240 210 180 150 300 180 210 240 270 300 330 360 330 300 270 240 350 210 240 270 300 330 360 390 420 390 360 330 400 240 270 300 330 360 390 420 450 480 450 420 450 270 300 330 360 390 420 450 480 510 540 510 500 300 330 360 390 420 450 480 510 540 570 600 Calculation of grid numbers: If F equal to A then OFA = 120xF/O If F smaller than A
then OFA = 60x(A+F)/O
If F bigger than A then OFA = 60x(3A-F)/O