COMPLEX PROJECTS’ MANAGEMENT USING EVA
– A CASE STUDY
PEDRO Maria I. (P), PEREIRA João (P), FILIPE José António (P), FERREIRA Manuel Alberto M. (P)
Abstract: Earned Value Analysis (EVA) is a method of measuring the project performance. Although the concept exists since the nineteen’s century and it has been in use since the 1960s, only now it is gaining considerable popularity. Those in favour will base their arguments in the cost savings from the project and the improved communication, analysis and control that come from its implementation. Those who have a different opinion will cite the limited benefit from its use and the effort to make it work. There is no doubt that these different opinions come from different experiences. Nevertheless, everybody agrees that EVA is a powerful tool if applied correctly. The aim of this work is to implement this tool to a project in concrete and to evaluate the use of EVA as a complementary tool of the system currently used – SAPE, in determining and controlling costs associated with the project, at every moment of the project. This allows to evaluate the possible deviations and to enable timely corrections.
Keywords: Integrated Management Systems, Project Control, ERP, SAPE, Information Systems, Earned Value Analysis.
1 Introduction
Nowadays, consumers are highly exigent. Therefore, companies make great efforts to meet these requirements trying to offer a consistently high level of service, regardless of the area where they operate. To accomplish this objective companies must have the internal capabilities to reach not only the purposes that their clients require but also an efficient level of operation, based on reduced costs.
To achieve the goals mentioned above, the consulting company IA1 is going to implement EVA (Earned Value Analysis) tool as a complement to the SAPE2 Software, already in use in the company. Such integration would increase the strengths of both tools in the company. This enables
1 The name of the company is not the real one, for confidentiality reasons.
2
IA to get a much more rigid control of its projects. In addition, the project manager will have better information to make his decisions. Consequently, as he will be better informed about the project development, failures can be detected earlier.
Considering this, this paper aims:
1) to get an overall view of the SAPE software, highlighting its main deficiencies, 2) to reach a close analysis to the EVA tool,
3) to propose the application of this model to a case study and
4) to make an analysis of the results and draw the inherent conclusions.
2 SAPE Software
Considering the competitive markets and global economy, companies feel the necessity to develop some vital characteristics in order to survive. For instance, the ability to obtain crucial information and the way to manage it are essential factors for the company. Enterprise Resource Planning (ERP) appeared in order to contribute to that.
SAPE main objective is to permit to companies to plan and to control their necessities through this kind of information systems. While in its early stages, ERP was used as a tool to manage operations, planning and controlling resources necessities. ERP was used to calculate the quantity of resources needed and the correct time to do so. It was used to evaluate the implications of the companies’ future demand on the financial areas, as well as to calculate the resources` necessities. Nowadays it is used as a corporative system that supports and assists every business area [1]. ERP is used in a larger way to cover all functional sectors of the company. Therefore, it is now considered a “global plan” and became a software that allows the existence of a unified information system and that connects all business areas. It has become a very agile application that improves the whole Business Process [2].
SAPE or SAP ERP is the main product of SAP AG, a German company and the leader of the corporative software market. Being a type of ERP, SAPE can be now defined as an integrated management transactional system that connects all sectors of a company [3]. SAPE is a very useful tool mostly because it allows a very high integration in the company. Several software can be removed, once SAPE causes a reduction of data inconsistencies. However, this integration can be seen as a disadvantage because it only considers one user to have an effect on all departments. Another disadvantage of this system is that it can be seen as an account tool and, therefore, the user of SAPE must have some knowledge about taxes and tributary legislation, otherwise he will not be prone to use this tool correctly. Besides, SAPE is seen as a way to reduce costs and this might be seen as a way to sack people. Finally, it is important to understand that most of SAPE disadvantages are psychological, meaning that a strong motivation campaign to the advantages of this tool might be necessary to motivate workers to believe in the system [4].
3 Earned Value Analysis
EVA is a tool that controls and evaluates a project`s performance based on its costs, deadlines and progress. Its methodology consists in comparing what has been done or obtained (earned value) with what really has been done and what should have been done. EVA is a control tool that permits
to evaluate simultaneously and quantitatively the costs and delays in a specific time. It also makes a prediction on how much money will be spent at the end of the project.
EVA is a strong methodology due to three main aspects: it is a uniform unit of measure, it is consistent and it is a basis for cost performance analysis. Being a uniform unit of measure, it permits to combine and to compare the progress of completely different tasks. As far as being a consistent method, EVA allows that everybody inputs the information on how they are doing and realise if they are on schedule and the percentage of work done. Finally, EVA is a basis for cost performance analysis because it measures the quantity of work done in a consistent way, and compare unit costs, unit. In other words, it allows the comparison between physical progress of a project and its costs by using the same unit of measure [5].
After the presentation of the conceptual fundaments that support EVA, it is necessary to define three main variables in order to successively implement this tool. The first is the Actual Cost of Work Performed (ACWP). This is the money that has been spent to complete a task or, if the task is not finished, the money that has been spent so far. The second variable is the Budgeted Cost of Work Performed (BCWP). For completed tasks, this is the budget in the original task plan, regardless of the money actually spent on completing it. For unfinished tasks, it is the task budget multiplied by the percentage of completion so far. This might be seen as the achieved progress because this is the earning value for the cost that a task was expected to incur. Finally, the third and last primarily variable is the Budgeted Cost of Work Scheduled (BCWS). This is the money that is expected to be spent on the work that is expected to be accomplished by now. This means that it doesn’t matter if the task is actually finished or on schedule. To do this, it is enough to look to the project plan and see what was planned to happen by now. For the project as a whole, these variables are the sum of all the ACWPs, BCWPs and BCWSs of all tasks. It is important to understand that these variables are functions of time. So, each time, EVA is used and these variables must be recalculated [6].
Considered the main variables for each task and for the project as a whole, earned value scores can be calculated. The first score is the Schedule Variance (SV):
SV = (BCWP – BCWS) / BCWS (1)
The SV compares the achieved progress with the planned progress and divides it by the scheduled progress. This provides the percentage of deviation from what was planned.
The next secondary variable is the Cost Variance (CV):
CV = (BCWP – ACWP) / BCWP (2)
The CV compares the actual cost to the planned cost for the work actually performed and divides it by the planned cost to provide us with the percentage of deviation from plan.
The Schedule Performance Index (SPI) is:
SPI = BCWP / BCWS (3)
It is interesting to understand this variable meaning by using an example. If SPI = 0.9 this means that 90% of the time predicted in the schedule was actually converted into work. Consequently, there is a 10% loss of time and the work is behind the schedule. A SPI greater than 1 means that works are better than scheduled.
CPI = BCWP / ACWP (4) Presenting an example once again, if CPI = 0.9 it means that for every 1€ consumed, only 0,9€ are actually being converted into final product. Therefore, there is an overspending. A CPI greater than 1 means a spending of less money than what was predicted.
Now, for calculating the variables that are more meaningful and that permit more explicit results, let’s begin to consider the variable Estimate at Completion (EAC):
EAC = ((BAC – BCWP) / CPI) + ACWP (5)
The BAC, or Budget at Completion, is what is planned to spend at the end of the project. So, the EAC provides the work that has not been finished (BAC – BCWP), dividing it by the CPI and adding the ACWP, which is considered a sunk cost.
Finally the Variation at Completion (VAC):
VAC = BAC – EAC (6)
It is easy to understand that this variable will show if one is spending more or less money than expected and will quantify it [7].
Although EVA is a powerful tool, its usage is not consensual. A survey was made to 400 professionals who worked in 180 projects and the results were that EVA was used by 41% of people but its value and popularity were very low. Trying to justify the low value proved by researchers, Thamhain [8] states that the little applicability, found as a result in the studies made, can be attributed to different barriers, either being internal or external.
To Wideman [9], a project of great importance requires a unit of planning and control with professionals capable of collecting the information and making the analysis of added value, making its applicability justifiable.
To Sparrow [10], the earned value analysis enables a supplementary value to the project because it offers a premature visibility of its results. So, it is possible to determine a tendency of costs and deadlines, while it is still possible to implement corrective actions.
On the contrary, West and McElroy [11] agree that EVA is an adequate tool for the generation of reports of work done, and not a managerial tool, since the control in real time of the project, using all parameters of analysis becomes unviable.
As can be seen, although it is consensual that EVA is a very powerful tool when applied correctly, even in the areas where it has been applied, it is still not very well defined [12].
According to Lukas [13], the top ten reasons why EVA does not work are: a) no documented requirements,
b) incomplete requirements, c) WBS not used or not accepted, d) WBS incomplete,
e) plan not integrated,
f) schedule and/or budget incorrect,
g) change management not used or ineffective, h) cost collection system inadequate,
i) incorrect progress and
Lukas [13] states that EVA is the most effective technique for providing information on project performance. It communicates scope, schedule and cost status information to project stakeholders. Properly used, earned value is a flexible process that provides timely information on the project “health”. Effective use of EVA concepts can provide a competitive advantage in successfully delivering projects. Lukas [13] also mentions that if you have prepared your project plan properly, earned value analysis takes no additional effort to implement. The key is having complete requirements and a good project plan.
4 Case Study
Now, let’s see how EVA works in a real life project. This project is called MSRCPF (“Monitoring System Radiation Coils Pyrolysis Furnace”) and the objective is to implement an online monitoring system to the pyrolysis furnace. This will allow the detection of malfunctions and reduction of their consequences. This project also seeks to develop non destructive control techniques that will permit to determine the degradation state of these equipments. Such techniques will be applied during the programmed stops to avoid service failures that normally lead to production loss.
The main results that this project intends to achieve are:
a) increasing from four to six years the life of the equipment,
b) getting a reduction by 25% of the opportunity and maintenance costs that come from un-programmed stops,
c) getting a reduction by 29% of the opportunity costs that come from programmed stops, d) getting a reduction of the systematic maintenance costs in 14%,
e) improving the availability of the equipment due to a reduction of the un-programmed stops and
f) getting a minimal energy consumption by doing a reduction in some operations.
As it is, the programmed stops have a cost of 813.600€ per year. This corresponds to a profit reduction of 520.000€ per day (opportunity cost). Looking at the equipment immobilization periods, this means that there is a loss of 3.094.000€ per year. Concerning the un-programmed stops, they have an opportunity cost of 2.080.000€ per year.
After a brief description of the project and after exposing the reasons for doing it, EVA can be put into action. Let`s assume a check point three months after the project begun. According to what was initially planned, the status of the project should be as shown in table1.
Tasks in Progress Predicted Completion
1.A - Furnace Hardware Implementation Studies 100%
1.B - Acquiring Systems, Storage and Data Transfer Studies 25%
1.C - Coquefication Model Studies 50%
Table 1: Percentage of completion after 3 months of work - Tasks and predicted percentage
Knowing this and knowing some internal information about the project, the amount that should have been spent on each task and consequently the amount in the project as a whole can be determined three months after it has started.
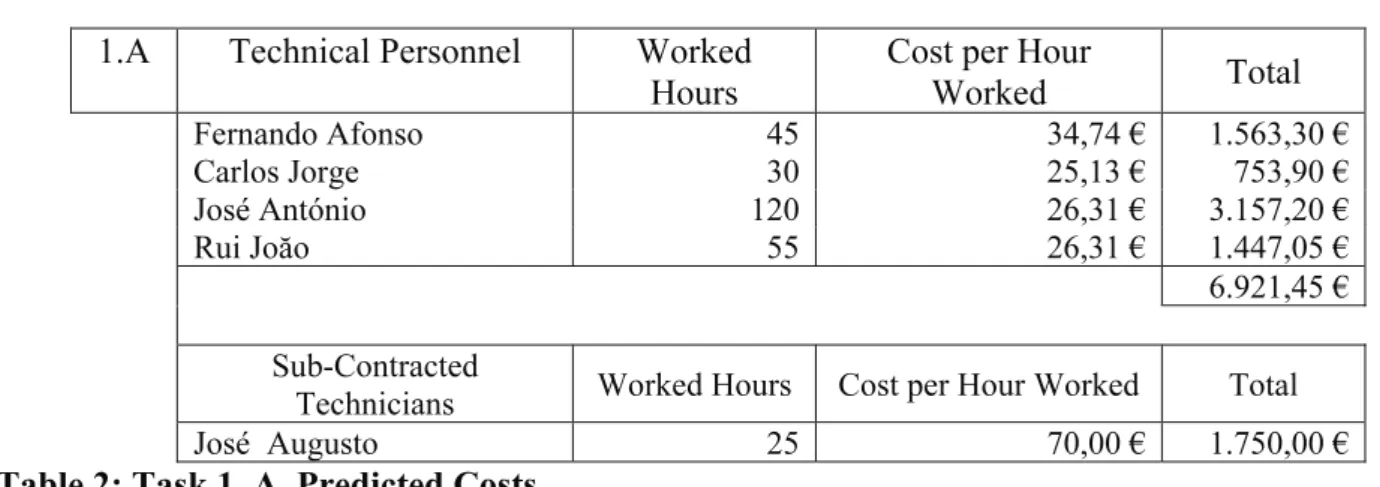
1.A Technical Personnel Worked Hours
Cost per Hour
Worked Total Fernando Afonso 45 34,74 € 1.563,30 € Carlos Jorge 30 25,13 € 753,90 € José António 120 26,31 € 3.157,20 € Rui Joăo 55 26,31 € 1.447,05 € 6.921,45 € Sub-Contracted
Technicians Worked Hours Cost per Hour Worked Total
José Augusto 25 70,00 € 1.750,00 €
Table 2: Task 1. A. Predicted Costs
Task 1.A. will cost 8.671.45€. This task is finished so this is the amount of money that has to be spent on it after three months. Now let’s see what happens with task 1.B., see table 3.
1.B Technical Personnel Worked Hours
Cost per Hour
Worked Total
Fernando Afonso 285 34,74 € 9.900,90 €
José António 212 26,31 € 5.577,72 €
Mário Gonçalves 212 19,71 € 4.178,52 €
19.657,14 €
Sub-Contracted Technicians Worked Hours Cost per Hour Worked Total
José Augusto 40 70,00 € 2.800,00 €
Table 3: Task 1.B. Predicted Costs
In this case, although task 1.B. will cost 22.457,14€, only 25% is supposed to be completed. Therefore, it is supposed to have paid 5.614,29€ for this task so far. Finally, the status of the task 1.C. is shown in table 4.
1.C Technical Personnel Worked Hours
Cost per Hour
Worked Total José António 145 26,31€ 3.814,95€ Rui Joăo 355 26,31€ 9.340,05€ Pedro Sousa 35 32,93€ 1.152,55€ Luís Sousa 140 21,99€ 3.078,60€ Celso Araújo 75 26,81€ 2.010,75€ Nuno Batista 130 16,96€ 2.204,80€ Manuel Soares 285 28,58€ 6.435,30€
Sandra dos Santos 305 15,58€ 4.751,90€
32.788,90€
Technical Personnel Worked Hours Cost per Hour Worked Total
José Augusto 20 70,00 € 1.400,00€
Once again, when task 1.C. is completed, it is supposed to cost 34.188,90€ but now, three months after the beginning of the project, it has a 50% completion. So, the cost that now matters is 17.094,45€. How much each task is supposed to cost? and which tasks are supposed to be “on-going”? It is possible to determine the amount that should be spent: 31.380,19€.
This amount is now exactly known. Unfortunately, things almost never go the way desired. Let`s see what happens if the real scenario is the following:
• Task 1.A. was harder than it was initially thought to be and, to finish it on time, everybody had to work 5% more than expected.
• Due to technical problems, task 1.B. had a one month delay and so, in this third month checkpoint, it still was not started.
• Due to lack of equipment, task 1.C. was delayed by one week.
Now let`s see how EVA takes into account this new information. Firstly, task 1.A. is on time but it costs more than the expected. Now it is necessary to spend 9.105,02€ to do the same job that it was thought to cost 8.671,45€. Secondly, task 1.B. has not begun. So although it was not spent the expected 5.614,29€, this is not good because the task is delayed and it will be probably necessary to spend more money later. Finally, Task 1.C. is 46% completed and it was spent 15.669,91€ on it so far. As can be seen, after three months of work, 24.774,94€ were spent while it was expected to have spent 31.380,19€. To some people this might look like good news. But let’s see what EVA configures about it.
The first thing to do is to determine the main variables for each task that has already begun or should have begun (see table 5).
ACWP 9.105,02 €
1.A.
BCWP 8.671,45 €
BCWS 8.671,45 €
Table 5: Task 1.A. main variables
Almost instinctively, ACWP (real cost) is determined and so is BCWS (predicted cost). The only tricky variable might be the BCWP. In this case, 1.A. is finished. So it does not matter if we have spent more or less than predicted or if we took more time or not to do it. When a task is completed, the BCWP is always equal to the BCWS. This shows that a good planning is absolutely imperative for the success of EVA. When a task is completed, it is possible to earn the value that it was initially established for that task. However, when a task is not finished this variable might cause some doubts. Basically, it is necessary to multiply the real percentage of completion of each task by the predicted costs of each one. In other words, it is necessary to determine how much the achieved work should have cost according to the first predictions. Now let`s analyze the development of the task 1.B. (table 6).
ACWP 0,00 €
1.B.
BCWP 0,00 €
BCWS 5.614,29 €
Table 6: Task 1.B. main variables
Once again, this comes almost naturally. ACWP and BCWP are obviously zero because the task has not started so there is no “work performed”. Additionally, BCWS is what we have seen above, the
money that we were supposed to have spent by now. So far so good. This seems naturally understood, it is easy to implement it and the theory comes almost naturally. Finally, let’s analyze the development of task 1.C. (table 7).
ACWP 15.669,91 €
1.C.
BCWP 15.669,91 €
BCWS 17.094,45 €
Table 7: Task 1.C. main variables
In this case BCWP is equal to ACWP because it is spent exactly what it should be according to the first predictions. On the other hand, BCWS is greater than BCWP showing that this task is delayed. But let´s now determine the secondary variables to put this information in a quantitative way.
For the task 1.A., and using the equations (1) and (3), it is realized that SV = 0 and SPI = 1. This means that this task is on time. On the other hand, when equations (2) and (4) are applied, it can be seen that CV has a negative value (showing that this task is overspending) and CPI = 0,95. This means that for every 1€ spent, only 0,95€ are actually being converted into work.
When looking at 1.B., it seems that it does not make much sense to calculate anything because the task is yet to start. But notice what happens when equation (1) is used. The result shows SV = -1, meaning that not only this task is delayed but also that it should have started but it did not.
Finally, when looking at 1.C., and applying equations (1) and (3), it is possible to see that SV = -0,083 (once again showing that this task is delayed) and SPI = 0,92 (meaning that only 92% of the time predicted was actually converted in work). Therefore, there was an 8% available time loss. On the other hand, equations (2) and (4) show a CV = 0 and CPI = 1, meaning that the amount spent is exactly what was predicted.
Now by knowing what is going on with each one of the tasks that should have begun by now, let`s look at the project as a whole and let’s see if should exist any concerns there. As told before, to see the overall project, it is necessary to sum all the main variables. In this case, the results are in table 8.
ACWP 24.774,94 €
BCWP 24.341,36 €
Project - Global Overview
BCWS 31.380,19 €
Table 8: Project Main Variables
Just by looking at these numbers it is possible to understand that things are not doing great. Let`s quantify it. When (1) is calculated, SV = -0,22. Accordingly, (3) presents a value for SPI of 0,78. So this project is definitely behind the schedule. On the other hand, when (2) is applied, it shows a CV = -0,02. Again, (4) shows us an CPI = 0,98 which means that this project is overspending. These are really bad news. If things continue as they are, this project will not only take more time to finish but also will cost more money. Let’s now quantify how much more. From the first predictions it is possible to know that this project has a budgeted cost (BAC) of 1.082.348,88€. When using (5), it can be realized that the EAC is 1.101.627,86€. Using these two variables, (6) can be calculated and it gives a VAC of -19.278,98€. This means that if the project keeps this tendency, when it is over, it will have cost more 19.278,98€ than expected. To do a time analysis a Gant graph should be built.
EVA does not take into account the critical path nor the slacks of each activity so it is impossible to know if a delay now will affect the final date for completion. Nevertheless, this deficiency is easily beaten and EVA`s advantages in cost control might be the difference between success and failure.
5 Conclusion and Limitations of the Study
First of all, it is important to say that the scenarios built for the case study were made up to provide the results wanted because there is no information about the real status of the project.
In this case study, for task 1.A., it was said that everybody worked 5% more. In real life these situations do not happen. One worker might work 10 hours more than expected, other one 7 hours less but it is always hard to realize the money that it is actually being spent. This is definitely a key success factor for EVA. A good informatics system and the habit of reporting progress and costs are the support that EVA requires.
Another thing to take to keep in mind is that, to simplify the math, we did not took into account the overheads nor equipment purchases. Basically, the results shown are just from tasks and their costs. Normally, in a project there are other factors that might influence the performances.
Another key success factor is the quality of the predictions and planning. As it was seen, the earned value at the end of a task was always what was predicted. Time allows that a project plan can be thought carefully.
It was also seen that EVA follows a standard or a tendency. So, spending an extra 1.000€ now, it does not mean that, at the end of the project, it will cost just 1000€ more. Probably, if you are overspending now you will keep on overspending and at the end of the project you will pay not 1.000€ but 20.000€ more than expected.
EVA may represent also a great control tool and it can be used many times to this aim. If something is wrong, EVA will definitely warn you on time so you can take corrective actions.
Finally, every time you use EVA you have to update your schedule. This might not look much important but it is and for that it is enough to see the following example. Imagine that a project lasts 12 months, you use the EVA model after the first one and you realize that the project is delayed. You take the actions needed but you forget to update your schedule. When you do another check point control, let`s say, at the end of the second month, even if there were not any more delays, the effects of that first delay will still be visible and you do not understand why. In other words, after that first delay, task X would finish two weeks later than first planned and if you do not update your schedule, every time you use EVA you will think that X is delayed another two weeks, when in fact it is already a consequence from the first delay.
To sum up, Earned Value Analysis is a very powerful project control/management tool. It might be expensive and it might be difficult to put it into work at the beginning. But if you have a good informatics system that collects your costs, if you have experienced personnel in planning and if you create your projects knowing that the EVA model will be applied, meaning that your project is formed by small and manageable tasks, than Earned Value Analysis may give you an edge and an advantage that can make all the difference.
References
[1] ESTEVES, J. M., SANTOS, A. A. e CARVALHO, J. Á., (2000), “O Ciclo de Vida dos Custos dos Sistemas ERP”, VII Congresso Brasileiro de Custos.
[2] GUSKUMA, E. A., (1999), “ERP: A Solução Final?”, Administração de Informática.
[3] JESUS, R. G. e OLIVEIRA, M. O. F., (2006), “Implantação de Sistemas ERP: tecnologia e pessoas na implementação do SAP R/3”, Revista de Gestão da Tecnologia e Sistemas de Informação.
[4] COLANGELO, L. F., (2001), “Implantação de Sistemas E.R.P. – Um enfoque de longo prazo”, São Paulo, Atlas.
[5] WILKENS, T. T., (1999), “Earned Value, Clear and Simple”, Los Angeles County Metropolitan Transportation Authority.
[6] CESARONE, J., (2007), “Project Management by the numbers – How Earned Value Analysis can keep you on track”.
[7] GIACOMETTI, R. A., SILVA, C. E. S., SOUZA, H. J. C., MARINS, F. A. S. and SILVA E. R. S., (2007), “Aplicação do Earned Value em projectos complexos – um estudo de caso na EMBRAER”.
[8] THAMHAIN, H. J., (1998), “Integrating Project Management Tools with the Project Team”, Long Beach: 29th Annual Project Management Institute Seminars and Symposium.
[9] WIDEMAN, R. M., (1999), “Cost Control of Capital Projects and the Project Cost Management Systems Requirements”, 2nd ed., Vancouver: AEW Services e Bi Tech Publishers.
[10] SPARROW, H., (2000), “EVM = Earned Value Management Results in Early Visibility and Management Opportunities”, Houston: 31st Annual Project Management Institute Seminars and Symposium.
[11] WEST, S. M. e McELROY, S., (2001), “EVMS: A Managerial Tool vs. a Reporting Tool”, Nashville: 32th Annual Project Management Institute Seminars and Symposium.
[12] VARGAS, R. V., (2003), “Earned Value Analysis in the Control of Projects: Success or Failure”, AACE International Transactions.
[13] LUKAS, J. A., (2008), “Earned Value Analysis – Why it doesn´t work”, AACE International Transactions.
Current addresses
Maria Isabel C. Pedro, Professor Auxiliar CEGIST/IST - Portugal
Av. Rovisco Pais,LISBOA, Portugal Phone: +(351) 214233267
e-mail: ipedro@ist.utl.pt
João Pereira, Masters Student Av. Rovisco Pais, LISBOA, Portugal Phone: +(351) 214233267
e-mail: jbleitaopereira@gmail.com
José António Filipe, Professor Auxiliar ISCTE – IUL
UNIDE – IUL, Av. Forças Armadas 1649-026 Lisboa, Portugal Tel.+351 217 903 000
Manuel Alberto M. Ferreira, Professor Catedrático ISCTE – IUL
UNIDE – IUL, Av. Forças Armadas 1649-026 Lisboa, Portugal Tel. +351 217 903 000