Estimation of the Total Efficiency of Metabolizable Energy Utilization for Maintenance
and Growth by Cattle in Tropical Conditions
Douglas Sampaio Henrique1, #, Ricardo Augusto Mendonça Vieira2,*, Pedro Antônio Muniz Malafaia3, Maurício Cordeiro Mancini4, André Luigi Gonçalves5
ABSTRACT - Data of 320 animals were obtained from eight comparative slaughter studies performed under tropical conditions and used to estimate the total efficiency of utilization of the metabolizable energy intake (MEI), which varied from 77 to 419 kcal kg−0.75d−1. The provided data also contained direct measures of the recovered energy (RE), which allowed calculating the heat production (HE) by difference. The RE was regressed on MEI and deviations from linearity were evaluated by using the F-test. The respective estimates of the fasting heat production and the intercept and the slope that composes the relationship between RE and MEI were 73 kcal kg−0.75d−1, –42 kcal kg−0.75d−1 and 0.37. Hence, the total efficiency was estimated by dividing the net energy for maintenance and growth by the metabolizable energy intake. The estimated total efficiency of the ME utilization and analogous estimates based on the beef cattle NRC model were employed in an additional study to evaluate their predictive powers in terms of the mean square deviations for both temperate and tropical conditions. The two approaches presented similar predictive powers but the proposed one had a 22% lower mean squared deviation even with its more simplified structure.
Key Words: bioenergetics, growth, net energy, ruminants
Estimação da Eficiência Total de Utilização da Energia Metabolizável para Manutenção e
Crescimento por Bovinos em Condições Tropicais
RESUMO - Foram utilizadas 320 informações obtidas a partir de 8 estudos de abate comparativo conduzidos em condições
tropicais para se estimar a eficiência total de utilização da energia metabolizável consumida, a qual variou de 77 a 419kcal kg−0.75d−1.
Os dados também continham informações sobre a energia retida (RE), o que permitiu o cálculo da produção de calor por diferença. As estimativas da produção de calor em jejum e dos coeficientes linear e angular da regressão entre RE e MEI foram respectivamente, 73 kcal kg−0.75d−1, –42 kcal kg−0.75d−1 e 0,37. Em seguida, a eficiência total foi estimada dividindo-se a energia líquida para mantença e produção pelo consumo de energia metabolizável. A eficiência total de utilização da MEI obtida e estimativas análogas baseadas no modelo do NRC gado de corte foram empregadas em um estudo adicional para avaliar as predições da energia líquida total para mantença e crescimento em condições de clima temperado e tropical. Os dois modelos apresentaram poder de predição semelhante, mas o quadrado do desvio médio do método proposto foi 22% menor, mesmo com uma estrutura mais simplificada.
Palavras-chave: bioenergética, crescimento, energia líquida, ruminantes
#Part of the first author M.Sc. Dissertation presented to the Animal Science Graduate Program, IZ/UFRRJ.
1D.Sc. graduate student, Dapartamento de Zootecnia, Universidade Federal de Viçosa, Viçosa, MG, CEP 36571-000, Brasil.
2Associate Professor, Laboratório de Zootecnia e Nutrição Animal, Centro de Ciências e Tecnologias Agropecuárias, Universidade
Estadual do Norte Fluminense Darcy Ribeiro, Av. Alberto Lamego, 2000, Campos dos Goytacazes, RJ, CEP 28013 600, Brasil.
3Adjunct Professor, Departamento de Nutrição Animal e Pastagens, Instituto de Zootecnia, Universidade Federal Rural do Rio de Janeiro. 4Adjunct Professor, Departamento de Tecnologia Química, Instituto de Tecnologia, Universidade Federal Rural do Rio de Janeiro, Antiga
Rodovia Rio-São Paulo, km 47, Seropédica, RJ, CEP 23851-970, Brasil.
5Adjunct Professor, Unidade Universitária de Aquidauana, Universidade Estadual de Mato Grosso do Sul, Rodovia Aquidauana - CERA,
km 12, Aquidauana, MS, CEP 79200-000, Brasil.
*Corresponding author. E-mail: [email protected] Introduction
The transformation of food energy into products of animal origin, as in any other energy transformation system, is not devoid of losses since there is an efficiency by which the food energy is used for maintenance and production. Brody (1945) and Kleiber (1975) categorized two types of energy
Among the losses observed in the energy transformation processes, there are pronounced ones that can not be neglected: the contribution of the heat of combustion from both the partially digestible and indigestible residues recovered in feces; the energy losses associated to gaseous products of digestion and urinary excretion residues; and the heat increment due to digestion, absorption and uptake of nutrients (NRC, 1981, 1996; Baldwin, 1995). Subtracting these losses from the total energy intake one could obtain the net energy of the food, i.e., the fraction that will be available for both the maintenance and productive functions.
The observation that animals present different performances by consuming rations with the same contents in total digestible nutrients (TDN) led to the development of the net energy systems, allowing the prediction of these differences in performance because energy losses associated to heat increments are considered and are directly related to the fiber content of the ration (Blaxter, 1966; Van Soest, 1994).
The net energy system is based on comparative slaughter experiments to determine the energy requirements of beef cattle and the net energy value
of the food. The heat energy
( )
HE is calculated by thedifference between the metabolizable energy intake
(
MEI)
and the energy retained by the animal body( )
RE . According to the current terminologyrecommended by the NRC (1981), the heat energy could be further fractionated into the energy costs due
to fasting metabolism
(
HeE)
and to maintenance andproductive heat increments
(
HiE)
.The maintenance and retained net energy contents of the food are both defined according to the following expressions (NRC, 1981, 1996):
[
NEm]
=HeE Im, NEm =HeE (1)[
NEr]
=RE(
I−Im)
, NEr =RE (2)The terms
[
NEm]
and[
NEr]
, expressed in kcal1
kg
− of dry matter, correspond to the food net energiesconcentrations of maintenance and production,
respectively; the terms HeE and RE are expressed in
kcal kg−0.75d−1; I
m (kg kg−0.75d−1) is the food intake
necessary to meet the maintenance functions; and I
(kg kg−0.75d−1) represents the voluntary dry matter
intake under ad libitumconditions.
The relationship among the metabolizable energy,
the net energy for maintenance (
[
NEm), the retainedenergy
(
RE=NEr)
, and the heat increments associatedto these processes is classically described by the expression below (NRC, 1981; NRC, 1996):
E H NE NE
ME= m+ r + i (3)
where ME represents the animal requirement for metabolizable energy and all terms are expressed in
kcal kg−0.75d−1.
In AFRC (1993) the square brackets involving the variables are used to denote energy concentration (energy units per unit of mass), while the variables without this notation represent the total energy category required by the animal (energy units per unit of time). In the present study, the same notation was used. Nevertheless, in the NRC (1981; 1996) the notation used to describe both the energy requirements
(kcal kg−0.75d−1) and the food energy values (kcal kg−1)
were the same and this may cause misunderstanding.
An example is the improper sum between
[
NEr]
and[
NEm]
, since the replacement of the terms in Eq. (3)by its concentration counterparts of Eq. (1) and (2) will result in the following paradox:
I ME I E H ) I I ( RE I E
He m+ − m + i ≠ . (4)
The goals of this study were the estimation of the total efficiency of metabolizable energy utilization for maintenance and growth by cattle raised under tropical conditions and the evaluation of the predictive power of the statistical approach performed.
Materials and Methods
Experimental data
Data were composed by animals belonging to
Nellore (n1=132), Gir (n2=12), 1/4 Fleckvieh×5/16
Angus×7/16 Nellore (
n
3=11), F1 Holstein×Nellore(
n
4= 12), Guzerat (n
5= 12), F1 Holstein×Zebu(
n
6= 42), 3/4 Holstein×Zebu (n
7= 10), Tabapuan(
n
8= 10), 5/8 Holstein×Zebu (n
9= 9), F1 Nellore×Simmental (
n
10= 24), and Holstein (n
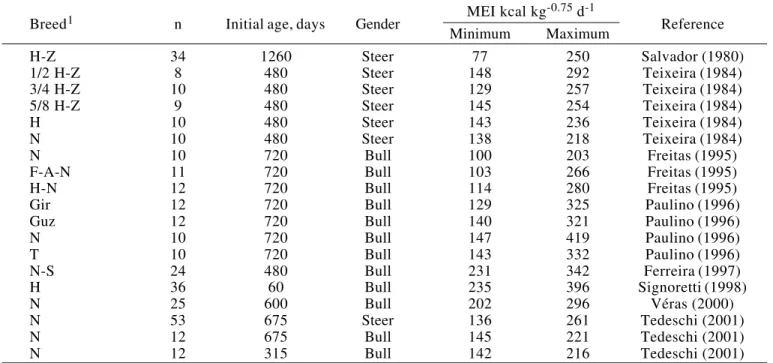
11= 46) breedand crossbreed types. All animals were male and 134 of the total were castrated. The experiments were carried out for five months on average, with the animals initial age varying from 2 to 42 months old. Information about the animals is presented in Table 1.
The nonlinear form of the model employed by Lofgreen and Garret (1968) was used to describe the heat production as a function of the metabolizable energy intake:
(
i)
ii exp MEI e
HE =α⋅ β⋅ + (5)
where HEi and MEIi represented the heat energy and
the metabolizable energy intake in the ith animal, both
expressed in kcal kg−0.75d−1; α is the parameter that
allowed estimating the fasting heat production and corresponds to the net energy requirement for
maintenance (NEm, kcal kg−0.75d−1); β is defined as the
specific transformation coefficient of the consumed
metabolizable energy into heat (d kg0.75
Kcal−1),
equivalent to the slope of the original linear model used
by Lofgreen & Garret (1968) multiplied by ln 10; and
the term ei used to describe the experimental error.
The parameters estimates of the nonlinear model described by Eq. (5) were obtained according to the Marquardt’s compromise by means of a nonlinear least squares estimation procedure. Following the first fitting, outliers were excluded from the original data when the absolute values of their studentized residuals were greater than three (Draper & Smith, 1966). Then, the parameters were again estimated by using the new data set without the outliers.
The metabolizable energy intake for maintenance
(
MEIm)
was established at the energy equilibrium,where assumptions made were the completely conversion of MEI into heat and at this point RE
should be equated to 0. Afterwards MEIm was
estimated by an iterative procedure in which increasing values of MEI (within the range of the observed data) were substituted in the equation:
(
ˆ MEI)
expˆ
HE=α⋅ β⋅ (6)
Table 1 - Description of the estimation set of data
Breed1 n Initial age, days Gender MEI kcal kg-0.75 d-1 Reference
Minimum Maximum
H-Z 34 1260 Steer 77 250 Salvador (1980)
1/2 H-Z 8 480 Steer 148 292 Teixeira (1984)
3/4 H-Z 10 480 Steer 129 257 Teixeira (1984)
5/8 H-Z 9 480 Steer 145 254 Teixeira (1984)
H 10 480 Steer 143 236 Teixeira (1984)
N 10 480 Steer 138 218 Teixeira (1984)
N 10 720 Bull 100 203 Freitas (1995)
F-A-N 11 720 Bull 103 266 Freitas (1995)
H-N 12 720 Bull 114 280 Freitas (1995)
Gir 12 720 Bull 129 325 Paulino (1996)
Guz 12 720 Bull 140 321 Paulino (1996)
N 10 720 Bull 147 419 Paulino (1996)
T 10 720 Bull 143 332 Paulino (1996)
N-S 24 480 Bull 231 342 Ferreira (1997)
H 36 60 Bull 235 396 Signoretti (1998)
N 25 600 Bull 202 296 Véras (2000)
N 53 675 Steer 136 261 Tedeschi (2001)
N 12 675 Bull 145 221 Tedeschi (2001)
N 12 315 Bull 142 216 Tedeschi (2001)
1Breed: H = Holstein, N = Nellore, T = Tabapuan, Guz = Guzerat, H-Z = Zebu, F-A-N = Fleckvieh-Angus-Nellore, H-N =
until the ratio
HE
MEI
approached 1.000.The validity of the linearity assumption for the relationship between energy retention and the metabolizable energy intake, widely discussed in the literature (Blaxter, 1966; NRC, 1981; Garret & Johnson, 1983; Baldwin, 1995), was verified by using
F-tests based on the sum of squares of first, second
and third degrees models (Searle, 1971). Since linearity
assumptions were not violated, the estimated MEIm
was used as a component of the parametric restriction in the following model:
=
′
+
⋅
+
=
0
e
EI
M
ä
ã
E
R
i i iè
P
(7)where REi corresponds to the energy retained by the
ith animal; and δ represent both the intercept and
the slope of the linear regression of the REi over
MEIi; and ei is the experimental error under the usual
assumptions of normally and independently distributions
with mean 0 and variance σ2. P′ is the transpose of
the restriction vector applied to the parameter vector
è, such that P′ =
[
1 MEIm]
and è′=[
γ δ]
. Thesolution of the restricted model was obtained by the ordinary least squares estimation procedure (Searle, 1971) and illustrated by its normal equations in matrix terms as follows:
(8)
where λ is a Lagrange multiplier. The logic of this
approach was the avoidance of different MEIm
estimates after relating both the retained energy and the heat production on MEI.
Energetic efficiency
The total efficiency of metabolizable energy
utilization
( )
ki was individually estimated for thoseanimals belonging to the evaluation set of data by using the following expression:
(
+)
=α +γ +δ= NE RE MEI ˆ MEI ˆ MEI ˆ
kˆi m i i i i (9)
where
α
ˆ
γ
ˆ
δ
ˆ
were estimated by fitting Eq. (5)and (7) to the experimental data.
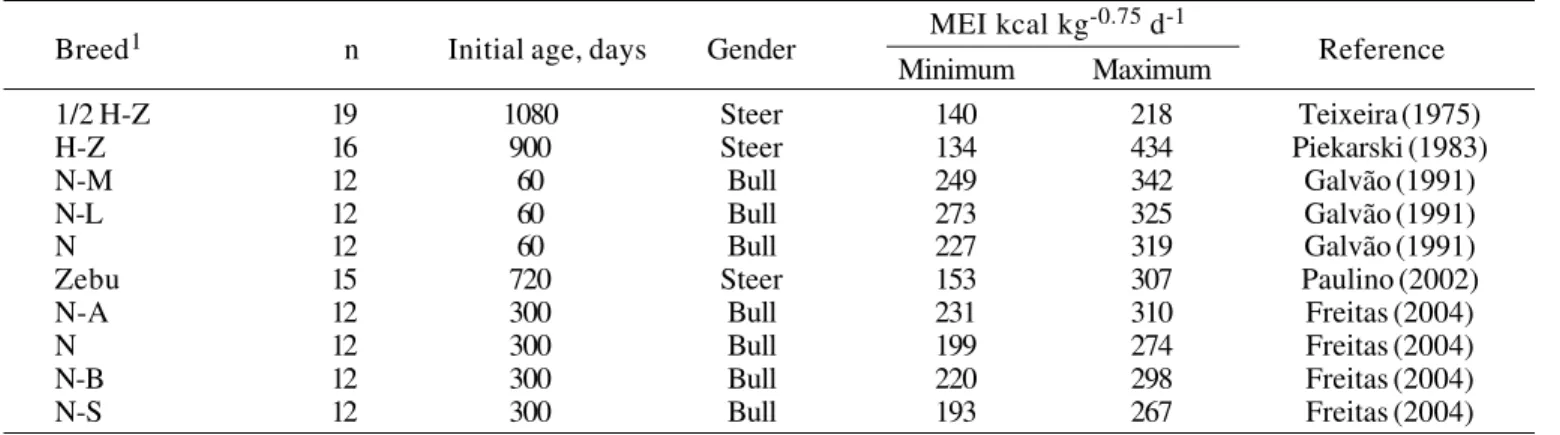
The comparison of predictions and observations to assess model performance (COPAMP, according to P. L. Mitchell, personal communication) was done by using 134 paired observations (MEI and RE) obtained from the appendices of four Master of Science dissertations (Teixeira, 1975; Piekarski, 1983; Galvão, 1991; Paulino, 2002) and one Doctoral thesis (Freitas, 2004) presented to the Animal Science Department of the Federal University of Viçosa (Table 2), and 65 paired means (each one calculated from 6 to 8 observations) published by Lofgreen & Garret (1968). These data sets were independent from the experi-mental one used for parameters estimation, a common criterion for empirical validation (Mertens, 1976; Mitchell & Sheehy, 1997).
The fasting heat production of the evaluation set of data was ad hoc estimated after fitting Eq. (5) and added to the observed RE of each animal to obtain the related total net energy required for maintenance and
growth
( )
NEmg . The observed MEIi of this group wereused as inputs to Eq. (9) and allowed predicting the
mg
NE by using parameters estimates (
α
ˆ
γ
ˆ
δ
ˆ
)after fitting Eq. (5) and (7) to the set of experimental data. The same procedure was done by using the average values published by Lofgreen & Garret (1968).
The NEmg estimates were also obtained by simulating
the NRC (1996) model with the evaluation set of data as an input. The predictive powers of these approaches were compared by means of residual analysis (Draper & Smith, 1966; Mitchell & Sheehy, 1997) and by the decomposition of the mean square deviations as suggested by Kobayashi & Salam (2000).
Results and Discussion
Net energy for maintenance
algorithm with three iterations. The examination of the studentized residuals plotted against the metabolizable energy intake allowed identifying five outliers. After
theirelimination from the original set of data, a new
fitting procedure was done which resulted in the
estimates presented in Table 3.
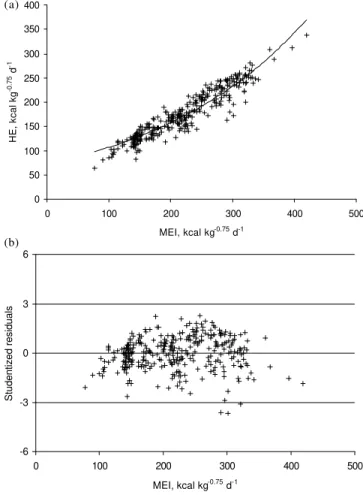
The plot of the residuals (Figure 1b) exhibited an undesirable curvature nearest the upper and lower values of the MEI. However, the good adjustment of the function’s line to the observed data (Figure 1a), the asymptotic confidence intervals (Table 3) and the
small coefficient of variation (100 order of magnitude,
%) of the parameters estimates were indicatives of a satisfactory quality of fit.
The fasting heat production estimated in this study
(Table 3) was slightly lower than 77 kcal kg−0.75d−1
found by Lofgreen & Garret (1968) and Tedeschi et al.
(2002) for animals belonging, respectively, to Bos taurus
and B o s i n d i c u s species. The estimate 3
10 7 .
1 ⋅ − d kg0.75kcal−1 obtained by Lofgreen & Garret
(1968) with the linearized form of the model did not fall within the asymptotic confidence interval estimated for
parameter β in the present study (Table 3). More closer
with the presented results were the estimates obtained by Ferrell & Jenkins (1998) for animals of diverse
genotypes (74.9 for α and 3.7⋅10−3 for β). A point
estimate alone, however, is not satisfactory. Random errors are presented in all measurements, and no mathematical model could be used to account all facets of a physical situation. Therefore, it is virtually impossible to obtain the true values of the parameters. Nor point estimates calculated from different data samples will be equal, even if the samples were obtained under similar conditions. Thus it is necessary to augment the point estimates with some information on its variability, which is provided by the standard deviations and confidence intervals associated to the parameters (Bard, 1974).
The fasting heat production estimated (Table 3)
would corroborate the hypothesis that the Bos indicus
breeds and crossbreeds have lower net energy requirements for maintenance due to their lower genetic production potential and better adaptation to unfavorable environmental conditions (NRC, 1996). In this study, the majority of the information used to
Table 3 - Point and interval estimates of the parameters obtained by fitting the model that describes the heat production as a function of the metabolizable energy intake (Eq. (5))
Asymptotic confidence interval at the probability level of 0.95
Parameters Estimates SEa
Lower limit Upper limit
α* 73 2 70 76
β** 3.9 × 10⁻³ 8.0 × 10⁻⁵ 3.7 × 10⁻³ 4.0 × 10⁻³
* kcal 0.75
kg−
1
d−.
** d kg0.75kcal-1.
a Asymptotic standard error.
Table 2 - Description of the evaluation set of data
Breed1 n Initial age, days Gender MEI kcal kg-0.75 d-1 Reference
Minimum Maximum
1/2 H-Z 19 1080 Steer 140 218 Teixeira (1975)
H-Z 16 900 Steer 134 434 Piekarski (1983)
N-M 12 60 Bull 249 342 Galvão (1991)
N-L 12 60 Bull 273 325 Galvão (1991)
N 12 60 Bull 227 319 Galvão (1991)
Zebu 15 720 Steer 153 307 Paulino (2002)
N-A 12 300 Bull 231 310 Freitas (2004)
N 12 300 Bull 199 274 Freitas (2004)
N-B 12 300 Bull 220 298 Freitas (2004)
N-S 12 300 Bull 193 267 Freitas (2004)
1Breed: N = Nellore, H-Z = Holstein-Zebu, N-M = Nellore-Marchigiana, N-L = Nellore-Limousin, N-A = Nellore-Aberdeen Angus, N-B =
0 50 100 150 200 250 300 350 400
0 100 200 300 400 500
MEI, kcal kg-0.75 d-1
HE, kcal kg
-0.75
d
-1
-6 -3 0 3 6
0 100 200 300 400 500
MEI, kcal kg-0.75 d-1
Studentized residuals
Figure 1 - Relationship of heat production (HE) to metabolizable energy intake (MEI) (a). Estimates of the studentized residuals related to heat production plotted against the metabolizable energy intake (b).
physiological stage affecting estimates for parameter
α. Kleiber (1975) emphasized that a larger interval for
the animal masses causes a greater influence over the estimate of this parameter, thus reducing the impact of other factors. The modeling process is based on assumptions and aggregations about the components of the real-world systems (Mertens, 1976; 1993). This theoretical reduction is thus an intrinsic characteristic of the modeling process and as mentioned earlier some aspects of the real system must be disregarded for mathematical treatment and simplicity (Bard, 1974; Mertens, 1976; Kobayashi & Salam, 2000).
The assertion about the existence of differences
among the mentioned estimates for parameter α could
not be valid, since we found a high asymptotic
correlation between the estimates for parameters α
and β after the fitting procedure. This may be a
problem intrinsically related to model characteristics and fitting procedures that are beyond the scope of the present study.
The simulation of the model under extreme conditions provides an evaluation tool for either its applicability or its lack of generality (Mertens, 1976). If a continuous increase of the metabolizable energy intake is simulated, the Eq. (5) with its exponential behavior predicts a heat production that could lead the animal to a theoretical overheating. However, no signs of either an inflection point or an asymptotic phase were identified after a visual appraisal of the plotted relationship between HE and MEI (Fig 1a), which still justifies the application of the model described by Eq. (5).
The net energy requirement for maintenance was
considered constant in the approach presented. This
assumption has been made for the feed evaluation and nutritional requirement systems in current use for ruminants (NRC, 1981; 1996). However, Milligan & Summers (1986) and Baldwin (1995) asserted that the heat increment above the maintenance level is
fit Eq (5) was obtained from Bos indicus breeds and
crossbreeds (n=274). Nevertheless, this subject is open to question since other studies have not found
differences between Bos indicus and Bos taurus in
relation to the net energy requirements for maintenance (Ferrell & Jenkins, 1998; Tedeschi et al., 2002). Brody (1945) and Baldwin (1995) suggested that there are factors such as the body mass, age, sex, and
Table 4 - Variation range of the studied variables
Variables Minimum observed Maximum observed Number of observations
MEI1 77 419 320
HE2 63 339 320
RE3 -6 129 320
EBW4 102 486 320
1Metabolizable energy intake (kcal kg –0.75 d –1). 2Heat energy (kcal kg –0.75 d –1).
3Retained energy (kcal kg –0.75 d –1). 4Empty body weight (kg).
(a)
attributed to the heat increments of the productive functions and to support energy expending processes that are not part of the productive related pathways. In fact, the latter processes are further accentuated by intake above energy balance, i.e., in line with the plane of nutrition.
The relationship between the recovered energy and the metabolizable energy intake was presumed
linear and checked by using the F-test (Searle, 1971).
After fitting the unrestricted models of first, second and third degrees, it was observed that the quadratic
(Fˆ =1.81; P=0.1794) and cubic effects (Fˆ <1) were
not significant and the linear model (Eq. (7)) adopted to describe this relationship.
Estimated the value 112 kcal kg−0.75d−1 for
m
MEI ,
the restricted linear model described by Eq. (7) was then fitted to obtain the point estimates of the parameters and their respective confidence intervals (Table 5, Figure 2).
The fitted equation accounted for only 49% of the variation in the RE. We are conscious about the effects of other variables over RE, among them are sex (Ferrell & Jenkins, 1985), breed (Ferrell & Jenkins, 1998) and stage of growth (Geay, 1984, Williams & Jenkins, 2003; Tedeschi et al., 2004). Geay (1984) argued that the diet ME utilization efficiency for growth is inversely related to the proportion of energy retained as protein in the animal body. The data used in his study were mean values obtained from literature, which in turn probably arose from large data sets. The objective of this study, however, was to estimate the diet
[ ]
NEmg and the size of the data set used hamperaccurate estimates of the above-mentioned effects. Our strategy was the same employed by Ferrell & Jenkins (1998) who studied the diet ME utilization by diverse genotypes of cattle by pooling data of all genotypes together to obtain “a more robust equation”,
-40 -20 0 20 40 60 80 100 120 140
0 100 200 300 400 500
MEI, kcal kg-0.75 d-1
RE, kcal kg
-0.75
d
-1
-6 -3 0 3 6
0 100 200 300 400 500
MEI, kcal kg-0.75 d-1
Studentized residuals
Figure 2 - (a) Relationship between recovered energy (RE) and metabolizable energy intake (MEI). (b) Studentized residuals plotted against the metabolizable energy intake.
despite statistical differences detected among breeds. Nevertheless, this matter will be considered in further developments of the approach just described.
The net energy available for maintenance and
growth
( )
NEmg of the evaluation data set was predictedfrom the observed MEI by using a simple rearrangement of Eq. (9):
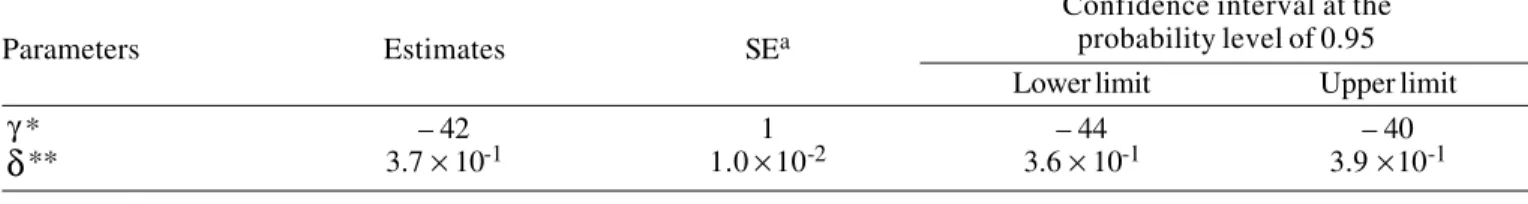
Table 5 - Point and interval estimates of the parameters obtained by fitting the model that describes the retained energy as a function of the metabolizable energy intake (Eq. (8))
Confidence interval at the probability level of 0.95
Parameters Estimates SEa
Lower limit Upper limit
γ* – 42 1 – 44 – 40
δ
** 3.7 × 10⁻¹ 1.0 × 10⁻² 3.6 × 10⁻¹ 3.9 × 10⁻¹* kcal kg –0.75 d –1.
** Unitless parameter that represents the asymptotic partial efficiency of the metabolizable energy utilization.
a Standard error.
(a)
0 50 100 150 200 250
0 50 100 150 200 250
Observed NEmg, kcal kg-0.75 d-1
Predicted NE
mg
, kcal kg
-0.75
d
-1
-6 -4 -2 0 2 4 6
0 50 100 150 200
Observed NEmg, kcal kg-0.75 d-1
Studentized residuals
0 50 100 150 200 250
0 50 100 150 200 250
Observed NEm g, kcal kg-0.75 d-1
Predicted, NE
mg
, kcal kg
-0.75
d
-1
-6 -4 -2 0 2 4 6
0 50 100 150 200
Observed NEmg, kcal kg-0.75 d-1
Studentized residuals
0 50 100 150 200 250
0 50 100 150 200 250
Observed NEm g, kcal kg-0.75 d-1
Predicted NE
mg
, kcal kg
-0.75
d
-1
-6 -4 -2 0 2 4 6
0 50 100 150 200
Observed NEm g, kcal kg-0.75 d-1
Studentized residuals
(a)
(b)
(c)
(d)
(e)
(f)
Figure 3 - (a)NEmg predicted by using Eq. (10) and (c) NEmg predicted by using the NRC (1996) equations either plotted
against observed values obtained under tropical conditions; (e) NEmg predicted by using Eq. (10) against
observed values obtained by Lofgreen & Garret (1968); the residuals (predicted minus observed) of each scatter graph (a, c and e) were also plotted against the observed values (b, d and f).
NE
mgi=
MEI
i⋅
kˆ
i (10)where subscript i denotes the ith animal of the
evaluation set of data.
The concentration of the ration metabolizable
energy, [ME], the empty body weight (EBW), and the dry matter intake (DMI) of the evaluation data were also used as inputs in the NRC (1996) equations to
estimate the NEmg. This procedure was not done with
because the DMI were not available, hence they were only used in the evaluation of the estimates obtained with Eq. (10). The latter observations provided an evaluation of the model performance under temperate climate conditions (Figure 3e,f).
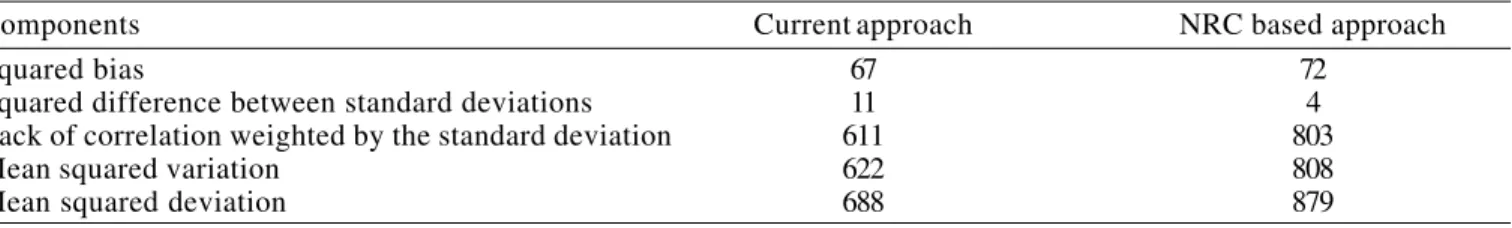
The evaluation of the performances of both models allowed identifying its similar predictive powers and systematic errors (Figure 3), but the presented approach had 22, 7, 24 and 23% respectively smaller mean squared deviation (MSD), squared bias (SB), lack of correlation weighed by the standard deviation (LCS) and mean squared variation (MSV) than the NRC model. The latter had a 59% lower squared difference between standard deviations (SDSD) in relation to our estimates (Table 6, Figure 4). According to Kobayashi & Salam (2000), when comparing predicted and observed values, the lower the value of MSD, the closer the simulation is to the measurement, a bigger MSV indicates that the model failed to simulate the variability of the measurement around the mean, a larger SDSD indicates that the model failed to simulate the magnitude of fluctuation
among the n measurements and, a greater LCS means
that the model failed to simulate the pattern of the
fluctuation across the n measurements.
According to the analysis presented, the ration content of net energy for maintenance and growth
estimated on the basis of the total efficiency of
metabolizable energy utilization can be treated on an additive fashion:
[ ]
(
ME I)
RE(
[ ]
ME I)
NE
k= m ⋅ + ⋅ (11)
Since
[ ]
ME ⋅I=MEI (12)and by dividing the right-hand side of Eq. (10) by the dry matter intake (I), and substituting k by the expression described in Eq. (11) yield:
Table 6 - Mean squared deviations and its components in a comparison between the current approach and the NRC based approach
Components Current approach NRC based approach
Squared bias 67 72
Squared difference between standard deviations 11 4
Lack of correlation weighted by the standard deviation 611 803
Mean squared variation 622 808
Mean squared deviation 688 879
[ ]
ME k[ ]
ME{
NE(
[ ]
ME I)
RE(
[ ]
ME I)
}
I k
MEI⋅ = ⋅ = ⋅ m ⋅ + ⋅
(13) and then,
(
NEm+RE)
I=NEmg I (14)Nutritionally, the terms of the equation related to the second law of thermodynamics are described as follows (Brody, 1945; Baldwin, 1995):
S T H
G=∆ − ∆
∆ (15)
where ∆G corresponds to the amount of free energy
of the food available for productive functions and
maintenance processes,
[
NEmg]
; ∆H represents thefood energy available for oxidation by tissues, and corresponds to the food metabolizable energy
concentration,
[ ]
ME ; and the component T∆S is theFigure 4 - Mean squared deviation (MSD) and its components, squared bias (SB), squared difference between standard deviations (SDSD), and lack of correlation weighted by the standard deviation (LCS) in a comparison between the presented approach (1) and the NRC model (2).
0 100 200 300 400 500 600 700 800 900
1 2
M
S
D
heat increment due to the processes of digestion,
absorption and uptake of nutrients,
[ ]
HiE . Therefore,I E H I ME I
NEmg = − i
(16)
by substituting NEmg by the linear combination
between NEm and RE in the Eq. (14), rearranging
the components of Eq. (16) and applying the notation used to describe the food energy in terms of concentration (AFRC, 1993), it is demonstrated that:
[ ] [
ME = NEm] [ ] [ ]
+ RE + HiE (17)or
I E H I RE I E H I
ME = e + + i (18)
now obeying, differently from the left hand side of Eq. (4), the additive nature established in the first and second laws of thermodynamics.
Conclusions
The use of the function of the total efficiency of the diet metabolizable energy utilization yields reasonable estimates of the available net energy for maintenance and growth for both tropical and temperate conditions. Despite the similar predictive powers between the presented method and the NRC (1996) equations, the former has a lower mean squared deviation even with its more simplified structure.
Acknowledgements
The authors wish to thank all graduate students and professors that gave their contributions to the development of the brazilian livestock production. We are also indebted to L. O. Tedeschi, P. V. R. Paulino and J. A. Freitas who gently provided original data from their respective PhD thesis, Master of Science dissertation and Doctoral thesis. Finally, we gratefully acknowledge the two anonymous reviewers for their valorous comments and suggestions that greatly contributed to the improvement of the first draft.
The first and second authors have a debt of gratitude to Mr. Ernani José de Paula, owner of the Fazenda Barreiro (Silvânia, state of Goiás), who
provided funds, material and other essential resources whereby the entire creative process associated to this work become possible since January 2001.
In Memoriam
Escrevemos com grande pesar à comunidade cien-tífica que atua na Zootecnia brasileira breves palavras sobre aquele que se tornou um ícone da caprinocultura nacional, um zootecnista incansável na defesa desta bandeira. Registramos para a posteridade não apenas as qualidades do técnico de soluções geniais, que apesar de parecerem impróprias eram carregadas de pertinência. Mas, fundamentalmente, exaltamos a for-ma alegre como encarava os desafios comuns de nossa
breve existência. Nos damos conta, pois, que o front
sofreu uma irreparável baixa... falta-nos o Prof. Dr. André Luigi Gonçalves. Permaneceremos na luta, con-tudo, grande amigo, guardando tua alegria no coração para que nos revigore, oportunamente, perante as bata-lhas que, por certo, hão de ocorrer.
Literature Cited
AGRICULTURAL AND FOOD RESEARCH COUNCIL -AFRC. Energy and protein requirements of ruminants. Wallingford: CAB International, 1993.159p.
BALDWIN , R.L. Modeling ruminant digestion and metabolism. London: Chapman & Hall, 1995. 578p. BARD, Y. Nonlinear parameter estimation. New York:
Academic Press, 1974, 341p.
BLAXTER, K.L. The energy metabolism of ruminants. 2.ed. Illinois: Charles C. Thomas Publisher, 1966, 332 p. BRODY, S. Bioenergetics and growth, with special reference
to the efficiency complex in domestic animals. New York:
Reinhold Publishing Corporation, 1945. 1023p.
DRAPER, N.R.; SMITH, H. Applied regression analysis. New York: John Wiley & Sons, 1966. 407p.
FERREIRA, M.A. Desempenho, exigências nutricionais e eficiência da utilização da energia metabolizável para ganho de peso de bovinos F1 Simental x Nelore. Viçosa, MG: Universidade Federal de Viçosa, 1997. 97p. Tese (Doutorado em Zootecnia) - Universidade Federal de Viçosa, 1997.
FERRELL, C.L; JENKINS, T.G. Body composition and energy utilization by steers of diverse genotypes fed a high-concentrate diet during the finishing period: II. Angus, Boran, Brahman, Hereford, and Tuli Sires. Journal of Animal Science, v.76,
p.647-657, 1998.
FREITAS, J.A. Exigências nutricionais de energia e proteína e eficiência líquida de utilização da energia metabolizável para bovinos de diferentes grupos genéticos, em confinamento. Viçosa, MG: Universidade Federal de Viçosa, 2004. 89p. Tese (Doutorado em Zootecnia) - Universidade Federal de Viçosa, 2004.
GALVÃO, J.G.C. Estudo da eficiência nutritiva, caracterís-ticas e composição física da carcaça de bovinos de três grupos raciais, abatidos em três estágios de maturidade. Viçosa, MG: Universidade Federal de Viçosa, 1991. 82p. Dissertação (Mestrado em Zootecnia) - Universidade Federal de Viçosa, 1991.
GARRET, W.N.; JOHNSON, D.E. Nutritional energetics of ruminants. Journal of Animal Science, v.57 (Suppl. 2) p.478-496, 1983.
GEAY, Y. Energy and protein utilization in growing cattle.
Journal of Animal Science, v.58, n.3, p.767-778, 1984. KLEIBER, M. The fire of life. An introduction to animal
energetics. 2.ed. New York: Robert E. Krieger Publishing Company, 1975. 453p.
KOBAYASHI, K.; SALAM, M. Comparing simulated and measured values using mean squared deviation and its components. Agronomy Journal, v.92, p.345-352, 2000. LOFGREEN, G.P.; GARRET, W.N. A system for expressing net
energy requirements and feed values for growing and finishing beef cattle. Journal of Animal Science, v.27, p.793-806, 1968. MERTENS, D.R. Principles of modeling and simulation in teaching and resesarch. Journal of Dairy Science, v.60, n.7, p.1176-1186, 1976.
MERTENS, D.R. Rate and extent of digestion. In: FORBES, J.M.; FRANCE, J. (Eds.) Quantitative aspects of ruminant digestion and metabolism. Wallingford: CAB International,
1993. p.13-51.
MILLIGAN, L.P.; SUMERS, M. The biological basis of maintenance and its relevance to assessing responses to nutrients. Proceedings of the Nutrition Society, v.45, p.185-193, 1986.
MITCHELL, P.L.; SHEEHY, J.E. Comparison of predictions and observations to asses model performance: a method of empirical validation. In: KROPFF, M.J.; TENG, P.S.; AGGARWAL, P.K. et al. (Eds.) applications of system approaches at the field level. Netherlands: Kluwer Academic Publishers, 1997. p.437-451.
NATIONAL RESEARCH COUNCIL - NRC. Nutritional energetics of domestic animals & Glossary of energy terms. 2.ed. Washington: National Academy Press, 1981. 54p. NATIONAL RESEARCH COUNCIL - NRC. Nutrient requirements of beef cattle. 7.ed. Washington: National Academy Press, 1996. 242p.
PAULINO, M.F. Composição corporal e exigências de ener-gia, proteína e macroelementos minerais (Ca, P, Mg, Na, K) de bovinos não-castrados de quatro raças zebuínas em confinamento. Viçosa, MG: Universidade Federal de Viço-sa, 1996. 80p. Tese (Doutorado em Zootecnia) - Universidade Federal de Viçosa, 1996.
PAULINO, P.V.R. Exigências nutricionais e validação da seção HH para predição da composição corporal de zebuínos. Viçosa, MG: Universidade Federal de Viçosa, 2002. 158p. Dissertação (Mestrado em Zootecnia) - Univer-sidade Federal de Viçosa, 2002.
PIEKARSKI, P.R.B. Valor nutritivo da vinhaça concentrada e do melaço na alimentação de bovinos em confinamento. Viçosa, MG: Universidade Federal de Viçosa, 1983. 49p. Dissertação (Mestrado em Zootecnia) - Universidade Federal de Viçosa, 1983.
SALVADOR, M. Exigências de energia e proteína para engorda de novilhos azebuados. Viçosa, MG: Universidade
Federal de Viçosa, 1980. 70p. Dissertação (Mestrado em Zootecnia) - Universidade Federal de Viçosa, 1980. SEARLE, S.R. Linear models. New York: John Wiley & Sons,
1971. 532p.
SIGNORETTI, R.D. Consumo, digestibilidade, composição corporal, exigências nutricionais e eficiência de utiliza-ção da energia metabolizável para ganho de peso de bezerros holandeses. Viçosa, MG: Universidade Federal de Viçosa, 1998. 157p. Tese (Doutorado em Zootecnia) - Uni-versidade Federal de Viçosa, 1998.
TEDESCHI, L. O. Development and evaluation of models for the Cornell Net Carbohydrate and Protein System: energy requirements for maintenance and growth. Ithaca, NY: Cornell University, 2001. 395p. Thesis (Doctor of Philosophy) - Cornell University, 2001.
TEDESCHI, L.O.; BOIN, C.; FOX, D.G. et al. Energy requirement for maintenance and growth of Nellore bulls and steers fed high-forage diets. Journal of Animal Science, v.80,
p.1671-1682, 2002.
TEDESCHI, L.O.; FOX, D.G.; GUIROY, P.J. A decision support system to improve individual cattle management. 1. A mechanistic, dynamic model for animal growth. Agricultural Systems, v.79, p.171-204, 2004.
TEIXEIRA, L.B. Uréia, estilosantes e raspa de mandioca como suplementos do capim-elefante para bovinos em confinamento. Viçosa, MG: Universidade Federal de
Viço-sa, 1975. 34p. Dissertação (Mestrado em Zootecnia) - Uni-versidade Federal de Viçosa, 1975.
TEIXEIRA, J.C. Exigências de energia e proteína, composi-ção e área corporal e principais cortes da carcaça em seis grupos genéticos de bovídeos. Viçosa, MG: Universidade Federal de Viçosa, 1984. Tese (Doutorado em Zootecnia) -Universidade Federal de Viçosa, 1984.
VAN SOEST, P. J. Nutritional ecology of the ruminant. 2.ed. Ithaca: Cornell University Press, 1994. 476p.
VÉRAS, A.S. Consumo, digestibilidade, composição corporal e exigências nutricionais de bovinos Nelore alimentados com rações contendo diferentes níveis de concentrado.
Viçosa, MG: Universidade Federal de Viçosa, 1999. 166p. Tese (Doutorado em Zootecnia) - Universidade Federal de Viçosa, 1999.
WILLIAMS, C.B; JENKINS, T.G. A dynamic model of metabolizable energy utilization in growing and mature cattle. I. Metabolizable energy utilization for maintenance and support metabolism Journal of Animal Science, v.81, p.1371-1381, 2003.
Recebido em: 25/11/03