Use of threshold electrolyte concentration analysis to determine
salinity and sodicity limit of irrigation water
1Heitor R. de Menezes
2, Brivaldo G. de Almeida
3, Ceres D. G. C. de Almeida
4,
John M. Bennett
5, Emanuelle M. da Silva
6& Maria B. G. dos S. Freire
71 Trabalho selecionado do II INOVAGRI International Meeting, realizado de 13 a 16 de abril de 2014, Fortaleza - CE, Brasil 2 UFRPE. Recife, PE. E-mail: [email protected]
3 UFRPE. Recife, PE. E-mail: [email protected] (Autor correspondente) 4 UFRPE. São Lourenço da Mata, PE. E-mail: [email protected]
5 University of Southern Queensland, USQ, Toowoomba - Queensland Australia. E-mail: [email protected] 6 UFRPE. Recife, PE. E-mail: [email protected]
7 UFRPE. Recife, PE. E-mail: [email protected]
A B S T R A C T
This research studied threshold electrolyte concentration (TEC) of irrigation water and its effect on the infiltration rate of two contrasting soils from Pernambuco state, Brazil. The experiment was conducted in the Soil Chemistry and Salinity Laboratory of Federal Rural University of Pernambuco. Each soil was packed in five Buchner funnels, where one funnel from each soil was submitted to treatment with solution of electrical conductivity (EC) of 0.5, 1.0, 2.0, 4.0 or 8.0 dS m-1. For each funnel containing soil, an increasing ratio of NaCl to CaCl
2 was applied in a
treatment solution to achieve 10 increasing values of sodium adsorption ratio (SAR) from 0 to 100. These solutions were applied through a Mariotte bottle, with a constant hydraulic head of ~2 cm (pressure potential). After a liter of solution had drained, in the flux was collected for a known time interval, until steady state was reached. Darcy’s equation was used to calculate saturated hydraulic conductivity (Ksat) and a mathematical model used to calculate the TEC as a 20% reduction in Ksat. By increasing SAR similar behavior was noted between the two soils, whereby Ksat decreased, although the relativedecrease in Ksat was greater for SAR of 100 in the soil with higher clay content.
Uso da concentração eletrolítica para determinar o limite
de salinidade e sodicidade na água de irrigação
R E S U M O
Nesse trabalho foi estudado o limite da concentração eletrolítica (TEC) em dois solos distintos do estado de Pernambuco. O experimento foi conduzido no Laboratório de Química e Salinidade do Solo da UFRPE. Cada tipo de solo foi acondicionado em cinco funis de Buchner, os quais foram submetidos aos tratamentos compostos por cinco soluções com CE de 0,5; 1,0; 2,0; 4,0 e 8,0 dS m-1. Em cada funil foram adicionadas soluções com
relação crescente de NaCl/CaCl2 para obter 10 valores crescentes de relação de adsorção de sódio (RAS), de 0 a 100. As soluções foram aplicadas por meio de sistema tipo “frasco de Mariotte”, mantendo-se carga constante de ~2 cm (potencial de pressão). Após percolado um litro de solução, iniciou-se a coleta do volume drenado num intervalo de tempo conhecido, até o fluxo constante. Os dados foram usados na equação de Darcy, calculando-se a condutividade hidráulica saturada dos solos (Ksat) e, com modelo matemático, calculou-se a TEC, com uma redução de 20% da Ksat. Com o aumento da RAS, observou-se comportamento similar nos dois tipos de solo, no que se refere à redução da Ksat, embora o decréscimo relativo desta tenha sido maior no solo com elevado teor de argila, quando a RAS foi igual a 100.
Key words:
electrical conductivity
saturated hydraulic conductivity SAR
Palavras-chave: condutividade elétrica
condutividade hidráulica saturada RAS
Revista Brasileira de
Engenharia Agrícola e Ambiental
Campina Grande, PB, UAEA/UFCG – http://www.agriambi.com.br
Protocolo S09.14 – 05/02/2014 • Aprovado em 28/03/2014
v.18, (Suplemento), p.S53–S58, 2014
Introduction
Hydraulic conductivity is a key parameter for research involving soil water movement and may be affected by pore size and distribution of soil particles and mineralogical composition (Aguiar, 2001; Ma et al., 2008). When sodium is dominant in comparison to other cations in the exchange complex it can cause dispersion and transport soil colloids into deeper layers of the soil profile, as a result of electrochemical
interaction between cations and clay. Consequently, pore clogging, degradation of soil structure, increased bulk density and reduction of air and water movement occur, causing an overall reduction in soil water content and availability, as well as a reduction of soil fertility (Rhoades et al., 2000; Freire et al., 2003a; Dias & Blanco, 2010).
Dias & Blanco, 2010). However, scarcity of freshwater has led to the use of low quality waters for irrigation (high sodicity and salinity), especially in arid regions. Rengasamy & Olsson (1993), Raine et al. (2007) and Ezlit et al. (2010) state that high concentration of Na+ in irrigation water can result in
chemical instability of the soil, degradation of soil structure, clogging of pores, infiltration problems and reduction of soil hydraulic conductivity (K), due to exchange and equilibrium processes between the soil soluble and solid phases. On the other hand, studies show that several management practices affect the use of marginal-quality irrigation water with saline-sodic properties. Bennett & Raine (2012) and Ezlit et al. (2013) showed that a soil can tolerate high levels of sodicity, provided the salt concentration in irrigation water is high enough (above a critical threshold electrolyte concentration - TEC). Thus, high concentration of soluble salts in the soil solution has a positive effect on soil structure, due to an osmotic effect. However, low concentration of salts and/or high sodium concentration depending on the water quality can cause soil structural degradation.
Effect of dispersion induced by Na+ on soil properties and
water movement depends greatly on the relation between electrical conductivity (EC) and sodium adsorption ratio (SAR). SAR-EC interaction is based on a higher concentration of Ca2+ and Mg2+ which is capable of counteracting the
dispersive nature of the Na+, reducing the dispersion effects
on soil structure (Santos et al., 2010). However, Mg2+ is not as
efficient in flocculating clay as Ca2+, and can have a dispersive
effect (Rengasamy & Marchuk, 2011). Quirk & Schofield (1955), McNeal & Coleman (1966), Quirk (2001), and Bennett & Raine (2012) used 10, 25, 15, and 20% reduction in K, respectively, to determine the TEC and consequently the suitability of the soil for irrigation. The actual percentage used to define the TEC is somewhat arbitrary in that soil instability occurs as a function of Na+ added to the soil in the irrigation
water. However, an arbitrary percent reduction in K may not be a suitable measure of soil irrigation suitability for practitioners. For example, a 20% reduction of 1 mm d-1 saturated hydraulic
conductivity (a very low hydraulic conductivity) would result in 0.8 mm d-1, which is not practical for irrigation. On the
other hand, a 20% reduction of soil hydraulic conductivity of 100 mm h-1 results in 80 mm h-1, which is still a considerable
conductivity. Perhaps the former soil could have tolerated a 60% reduction in K, meaning poorer quality water could be used as a resource?
Therefore, this work studied TEC in two contrasting soils of Pernambuco, Northeast of Brazil, aiming to: 1) identify the extent to which poor quality water can be used for
irrigation without causing problems in soil structure; and 2) to demonstrate the applicability of an arbitrary percent reduction.
Material and Methods
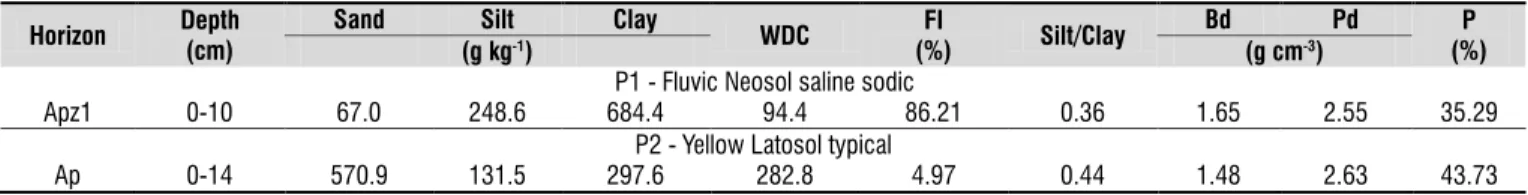
Disturbed soil samples collected from surface horizons of two selected profiles in Pernambuco (PE), Northeast of Brazil were used. Profile 1 (P1) located in the municipality of Ibimirim, located in Moxotó watershed, at coordinates Lat: 8° 32’ 10” S; Long: 37° 40’ 11” W, and 431 m of altitude was classified as Fluvic Neosol saline sodic. Profile 2 (P2) located in the municipality of São Lourenço da Mata, located in Capibaribe watershed, at coordinates Lat: 7° 58' 23 " S; Long: -35° 4' 43" W, and 95 m of altitude was classified as Yellow Latosol typical. Physical characteristics of these soils are shown in Table 1.
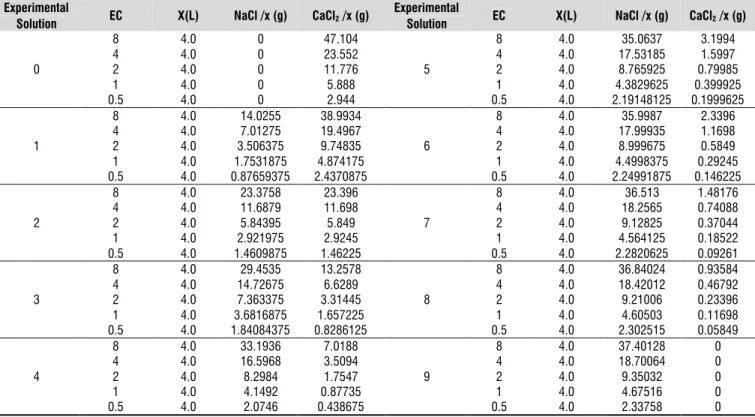
The solution applied to the two soils consisted of five values of electrical conductivity (EC = 0.5, 1.0, 2.0, 4.0 and 8.0 dS m-1)
and ten increasing values of sodium adsorption ratio (SAR), from 0 to ∞. The solutions used were prepared from solutions of NaCl and CaCl2, concocted from deionised water and the
respective salt. Five cores were prepared for each soil and each column was held constant at one of the five EC values, while SAR solutions were applied sequentially at the respective EC from low to high SAR.
Disturbed air-dried soil samples were obtained after crushing to pass a mesh sieve (< 2 mm). These were packed in PVC columns of 10 cm diameter and 15 cm long. At the bottom of each column a nylon net and a filter paper was used. Each column was filled with soil to 10 cm being uniformly added and homogenized to avoid layers with different compaction. At the bottom of the column a Buchner funnel was set, to collect drained solution. At the top of each column a Mariotte bottle with solutions was fitted, thereby obtaining constant head permeameter. To avoid disturbances on the soil surface inside columns when applying the solutions a fast filter paper was used at the top. Five columns for each soil were prepared and installed with a constant head permeameter.
Soil columns were immersed into the solution until two-thirds of the soil sample (6.7 cm) was immersed; this allowed wetting from the bottom up, eliminating the majority of air contained in soil pores. This system was maintained for 12 h, after which approximately 1000 mL of CaCl2 (2.0 dS m-1)
was applied at a constant hydraulic head of 2 cm on top of each soil column. Equilibrium was reached when EC of the effluent is similar to saturating solution (2.0 dS m-1). This
solution was used to determine the variability between cores. The constant head was removed for two hours and the soils
WDC - Water dispersible clay; FI - Flocculation index; Bd - Bulk density; Pd - Particle density; P - Porosity.
Horizon Depth (cm)
Sand Silt Clay
WDC FI
(%) Silt/Clay
Bd Pd P
(%)
(g kg-1) (g cm-3)
P1 - Fluvic Neosol saline sodic
Apz1 0-10 67.0 248.6 684.4 94.4 86.21 0.36 1.65 2.55 35.29
P2 - Yellow Latosol typical
Ap 0-14 570.9 131.5 297.6 282.8 4.97 0.44 1.48 2.63 43.73
allowed to drain, which allowed slumping from physical process caused by slaking, thus removing these from measured conductivities. A further 1000 mL of solution was then applied and the Mariotte apparatus were used to determine saturated hydraulic conductivity (Ksat).
After this, respective EC solutions (i.e. 0.5 to 8.0 dS m-1) of
CaCl2 were applied to determine the baseline Ksat, unaffected
by sodium induced dispersion, using the same procedure, except the 2 h drainage period. Subsequently, solutions of NaCl and CaCl2 with ten increasing values of SAR (Table 2)
were percolated through the five constant EC columns in the same way to determine the reduction in Ksat (rKsat) and calculate the TEC.
Darcy equation (Eq. 1) was used to calculate Ksat. The
discharge from the base of each column was measured at time intervals until a constant flux was recorded.
electrolyte concentration of the irrigation water were fitted by three dimensional response surfaces models using TableCurve 3D. The rKsat of the column was then calculated by dividing the hydraulic conductivity of the SAR > 0 water quality treatments by the hydraulic conductivity measured when the SAR = 0 water treatment was applied (i.e. the reduction was a ratio between 0 and 1 in relation to the baseline conductivity). Contour curves for 20, 40, 60 and 80% rKsat, where a 20% reduction represents
the TEC as described by Ezlit et al. (2013).
Results and Discussion
The curves obtained for rKsat are displayed for the
clay soil (Figure 1A), sandy soil (Figure 1B), with 0.8 rKsat
corresponding to a 20% reduction and the TEC value obtained for the particular soil. The curves representing the TEC of these soils suggest that both the clay and the sandy soil are reasonably resilient to marginal quality irrigation water application with high SAR. For example, at an EC of 1 dS m-1 the clay soil remains stable provided the SAR<~16,
while for the sandy soil, stability is maintained provided the SAR<~22. For SAR greater than these respective values, it is necessary to raise EC of the irrigation water to avoid further reduction in hydraulic conductivity. This process is due to high ionic strength of the saline solution that minimizes the effect of sodium concentration (an osmotic effect), thus allowing irrigation with water of high SAR without severely altering soil structure via clay dispersion. For both of these soils, marginal quality saline-sodic water might be considered as a resource, although this depends of course on the groundwater quality. However, Bennett & Raine (2012) and Marchuk & Rengasamy
Experimental
EC X(L) NaCl /x (g) CaCl2/x (g)
Experimental
EC X(L) NaCl /x (g) CaCl2/x (g)
Solution Solution
0
8 4.0 0 47.104
5
8 4.0 35.0637 3.1994
4 4.0 0 23.552 4 4.0 17.53185 1.5997
2 4.0 0 11.776 2 4.0 8.765925 0.79985
1 4.0 0 5.888 1 4.0 4.3829625 0.399925
0.5 4.0 0 2.944 0.5 4.0 2.19148125 0.1999625
1
8 4.0 14.0255 38.9934
6
8 4.0 35.9987 2.3396
4 4.0 7.01275 19.4967 4 4.0 17.99935 1.1698
2 4.0 3.506375 9.74835 2 4.0 8.999675 0.5849
1 4.0 1.7531875 4.874175 1 4.0 4.4998375 0.29245
0.5 4.0 0.87659375 2.4370875 0.5 4.0 2.24991875 0.146225
2
8 4.0 23.3758 23.396
7
8 4.0 36.513 1.48176
4 4.0 11.6879 11.698 4 4.0 18.2565 0.74088
2 4.0 5.84395 5.849 2 4.0 9.12825 0.37044
1 4.0 2.921975 2.9245 1 4.0 4.564125 0.18522
0.5 4.0 1.4609875 1.46225 0.5 4.0 2.2820625 0.09261
3
8 4.0 29.4535 13.2578
8
8 4.0 36.84024 0.93584
4 4.0 14.72675 6.6289 4 4.0 18.42012 0.46792
2 4.0 7.363375 3.31445 2 4.0 9.21006 0.23396
1 4.0 3.6816875 1.657225 1 4.0 4.60503 0.11698
0.5 4.0 1.84084375 0.8286125 0.5 4.0 2.302515 0.05849
4
8 4.0 33.1936 7.0188
9
8 4.0 37.40128 0
4 4.0 16.5968 3.5094 4 4.0 18.70064 0
2 4.0 8.2984 1.7547 2 4.0 9.35032 0
1 4.0 4.1492 0.87735 1 4.0 4.67516 0
0.5 4.0 2.0746 0.438675 0.5 4.0 2.33758 0
Table 2. Solution composition sat
V L
K
A t L h
=
+
where:
Ksat - hydraulic conductivity of saturated soil, cm s-1
V - effluent collected volume, cm3
L - soil sample height, cm
A - cross-area of the column soil, cm2
t - time, s
h - solution above soil surface height, cm
A mathematical model was then used to calculate TEC relationships (Ezlit et al., 2013). Multiple regression models of relative hydraulic conductivity (rKsat) as a function of exchangeable sodium percentage (ESP) estimated and
(2012) have shown that the TEC is highly soil site specific. This means that Brazilian soils should be investigated on a case to case basis for groundwater irrigation suitability in the future.
In a study using soils of Pernambuco (Northeast of Brazil) under application of water with increasing values of SAR and EC, Freire et al. (2003a; b) similarly observed different behaviors for each soil. However, common to all soils was the trend for decrease in rKsat with increasing SAR, especially
when solution salinity was low, which is a similar trend to that observed in our work and previous research (Quirk & Schofield, 1955; Bennett & Raine 2012; Ezlit et al., 2013). Additionally, Freire et al. (2003a; b) observed that soils with higher clay tended to have more evident decrease in Ksat, which is in general agreement with what was observed in this study, although we only observed this for a single clay and sandy soil. However, the work of Bennett & Raine (2012) suggests that traditionally accepted mechanisms, such as clay content, clay mineralogy and soil organic matter did not correlate well with TEC. Hence, while Friere et al. (2003a; b) observed trends relating to clay content, further investigation concerning the controlling mechanisms of TEC, including clay content, clay mineralogy and clay net negative charge (Rengasamy & Marchuk, 2011).
The interaction between EC-SAR is important in determining management techniques, for example if it rains ,or good quality irrigation water with low salinity is applied, in an area previously irrigated with a saline-sodic water, soil solution salts become diluted and/or leached. Thus, as soil EC reduces more rapidly in soils as compared to soil solid phase sodicity, soil infiltration and soil structure could be affected (Sumner, 1993; Mace & Amrhein, 2001). The graphs produced for the clay and the sandy soil (Figures 1A and B) could be used in the calculation of potential, or expected, soil solution dilution and adjustment could be made to either the soil solution (addition of a CaCl2, or another soluble Ca
source), or a Ca amendment such as gypsum could be applied to the soil surface to buffer the effect of soil solution dilution. Johnston et al. (2008; 2011) have shown that land application of gypsum in combination with a sulfur source was successful in maintaining soil permeability after significant rainfall of soil previously irrigated with coal seam associated water (SAR > 20), as compared to untreated coal seam associated water.
As shown in Figure 1B, there was a distinct difference in the 40, 60 and 80% reduction in Ksat despite somewhat similar 20%
reduction curves. For the clay soil, the difference between a 20 and 80% reduction at the displayed EC values was always at an SAR increase of less than 13. On the other hand, for the sandy soil then 60 and 80% reductions in Ksat could not be displayed
on the graph due to them occurring at SAR>60 (at least an increase in SAR of 44). This indicates that the sandy soil supports larger increases in SAR without requiring significant increases in EC for the maintenance of Ksat when compared to clay soil (Figure 1A), provided a reduction in Ksat greater than 20% is
acceptable. Threshold electrolyte concentration (TEC) uses a somewhat arbitrary reduction in Ksat as a measure to evaluate the soil susceptibility to water salinity and sodicity. Several values of reduction in hydraulic conductivity to determine the TEC have already been proposed in the literature, for example, reduction of 10% by Quirk & Schofield (1955), 25% by McNeal & Coleman (1966), 15% by Quirk, (2001) and 20% by Ezlit et al. (2013). The basis of this being the fact that Ksat decreases gradually with increasing sodicity and that there is not a single point reduction that can be considered the true TEC (Quirk & Schofield, 1955). Hence, practically acceptable reduction in Ksat might be a better management guideline, provided the true conductivity of the soil is considered.
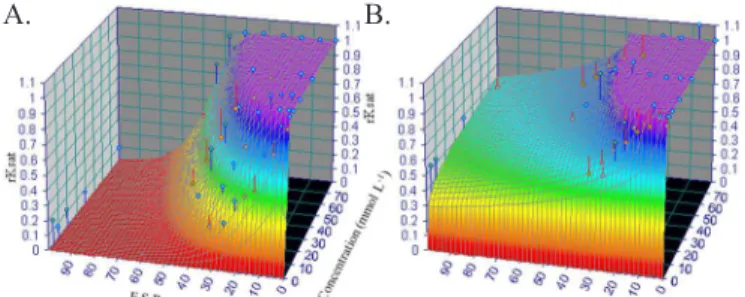
The rKsat was three dimensionally evaluated as function of salinity and sodicity (Figure 2), from which the contours at 20, 40, 60 and 80% reduction were extracted to produce Figure 1. Again, distinct behavior of two soils was observed. rKsat in the clay soil was severely reduced when irrigation water with very low EC was used, despite the exchangeable sodium percentage (ESP) not being excessively high (Figure 2A). Then, higher concentrations of salts in irrigation water are needed to obtain admissible values of hydraulic conductivity in the clay soil. Similarly, where ESP was above 50%, regardless of EC, extremely high reductions in hydraulic conductivity were observed. On the other hand, the sandy soil maintained hydraulic conductivity greater than 40% of that of the baseline for the majority of solution combinations, even in low EC and high SAR circumstances (Figure 2B). It is likely that the high sand content (57%) of the sandy soil facilitated a greater number of macropores and less susceptibility to pore blockage. Whilst Figure 1 suggests that the 20% rKsat curves (0.8 rKsat) are somewhat similar for the clay and
sandy soil, to this point the initial Ksat has not been considered.
A. B.
Figure 1. Threshold Electrolyte Concentration Curve. Clay Soil (A) and Sandy Soil (B)
Figure 2. Surface fit - Equilibrium ESP and Soil Solution
Concentration in two soils of Pernambuco (Northeast
of Brazil). Clay Soil (A) and Sandy Soil (B)
A. B.
The 60 and 80% reduction curves are not displayed for the sandy soil as they are beyond the axes displayed
The baseline conductivities used for the clay soil and sandy soil, respectively, were 0.82 (±0.29) mm h-1 and 154.1 (± 22.6) mm
h-1 (measured at 2 dS m-1 CaCl
2). In the case of the clay soil,
the initial conductivity is so low that any percent reduction in hydraulic conductivity has minimal effect; i.e. it is practically meaningless. In contrast, an 80% reduction in Ksat for the sandy
soil results in 30.82 mm h-1, which is still considerable. In this
case, irrigation with extremely poor saline-sodic water could be feasible. It is noted that these conductivities were measured on disturbed samples (< 2 mm) with greatly homogenized pore networks that could not be expected in the field (lower conductivity could reasonably be expected in the field), but this provides sufficient example to begin the discussion about the usefulness of an arbitrary reduction in hydraulic conductivity in defining TEC and the practical implications of this. Future land management of Brazilian soils and potential irrigation water sources should consider the TEC of the soil, the in-field Ksat of
the soil surface (the throttle to infiltration), as well as the EC and SAR of the irrigation water. Further investigation of acceptable minimum irrigation infiltration rates for Brazilian soils should also be considered.
Additionally, while Almeida Neto (2007), using a Red Argisol, found high sensitivity to groundwater quality in terms of clay dispersion that could be mitigated by using water with EC greater than 6.0 dS m-1 and SAR less than 10. In this study
it was found that high SAR water could be tolerated at EC > 1 dS m-1, the salinity effect on plants must also be considered.
Plant effects were not considered in this investigation, but future work must consider multiple strategies for agricultural uses of salt affected soils and evaluate the development of plants under these conditions. While high salinity induces a positive osmotic effect on soil structure, it may reduce crop development. Marginal quality saline-sodic water is not a resource if it can not be utilized to produce crops and/or vegetation for improved grazing. Hence, irrigation strategies must also consider the salt tolerance of the intended crop.
Conclusions
1. Soils behave differently to increasing irrigation water sodium adsorption ratio at the same electrical conductivity and that this is important for the consideration of suitability of the soil for the use of marginal quality irrigation water.
2. Marginal quality irrigation water can be used as a resource, however, the initial hydraulic conductivity (in field) of the soil should also be considered.
3. In soils with initially high hydraulic conductivities, utilization of a minimum acceptable infiltration rate of water should be prefered, rather than a percent reduction in hydraulic conductivity.
Literature Cited
Aguiar, A. B. O emprego do permeâmetro de Guelph na determinação da permeabilidade do solo, de camadas de lixo e sua cobertura. Rio de Janeiro : COPPE/UFRJ. 2001. 90p. Dissertação Mestrado
Almeida Neto, O. B. Dispersão da argila e condutividade hidráulica em solos com diferentes mineralogias, lixiviados com soluções salino-sódicas.Viçosa: UFV. 2007. 83p. Tese Doctor Scientiae
Bennett, J. M.; Raine, S. R. The soil specific nature of threshold electrolyte concentration analysis. In: 5th Joint Australian and New Zealand Soil Science Conference: Soil Solutions for Diverse Landscapes (SSA 2012), Hobart, Australia, 2012. http://eprints.usq.edu.au/id/eprint/22151.
Dias, N. da S.; Blanco, F. F. Efeito dos sais no solo e na planta. In: Gheyi, H. R.; Dias, N. da S.; Lacerda, C. F. de Manejo da salinidade na agricultura: Estudos básicos e aplicados. Fortaleza, INCTSal, 2010. p.129-141.
Ezlit, Y. D.; Bennett, J. McL.; Raine, S. R.; Smith, R. J. Modification of the McNeal clay swelling model improves prediction of saturated hydraulic conductivity as a function of applied water quality. Soil Science Society of America Journal, v.77, p.2149-2156, 2013.
Ezlit, Y. D.; Smith, R. J.; Raine S. R. A review of salinity and sodicity in irrigation. Cooperative Research Centre for Irrigation Futures, n. 01/10, Toowoomba, 2010. 70p. Irrigation Matters Series
Freire, M. B. G. S.; Ruiz, H. A.; Ribeiro, M. R.; Ferreira, P. A.; Alvarez V., V. H.; Freire, F. J. Condutividade hidráulica de solos de Pernambuco em resposta à condutividade elétrica e RAS da água de irrigação. Revista Brasileira de Engenharia Agrícola e Ambiental, v.7, p.45-52, 2003a.
Freire, M. B. G. S.; Ruiz, H. A.; Ribeiro, M. R.; Ferreira, P. A.; Alvarez V.; V. H., Freire, F. J. Estimativa do risco de sodificação de solos de Pernambuco pelo uso de águas salinas. Revista Brasileira de Engenharia Agrícola e Ambiental, v.7, p.227-232, 2003b.
Johnston, C. R.; Vance, G. F.; Ganjegunte, G. K. Irrigation with coalbed natural gas co-produced water. Agricultural Water Management, v.95, p.1243-1252, 2008.
Johnston, C. R.; Vance G. F.; Ganjegunte, G. K. Soil property changes following irrigation with coalbed natural gas water: role of water treatments, soil amendments and land suitability. Land Degradation & Development, v.24, p.350-362, 2011.
Ma, W.; Mao, Z.; Yu, Z.; van Mensvoort, M. E. F.; Driessen, P. M. Effects of saline water irrigation on soil salinity and yield of winter wheat-maize in North China Plain. Irrigation Drainage System, v.22, p.3-18. 2008.
Mace, J. E.; Amrhein, C. Leaching and reclamation of a soil irrigated with moderate SAR waters. Soil Science Society America Journal, v.65, p.199-204, 2001.
Marchuk, A.; Rengasamy, P. Threshold electrolyte concentration and dispersive potential in relation to CROSS in dispersive soils. Soil Research, v.50, p.473-481, 2012.
Quirk, J. P. The significance of the threshold and turbidity concentrations in relation to sodicity and microstructure. Australian Journal of Soil Research, v.39, p.1185-1217, 2001. Quirk, J. P.; Schofield R. K. The effect of electrolyte concentration on soil permeability. Australian Journal of Soil Research, 6, p.163-178. 1955.
Raine, S. R.; Meyer, W. S.; Rassam, D. W.; Hutson, J. L. Soil-water and solute movement under precision irrigation- knowledge gaps for managing sustainable root zones. Irrigation Science. v.26, p.91-100, 2007.
Rengasamy, P., Marchuk, A. Cation ratio of soil structural stability. Soil Research, v.49, p.280-285, 2011.
Rengasamy, P.; Olsson, K. A. Irrigation and sodicity. Australian Journal of Soil Research, v.29, p.821-837, 1993.
Rhoades, J. D.; Kandiah, A.; Mashali, A. M. Uso de águas salinas para produção agrícola. Campina Grande: UFPB, 2000. 117p. Estudos FAO Irrigação e Drenagem, 48
Santos, R. V.; Cavalcante, L. F.; Vital, A. F. M. Interações salinidade-fertilidade do solo. In: Gheyi, H. R.; Dias, N. da S.; Lacerda, C. F. de. Manejo da salinidade na agricultura:
Estudos básicos e aplicados. Fortaleza, INCTSal, 2010.
p.221-252.