GYPSUM-SATURATED WATER TO RECLAIM ALLUVIAL
SALINE SODIC AND SODIC SOILS
Karien Rodrigues da Silveira1; Mateus Rosas Ribeiro1*; Luiz Bezerra de Oliveira2; Richard John Heck3; Rachel Rodrigues da Silveira1
1
UFRPE Depto. de Agronomia, R. Dom Manoel de Medeiros, s/nº Dois Irmãos 52171900 Recife, PE Brasil.
2
Embrapa Solos/UEP - Recife, R. Antonio Falcão, 402 - 51020-240 - Recife, PE - Brasil. 3
University of Guelph - Dept. of Land Resources Science - Guelph, Ontario - N1G 2W1 - Canada. *Corresponding author <[email protected]>
ABSTRACT: Inadequate management of soil and irrigation water contribute to soil degradation, particularly in the alluvial areas of Northeast Brazil, where salinity and sodicity are already common features. This study evaluates the effects of the addition of gypsum in the irrigation water on physical and chemical properties of soils with different levels of salinity and sodicity. Samples were collected at the Custódia irrigation area of Brazil, predominantly covered by alluvial soils. Leaching tests using simulated irrigation water classified as C3S1, and gypsum-saturated irrigation water were carried out in soil columns of 20 and 50 cm depth. Soil leaching with gypsum saturated water (T2) resulted in an increase in the amounts of exchangeable calcium and potassium, and in a decrease of soil pH, in relation to the original soil (T0), with significant statistical differences to the treatment using only water (T1). There was a reduction in the electrical conductivity, exchangeable sodium and exchangeable sodium percentage in both treatments (T1 and T2), with treatment T2 being more effective in the leaching of soil sodium. No changes of electrical conductivity, calcium and pH in depth were observed, but the 20 - 50 cm layer presented higher amounts of magnesium, sodium and exchangeable sodium percentage. Gypsum saturated water improved the hydraulic conductivity in both layers. The use of gypsum in the irrigation water improved soil physical and chemical properties and should be considered as an alternative in the process of reclamation of saline-sodic and sodic soils in Northeast Brazil. Key words: salt affected soils, irrigation, reclamation, management
ÁGUA SATURADA COM GESSO NA RECUPERAÇÃO DE SOLOS
ALUVIAIS SALINO-SÓDICOS E SÓDICOS
RESUMO: O manejo inadequado do solo e da água de irrigação contribui para a degradação dos solos, particularmente nas áreas aluviais do Nordeste do Brasil, onde a salinidade e a sodicidade são características comumente observadas. Avaliaram-se os efeitos da adição do gesso na água de irrigação, sobre as propriedades físicas e químicas de solos com diferentes níveis de salinidade e sodicidade. Foram utilizadas amostras de solos provenientes do perímetro irrigado de Custódia, em Pernambuco, coletadas em uma área de solos aluviais. Foram feitos testes de lixiviação com água de composição semelhante à do açude de Custódia, classificada como C3S1, e com água saturada com gesso, em colunas de solo de 20 e 50 cm de profundidade. A lixiviação do solo com água saturada com gesso (T2) aumentou os teores de cálcio e potássio do solo e reduziu o pH em relação ao solo original (T0), diferindo do tratamento de lixiviação com água (T1). Houve redução da condutividade elétrica, do teor de sódio trocável e da percentagem de sódio trocável do solo nos dois tratamentos (T1 e T2), sendo que o tratamento T2 mostrou-se mais eficiente quanto à remoção do sódio. Os valores de condutividade elétrica, cálcio e pH não diferiram nas duas profundidades, mas a camada de 20 - 50 cm apresentou maiores teores de magnésio, sódio e percentagem de sódio trocável. A água saturada com gesso aumentou a condutividade hidráulica do solo em todo o perfil estudado. O uso do gesso na água de irrigação promoveu uma melhoria das condições físicas e químicas dos solos, podendo ser uma alternativa no processo de recuperação de solos salino-sódicos e sódicos no Nordeste do Brasil. Palavras-chave: solos afetados por sais, irrigação, correção, manejo
INTRODUCTION
Irrigation is the most important practice to
in soil salinization and alkalization, reducing soil pro-ductivity and threatening the sustainability of the agri-cultural system. Inadequate management of soil and irrigation water can also contribute to soil degradation, particularly in the alluvial areas of Northeast Brazil, where salinity and sodicity are already common fea-tures.
Studies on the reclamation of salt affected soils have been carried out for decades. Reclamation can be considered a high cost operation, requiring good quality water and the use of chemical amendments. However, it can technically be accomplished only in places where irrigation and drainage are available. Al-though saline soils only require salt leaching, the rec-lamation of saline-sodic and sodic soils requires the exchange of sodium to calcium before the leaching of soluble salts (Kelley, 1951; USSL hStaff, 1954; Pizarro, 1978; Bresler et al., 1982). Gypsum is the most com-mon amendment used in the reclamation of saline-sodic and sodic soils, due to its great availability and low price (Santos & Ferreyra, 1997).
Studies carried out in Brazil and other coun-tries (Shainberg et al., 1982; Pereira et al., 1986; Melo et al., 1988; Barros & Magalhães, 1989; Chaves & Rolim, 1997) about the use of gypsum for the recla-mation of sodic soils have shown that the low solu-bility of gypsum affects its efficiency when applied to the soil, requiring larger amounts of water to dissolve it and longer periods of time for the reaction than other amendments. The efficiency of the gypsum depends on several factors such as type of application, solu-bility, particle size, soil solution composition and soil physical properties.
Gypsum saturated irrigation water improves the infiltration rate due to the fast exchange reaction with soil exchangeable sodium and the increase in salt concentration of the soil solution, improving its effi-ciency and reducing the amount of applied gypsum (Axtell & Doneen, 1949; Anjos, 1993). The applica-tion of gypsum in the irrigaapplica-tion water has shown bet-ter results with low salinity wabet-ters (EC < 0.2 dS m-1) or with water of high SAR values, and low to moder-ate salinity (EC < 1 dS m-1). When water salinity is high the application into the soil is recommended (Ayers & Westcot, 1991).
The objective of this study was to evaluate the efficacy of gypsum applied in the irrigation water for the reclamation and improvement of saline-sodic and sodic alluvial soils in Northeast Brazil.
MATERIAL AND METHODS
Soil characteristics
Soils belong to the irrigation area of Custódia
municipality, in the Sertão Zone of the Pernambuco State, Brazil (8°05’ S, 37°37’ W). Samples were col-lected from the 0 - 20 and 20 - 50 cm depths, at six locations with different salinity and sodicity levels, ei-ther in surface and subsurface layers. Sites were cho-sen according to a previous study in a 16 ha farm block, characterized by alluvial soils classified as Neossolos Flúvicos (Fluvents), according to the Bra-zilian system of soil classification (Ribeiro, 1999). Soil samples were air dried and ground to pass a 2 mm sieve to obtain the fine earth fraction used in the ex-periment.
Packing and leaching of soil columns
The experiment involved leaching tests in or-der to evaluate the effect of gypsum applied in the ir-rigation water on the improvement of soil physical and chemical properties. The tests were carried out using water with similar composition to the Custódia reser-voir, classified as C3S1 (USSL Staff, 1954), gypsum saturated water, and soil columns with 20 and 50 cm height. The experiment was carried out under labora-tory conditions, using disturbed soil samples and a sys-tem of inverted flow of water, with constant hydrau-lic head. Details of the equipment can be observed in Figure 1.
Soil columns were reconstructed in PVC tubes, using the fine earth from samples collected at 0 - 20 and 20 - 50 cm depths, based on an average soil bulk density of 1.52 kg dm-3 and an internal area of 17.35 cm2. Tubes were filled in portions of 52.7 g of fine earth, which is equivalent to 2.0 cm of col-umn thickness, followed by packing. Soil colcol-umns of 20 and 50 cm were mounted in an inverse position, from the top soil to the bottom.
Soil leaching was carried out in two steps: first, soil columns of 20 and 50 cm depth were leached
with water classified as C3 S1, and the leaching solu-tion volume measured each 24 hours. In the second step, with new columns, gypsum-saturated water was used. Solutions were applied with the soil at -0.01 MPa of matric potential. The measurement finished when the amount of the leaching solution was constant, which occurred after 10 days. Electrical conductivity and pH were measured after each collection.
The experiment was set up in a random de-sign with three treatments: original soil (T0), water leached soil (T1) and gypsum saturated water leached soil (T2); two layers (0 - 20 and 20 - 50 cm) and 6 sampling locations. The statistical analysis of variance were proceeded according to Gomes (1974), and means were compared by the Tukey test P = 0.05.
Soil physical analyses
Physical analyses were carried out using the EMBRAPA (1997) methodology, except for the soil hydraulic conductivity, determined by means of the equipment shown in Figure 1. Particle size distribu-tion (Bouyoucos hydrometer method), soil bulk den-sity (cylinder method) and moisture content at tensions of 0.033 and 1.5 MPa (Richards, 1974) were determined. During the leaching experiment the saturated hydraulic conductivity (K, cm h-1) was measured at each 24 h and determined by applica-tion of Darcy’ s law, in an inverted flow system: K = [(Q/A)]L/(h - L), where Q = volume passing through soil sample (cm3 h-1); A = transversal sec-tion of the soil sample (cm2); h = hydraulic head (cm); L = Length of the soil column (cm).
Soil chemical analyses
Soil chemical analyses were also determined according to the EMBRAPA (1997) methodology. Be-fore the leaching test, soil pH, pH and electrical con-ductivity of the saturation extract (EC), soluble salts, exchangeable cations, cation exchange capacity (CEC) and exchangeable sodium percentage (ESP) were de-termined. After leaching, analysis of the soil exchange-able complex, EC and pH of the leaching solution were also performed.
RESULTS AND DISCUSSION
Soil properties before leaching
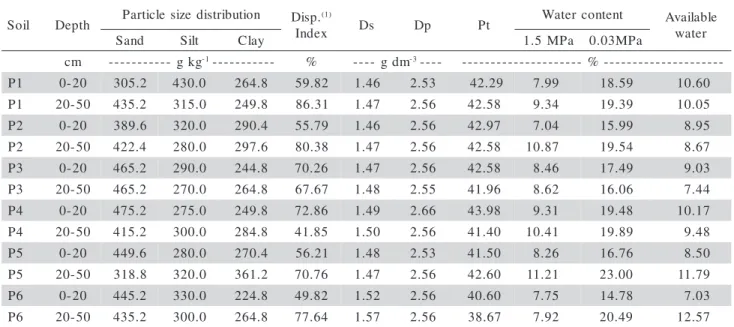
Soil samples are dominantly medium textured, with larger amounts of silt than clay (Table 1). The dispersion indexes were larger than 60% in 83% of samples in the subsurface layer (20 - 50 cm), which define soils with poor structural arrangement and low permeability, requiring improvement of the drainage conditions. Soil and particle densities showed 1.49 and 2.56 kg dm-3
mean values, respectively, and total po-rosity varied from 38.7 to 43.0 %.
In the saturation extract (Tables 2 and 3), the pH ranged from 7.58 and 8.68, with 90% of the samples with pH values equal or greater than 8.0; the electrical conductivity varied between 1.15 and 8.76 dS m-1, with 50% of the values, below 4.0 dS m-1, classified as non saline and 50% classified as saline. The concentration of soluble ions in most samples was Na+ > Ca2+ > Mg2+ >K+, for the cations, and Cl- > HCO3- > SO42- > CO32-, for the anions.
Table 1 - Physical properties of the soil samples before leaching (T0).
(1)Dispersion Index = 100 – GF, where GF = (total clay – disperse clay)/ total clay * 100. Ds = soil bulk density. Dp = particle density. Pt = total porosity
l i o
S Depth Particlesizedistribution Disp.
) 1 (
x e d n
I Ds Dp Pt
t n e t n o c r e t a
W Available r e t a w d
n a
S Silt Clay 1.5 MPa 0.03MPa
m
c --- gkg-1----------- % ---- gdm-3---- --------------------- % --------------------
-1
P 0-20 305.2 430.0 264.8 59.82 1.46 2.53 42.29 7.99 18.59 10.60 1
P 20-50 435.2 315.0 249.8 86.31 1.47 2.56 42.58 9.34 19.39 10.05 2
P 0-20 389.6 320.0 290.4 55.79 1.46 2.56 42.97 7.04 15.99 8.95 2
P 20-50 422.4 280.0 297.6 80.38 1.47 2.56 42.58 10.87 19.54 8.67
3
P 0-20 465.2 290.0 244.8 70.26 1.47 2.56 42.58 8.46 17.49 9.03 3
P 20-50 465.2 270.0 264.8 67.67 1.48 2.55 41.96 8.62 16.06 7.44 4
P 0-20 475.2 275.0 249.8 72.86 1.49 2.66 43.98 9.31 19.48 10.17 4
P 20-50 415.2 300.0 284.8 41.85 1.50 2.56 41.40 10.41 19.89 9.48
5
P 0-20 449.6 280.0 270.4 56.21 1.48 2.53 41.50 8.26 16.76 8.50 5
P 20-50 318.8 320.0 361.2 70.76 1.47 2.56 42.60 11.21 23.00 11.79 6
P 0-20 445.2 330.0 224.8 49.82 1.52 2.56 40.60 7.75 14.78 7.03 6
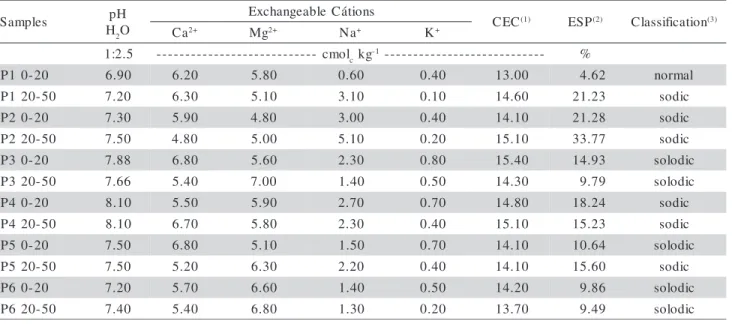
Soil pH values indicate slightly alkaline soil re-action in most samples. In general CEC values were greater than in the saline-sodic alluvial soil described by Barros & Magalhães (1989), from the Moxotó Ir-rigation Perimeter (CEC = 10.88 cmolc kg-1
), and smaller than the ones described by Melo (1991) (19.60 cmolc kg-1).
With exception to sample P10 - 20, all samples showed sodic or solodic properties being, therefore, adequate to the objectives of this study. Sodium ex-changeable percentages of samples P120-50; P20-20; P220-50; P40-20; P420-50 and P520-50 were greater than the critical value of 15%, used to define the sodic prop-erty (Richard, 1974) and are in the same range of ESP values observed by Barros & Magalhães (1989) and Pereira (1981) in the soils of the Moxotó Irrigation Area-PE. Exchangeable sodium percentages (ESP) con-tribute to poor soil physical conditions, and several au-thors have shown their negative effects on soil prop-erties, even in values smaller than 15% percent (Raij, 1986; Sumner, 1995).
Based on the electrical conductivity results of the saturation extract (Table 2), soil pH and exchange-able sodium percentage (Texchange-able 3), 25% of samples were classified as non saline, 16.67% as saline, 41.67% as saline-sodic and 16.67% as sodic (Richard, 1974), involving several levels of salinity and sodicity, empha-sizing the great variability of these properties in allu-vial plains.
Soil properties after leaching
Exchangeable sodium percentage was not re-duced in all samples after leaching with water (T1),
remaining high in samples P120-50 and P220-50, with val-ues of 14.71 and 32.25%, respectively (Table 4). Moreover, half of the samples still exhibited ESP > 7, which is considered limiting for soil physical stability. These values were observed in the 20 - 50 cm layer, where water infiltrates with greater difficulty due to the lower hydraulic head. These results also demon-strate the importance of the exchange of sodium by calcium in order to improve the hydraulic conductiv-ity and leaching.
Comparing the difference between soil ESP of T0 and T1 (ESP∆i–f), it was observed that the non sa-line samples (P10-20, P320-50 and P620-50) showed small increases, while the others had their ESP decreased in relation to the original sample.
Salt concentration increased in sample P220-50, due to its high exchangeable sodium percentage which inhibited leaching. Furthermore this layer was enriched by salt percolation from the surface layer (0 - 20 cm). Most samples became non-saline after leaching. Equi-librium was observed between the applied water and the soil solution after leaching, with EC values close to that of water (EC = 1.07 dS m-1). Leaching the soil with gypsum saturated water (Table 4, T2) reduced ESP of all samples to values smaller than the critical (ESP ≥ 15), with major reduction in the layer 0 - 20 cm. An increase in the ESP of the non-saline samples was observed in a smaller proportion than in the samples submitted to treatment T1, except for sample P320-50.
The difference between the initial and final con-centration (EC∆i–f) showed that salinity increased in
s e l p m a
S pH EC(1) SP(2) Solublecations
O C 32
-s n o i n a e l b u l o S
R A S (3)
a
C 2+ Mg2+ Na+ K+ HCO
3 - SO
4 -2 Cl
-m S
d -1 % ------------------------------------mmol cL
1
- -----------------------------------
-0 2 -0 1
P 7.58 1.15 36.62 4.25 4.52 4.60 1.39 0.00 10.00 1.08 3.00 2.19
0 5 -0 2 1
P 8.05 5.23 33.30 12.10 11.12 35.22 0.13 0.00 3.00 2.38 48.00 10.33
0 2 -0 2
P 8.02 8.00 34.61 19.90 15.17 41.39 1.40 0.00 19.00 0.83 60.00 9.88
0 5 -0 2 2
P 8.62 8.76 39.33 9.88 13.54 63.78 1.19 1.00 23.50 9.89 52.00 18.64
0 2 -0 3
P 8.06 3.95 36.01 10.80 8.94 26.08 2.00 0.00 20.00 0.17 27.00 8.30
0 5 -0 2 3
P 8.22 3.32 36.49 8.81 8.23 17.85 1.13 0.00 14.00 5.00 18.00 6.11
0 2 -0 4
P 8.68 8.10 35.53 9.30 8.70 70.63 0.36 2.00 2.00 5.31 68.00 23.54
0 5 -0 2 4
P 8.20 3.06 33.31 7.05 7.35 18.20 0.39 0.00 13.50 1.90 26.00 6.78
0 2 -0 5
P 8.55 4.04 38.04 10.60 14.14 17.43 1.75 1.00 12.70 7.96 19.00 4.95
0 5 -0 2 5
P 8.00 3.68 35.04 12.80 18.19 17.51 1.28 0.00 9.50 7.80 19.00 4.45
0 2 -0 6
P 8.03 7.30 35.98 33.10 12.99 34.73 1.34 0.00 16.50 9.00 49.00 7.23
0 5 -0 2 6
P 8.04 3.27 36.97 10.90 7.46 21.26 0.42 0.00 8.00 13.0 17.00 7.02 Table 2 - Results of the samples saturation extracts before leaching treatments (T0).
s e l p m a
S pH
H2O
s n o i t á C e l b a e g n a h c x E C E
C (1) ESP(2) Classification(3)
a
C 2+ Mg2+ Na+ K+
5 . 2 :
1 --- cmolc kg-1---------------------------- %
0 2 -0 1
P 6.90 6.20 5.80 0.60 0.40 13.00 4.62 normal
0 5 -0 2 1
P 7.20 6.30 5.10 3.10 0.10 14.60 21.23 sodic
0 2 -0 2
P 7.30 5.90 4.80 3.00 0.40 14.10 21.28 sodic
0 5 -0 2 2
P 7.50 4.80 5.00 5.10 0.20 15.10 33.77 sodic
0 2 -0 3
P 7.88 6.80 5.60 2.30 0.80 15.40 14.93 solodic 0 5 -0 2 3
P 7.66 5.40 7.00 1.40 0.50 14.30 9.79 solodic
0 2 -0 4
P 8.10 5.50 5.90 2.70 0.70 14.80 18.24 sodic
0 5 -0 2 4
P 8.10 6.70 5.80 2.30 0.40 15.10 15.23 sodic
0 2 -0 5
P 7.50 6.80 5.10 1.50 0.70 14.10 10.64 solodic 0 5 -0 2 5
P 7.50 5.20 6.30 2.20 0.40 14.10 15.60 sodic
0 2 -0 6
P 7.20 5.70 6.60 1.40 0.50 14.20 9.86 solodic
0 5 -0 2 6
P 7.40 5.40 6.80 1.30 0.20 13.70 9.49 solodic
Table 3 - Cation exchange complex of soil samples before leaching (T0).
(1)CEC = Cation exchange capacity. (2)ESP = Exchangeable sodium percentage. (3)Classification according to ESP levels.
s e l p m a
S pH
H2O
s n o i t á C e l b a e g n a h c x E P S
E (1) ESP 2 ()
∆i-f
C
E (3) EC ) 4 (
∆i-f
n o i t a c i f i s s a l
C (5)
a
C 2+ Mg2+ Na+ K+
5 . 2 :
1 --- cmolckg-1-------------- % dSm-1
r e t a w h t i w g n i h c a e L -1 T 0 2 -0 1
P 7.10 7.30 5.15 0.65 0.56 4.76 -0.14 1.15 0.00 NS 0 5 -0 2 1
P 7.85 6.50 5.65 2.13 0.20 14.71 6.52 1.31 3.92 SO 0
2 -0 2
P 7.60 6.40 4.75 1.00 0.79 7.73 13.55 1.16 6.84 NS 0 5 -0 2 2
P 7.90 6.25 4.45 5.25 0.33 32.25 1.52 12.93 -4.14 SS 0
2 -0 3
P 7.45 7.50 4.65 0.67 1.03 4.84 10.09 1.31 2.64 NS 0 5 -0 2 3
P 7.85 6.50 6.10 1.51 0.68 10.21 -0.42 1.77 1.55 NS 0
2 -0 4
P 8.00 7.90 5.50 0.69 0.65 4.68 13.56 1.41 6.69 NS 0 5 -0 2 4
P 8.45 8.30 4.70 1.85 0.53 12.02 3.21 1.71 1.35 NS 0
2 -0 5
P 7.40 5.70 5.55 0.66 0.86 5.17 5.47 1.17 2.87 NS
0 5 -0 2 5
P 7.90 7.15 4.65 0.71 0.67 5.39 10.21 1.34 2.34 NS 0
2 -0 6
P 7.55 7.10 4.10 0.78 0.59 6.21 3.65 1.23 6.07 NS
0 5 -0 2 6
P 7.85 7.45 4.45 1.39 0.35 10.19 -0.70 1.72 1.55 NS r e t a w d e t a r u t a s m u s p y g h t i w g n i h c a e L -2 T 0 2 -0 1
P 6.00 7.25 4.55 0.71 0.84 5.32 -0.70 2.95 -1.8 NS 0 5 -0 2 1
P 6.25 7.10 5.50 1.52 0.30 10.54 10.69 1.28 3.95 NS 0
2 -0 2
P 6.80 6.35 5.00 0.82 0.57 6.44 14.84 2.56 5.44 NS 0 5 -0 2 2
P 7.20 6.20 5.20 3.67 0.46 13.63 20.14 2.84 5.92 NS 0
2 -0 3
P 7.35 8.10 4.65 0.82 0.88 5.67 9.26 2.18 1.77 NS
0 5 -0 2 3
P 7.50 7.35 5.00 1.24 0.76 8.64 1.15 2.33 0.99 NS
0 2 -0 4
P 7.70 7.45 5.60 0.83 0.80 5.65 12.59 2.51 5.59 NS 0 5 -0 2 4
P 7.80 7.75 5.35 1.98 0.57 12.65 2.58 2.08 0.98 NS 0
2 -0 5
P 7.15 7.10 5.10 0.82 0.72 5.97 4.67 1.84 2.20 NS
0 5 -0 2 5
P 7.25 6.90 4.75 1.29 0.88 9.33 6.27 2.92 0.76 NS
0 2 -0 6
P 7.50 8.00 4.00 0.79 0.61 5.90 3.96 2.21 5.09 NS
0 5 -0 2 6
P 7.40 7.45 4.75 1.40 0.42 9.99 -0.50 2.53 0.74 NS Table 4 - Soil exchange complex of samples 0 - 20 e 20 - 50 cm after leaching with water (T1) and gypsum saturated water (T2).
(1)ESP = Exchangeable sodium percentage. (2)ESP
∆i-f = Initial ESP – final ESP.
(3)EC = Electrical conductivity of the saturation extract. (4)EC
∆i-f = Initial EC – Final EC.
only one sample (P10-20). The comparison, in absolute values, between EC after leaching with water and with gypsum saturated water (Table 4) showed that salt concentration in the soil leached with gypsum water was slightly greater than in the soil leached with pure water, except for sample P220-50. Studying the appli-cation of gypsum in a saline-sodic alluvial soil, Holanda et al. (1998) also observed a salinity increase. This sa-linity increase is normally expected, since gypsum is a source of salts to soil solution. However, the salin-ity increase occurs only initially. With time, the sub-stitution of Na for Ca leads to an improved soil hy-draulic conductivity and water infiltration and, conse-quently, soil salinity will be reduced (Ayers & Westcot, 1991).
All samples were classified as non-saline after leaching. Following the same behavior of treatment T1, there was a tendency for equilibrium between the EC of the soil solution and EC of the gypsum saturated water (EC = 2.07 dS m-1
), after leaching. The analy-sis of variance (Table 5) of data from EC, soil pH, ex-changeable cations and ESP, were highly significant (P < 0.01) for both treatments (T1 and T2).
The comparison between soil pH values by the Tukey test (P = 0.05) demonstrates that the leaching with gypsum-saturated water reduced soil pH in rela-tion to the original soil, being different to the treatment without gypsum. These results indicate an effective contribution of gypsum to the reduction of soil pH, which is in agreement with the results obtained by Dubey & Mondal (1994), Santos (1995) and Holanda et al. (1998). After leaching of the exchangeable so-dium, parts of the exchangeable sites are taken by
wa-ter-dissociated hydrogen. Furthermore, some bicarbon-ate responsible for alkalinity is bounded in low solu-bility complexes with the calcium of the gypsum, also contributing to a pH decrease. No pH change in depth was observed.
The average soluble salt concentration (EC) compared by the Tukey test demonstrate that soil leach-ing treatments were efficient in decreasleach-ing the origi-nal EC, although no differences (P > 0.05) were ob-served between treatments. After leaching with water (T1) and gypsum saturated water (T2) an increase of exchangeable calcium was observed in relation to the original soil. However, the greatest and different val-ues (P < 0.01) were observed after leaching with gyp-sum-saturated water. Gypsum is a source of calcium and its application in the water improved the amount of this cation in soil solution and, consequently, in the exchangeable sites. Similar results were obtained by application of gypsum directly into the soil (Cavalcante, 1984; Lucena, 1986; Santos, 1995 & Holanda et al., 1998).
Soil leaching with gypsum saturated water re-duced the amount of exchangeable sodium and ESP (P < 0.01) in relation to the original soil. On average, the ESP had 46% reduction and exchangeable sodium was reduced in 46%. There was a difference (P < 0.01) in the variation of ESP and exchangeable sodium with depth, with greater values in the 20 - 50 cm layer.
In general, no differences were observed in the EC, Ca+ and pH values in depth but, the 20 - 50 cm layer showed increased Mg2+, Na+ and ESP values, in relation to the surface layer. The highest amounts of potassium were observed in the 0 - 20 cm layer. The
s t n e m t a e r
T pH
H2O EC
s n o i t a c e l b a e g n a h c x E
P S E a
C 2+ Mg2+ Na+ K+
5 . 2 :
1 dSm-1 ------------------------- cmol c kg
1
- ------------------------- %
T ( l i o s l a n i g i r
O 0) 7.52a 4.97a 5.89c 5.81a 2.22a 0.44b 15.28a T
( r e t a
W 1) 7.64a 2.35b 6.75b 4.81b 1.59ab 0.60a 11.18ab T
( m u s p y g + r e t a
W 2) 7.15b 2.35b 7.24a 5.03b 1.19b 0.61a 8.30b
m c 0 2 -0 r e y a
L 7.35a 3.00a 6.77a 5.03b 1.23b 0.67a 8.92b
m c 0 5 -0 2 r e y a
L 7.52a 3.45a 6.48a 5.40a 2.11 a 0.42b 14.25a
n a e
M 7.44 3.04 6.63 5.22 1.67 0.55 11.59
% V
C 6.05 70.00 10.27 12.48 63.17 34.53 57.45
A d s
m 0.31 1.60 0.47 0.45 0.73 0.13 4.61
C / A d s
m - - -
-C d s
m - - - 0.30 0.49 0.08 3.13
Table 5 - Average results of soil pH, electrical conductivity (EC), exchangeable calcium, magnesium, sodium and potassium, and exchangeable sodium percentage (ESP) before (T0) and after soil leaching with water (T1) and gypsum saturated water (T2).
high coefficients of variation obtained for EC, Na+
, ESP and K+
are due to the great chemical variability of the samples.
EC and pH of the leaching solutions, hydraulic conductivity and leaching volume/pore volume re-lation
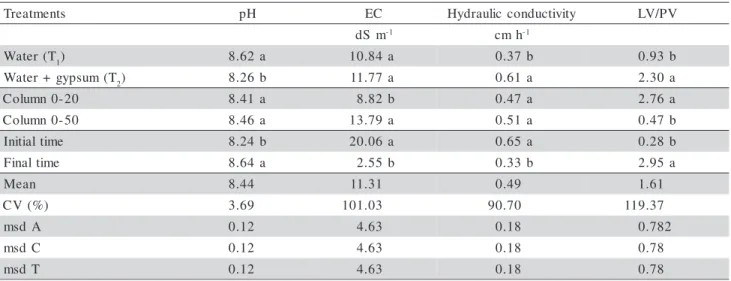
The pH and EC results of the leachates, soil hydraulic conductivity and leaching volume/pore vol-ume relation are shown in Table 6, after ten days of leaching. Differences (P < 0.01) were observed in re-lation to time (initial and stabilized) and layer (0 - 20 and 20 - 50 cm), for the EC; and in relation to the leaching water and time, and for pH values.
The largest salt concentrations were observed in the first leaching solutions and in 0 - 50 cm soil columns. The salt concentrations of the leaching so-lutions decreased with time, demonstrating soil salt re-moval by the leaching waters, as shown in Figure 2a.
In relation to the behavior of the leaching so-lution pH, (Figure 2b), the average values obtained by leaching with water presented higher values, in rela-tion to the leaching solurela-tion with gypsum saturated water (Table 6). This difference can be attributed to the original pH of the waters, which showed pH val-ues of 8.15 and 7.80 for pure and gypsum saturated water, respectively. The results did not differ in depth. During the leaching process, the initial and stabilized measurements showed differences, with greater re-sults for the stabilized time.
Soil hydraulic conductivity was improved by the application of gypsum in the leaching water. Results were two times greater than the ones in the soil leached with pure water. There was a pronounced effect of gyp-sum in the reduction of soil ESP and in the increase of the saturated flow of water, which can be demonstrated by the higher values of the leaching volume/pore vol-ume relation. The results are comparable to the ones obtained by Shainberg et al. (1982) and Melo (1988).
s t n e m t a e r
T pH EC Hydraulicconductivity LV/PV
m S
d -1 cmh-1
T ( r e t a
W 1) 8.62a 10.84 a 0.37b 0.93b
T ( m u s p y g + r e t a
W 2) 8.26b 11.77a 0.61a 2.30a
0 2 -0 n m u l o
C 8.41a 8.82 b 0.47a 2.76a
0 5 -0 n m u l o
C 8.46a 13.79 a 0.51a 0.47b
e m i t l a i t i n
I 8.24b 20.06 a 0.65a 0.28b
e m i t l a n i
F 8.64a 2.55 b 0.33b 2.95a
n a e
M 8.44 11.31 0.49 1.61
) % ( V
C 3.69 101.03 90.70 119.37
A d s
m 0.12 4.63 0.18 0.782
C d s
m 0.12 4.63 0.18 0.78
T d s
m 0.12 4.63 0.18 0.78
Table 6 - Average soil pH and EC results of the leaching solution from treatments with water (T1), gypsum saturated water (T2), soil hydraulic conductivity and leaching volume/pore volume relation (LV/PV).
CV% = Coefficient of variation. msd = minimum significant difference. A = water treatment. C = columns. Within columns, values followed by different letters are different (P = 0.05, Tukey test).
Figure 2 - EC (a) and pH (b) of the leachates related to soil leaching treatments with water (T1) and gypsum-saturated water (T2), in the two layers (0 - 20 cm and 0 - 50 cm), during ten days.
-5 10 15 20 25 30 35
1 2 3 4 5 6 7 8 9 10
Time (days)
EC
(d
S m
-1)
T1 0-20cm T1 0-50cm T2 0-20cm T2 0-50cm
7 8 9
1 2 3 4 5 6 7 8 9 10
Time (days)
pH
of
t
he Leac
hat
e
T1 0-20cm T1 0-50cm T2 0-20cm T2 0-50cm
Received April 07, 2006 Accepted October 08, 2007
CONCLUSIONS
The use of gypsum in the irrigation water im-proved soil physical and chemical properties of the studied soils and can be considered as an alternative for the reclamation of saline-sodic and sodic alluvial soils in Northeast Brazil.
REFERENCES
ANJOS, I.M. Recuperação de um solo salino-sódico: efeito de diferentes níveis e formas de aplicação de gesso. Areia: UFPB, 1993. 34p. Dissertação (Mestrado).
AXTEL, J.D.; DONEEN, J.D. The use of gypsum in irrigation water. Better Crops with Plant Food, v.33, p.16-23, 1949. AYERS, R.S.; WESTCOT, D.W. A qualidade da água na
agricultura. Campina Grande: UFPB, 1991. 218p. (FAO. Irrigação e Drenagem, 29).
BARROS, M.F.C.; MAGALHÃES, A.F. Avaliação de métodos de determinação da necessidade de gesso em solos salino-sódicos.
Revista Brasileira de Ciência do Solo, v.13, p.119-123, 1989.
BRESLER, E.; McNEAL, B.L.; CARTER, D.L. Saline and sodic soils: principles, dynamics and modeling. New York: Springer, 1982. 236p.
CAVALCANTE, L.F. Efeito do fosfogesso em solos salinizados da Paraíba, cultivados com feijão vigna. Piracicaba: USP/ESALQ, 1984. Tese (Doutorado).
CHAVES, L.H.G.; ROLIM, H. O efeito da aplicação de sulfato de alumínio e sulfato de cálcio sobre a permeabilidade de um solo. In: CONGRESSO BRASILEIRO DE CIÊNCIA DO SOLO, 26., Rio de Janeiro, 1997. Anais. Rio de Janeiro: SBCS, 1997. 1 CD-ROM.
DUBEY, S.K.; MONDAL, R.C. Effect of amendments and saline irrigation water on soil properties and yields of rice and wheat in a highly sodic soil. Journal of Agricultural Sciences, v.122, p.351-357, 1994.
DUQUE, J.G. Solo e água no polígono das secas. 4. ed. Fortaleza: DNOCS, 1973. 171p. (Publicação, 154).
EMPRESA BRASILEIRA DE PESQUISA AGROPECUÁRIA.
Manual de métodos de análise de solos. 2. ed. Rio de Janeiro: EMBRAPA/CNPS, 1997. 211p.
GOMES, F.P. Curso de estatística experimental. São Paulo: Nobel, 1974. 512p.
HOLANDA, J.S.; VITTI, G.C.; SALVIANO, A.A.C.; MEDEIROS, J.D.F.; AMORIM, J.R.A. Alterações nas propriedades químicas de um solo aluvial salino-sódico, decorrentes da subsolagem e do uso de condicionadores. Revista Brasileira de Ciência do Solo, v.22, p.387-394, 1998.
KELLEY, W.P. Alkali soils: their formation, properties and reclamation. New York: Reinhold, 1951. 176p.
LUCENA, E.R. Efeito da aplicação do fosfogesso em um solo salino-sódico. Piracicaba: USP/ESALQ, 1986. 94p. Dissertação (Mestrado).
MELO, F.B., COELHO, M.A.; FERREIRA, H.F.F. Efeito do gesso e da concentração salina da água na condutividade hidráulica do solo. Revista Brasileira de Ciência do Solo, v.12, p.89-92, 1988.
MELO, L.I.A. Avaliação do método de diluições sucessivas de água salina para recuperação de solos salino-sódicos. Recife: UFRPE, 1991. 87p. Dissertação (Mestrado).
PEREIRA, F.A.M. Metodologia de análises químicas para solos afetados por sais no Nordeste. Areia: UFPB, 1981. 71p. Dissertação (Mestrado).
PEREIRA, J.R., VALDIVIESO, G.L.; CORDEIRO, G.G. Recuperação de solos afetados por sódio através do uso de gesso. In: SEMINÁRIO SOBRE O USO DO FOSFOGESSO NA AGRICULTURA, 1., Brasília, 1985. Anais. Brasília: IBRAFÓS, 1986. p.85-105.
PIZARRO, F. Drenaje agrícola y recuperación de suelos salinos. Madri: Española, 1978. 521p.
RAIJ, B. van. Propriedades eletroquímicas do solo. In: SIMPÓSIO AVANÇADO DE QUÍMICA E FERTILIDADE DO SOLO, Campinas, 1986. Resumos. Campinas: Fundação Cargill, 1986. p.9-42.
RIBEIRO, M.R. Reabilitação de áreas degradadas em perímetros irrigados do DNOCS em Pernambuco. Recife: UFRPE, 1999. 175p. (Relatório Final de Pesquisa).
RICHARDS, E.A. Diagnostico e rehabilitación de suelos salinos y sodicos. Mexico: Limusa, 1974. 172p.
SANTOS, R.V. Correção de um solo salino-sódico e absorção de nutrientes pelo feijão macassar (Vigna unguiculata L. WALP.). Piracicaba: USP/ESALQ, 1995. 117p. Tese (Doutorado). SANTOS, R.V.; FERREYRA, F.F.H. Recuperação de solos afetados
por sais. In: CONGRESSO BRASILEIRO DE ENGENHARIA AGRÍCOLA, 26., Campina Grande, 1997. Anais. Campina Grande: SBEA, 1997. p.383.
SHAINBERG, I.; KEREN, R.; FRENKEL, H. Response of sodic soils to gypsum and calcium chloride application. Soil Science Society of America Journal, v.46, p.113-137, 1982. SUMNER, M.E. Sodic soils: new perspectives. In: NAIDU, R.;
SUMNER, M.E. (Ed.) Australian sodic soils: distribution, properties and management. Victoria: CSIRO, 1995. p.1-34. US SALINITY LABORATORY STAFF. Diagnosis and