ISSN 0100-2945 http://dx.doi.org/10.1590/0100-29452017728
NUTRITIONAL DIAGNOSIS IN HYBRID COCONUT
CULTIVATED IN NORTHEASTERN BRAZIL
THROUGH DIAGNOSIS AND RECOMMENDATION
INTEGRATED SYSTEM (DRIS)
1EDUARDO CÉZAR MEDEIROS SALDANHA2, MÁRIO LOPES DA SILVA JUNIOR3,
PAULO MANOEL PONTES LINS3, SAMUEL CHRISTIAN COHEN FARIAS4,
PAULO GLULHERME SALVADOR WADT5
ABSTRACT - The assessment of the nutritional status of plants by leaf diagnosis such as the Diagnosis and
Recommendation Integrated System (DRIS) has stood out among traditional methods of interpreting the results of plant tissue analysis. For coconut, nutritional monitoring through foliar analysis has been pointed
as an efficient method for fertilizer recommendation, and the results have been traditionally interpreted using the critical level of sufficiency ranges criteria. The aim of this study was to evaluate the nutritional status
and establish nutritional standards for the cultivation of hybrid coconut in the municipality of Moju, Pará,
using DRIS. The leaf analysis and productivity results of 134 observations for the period 2001-2011 were used to form the database. The most common deficiencies found were lack of K, and possibly excess of Mg. The order of nutrient limitation was K> P> Ca> Fe> N> O> B> Zn> Cu> Mn> Mg. Ca, Fe and K nutrients are more likely to positively respond to fertilization, since Mg, Cu and Mn were diagnosed as having the greatest likelihood of negative response to fertilization. It was also found that N and P are elements that are in the best nutritional balance condition. Regression equations for the relationship between nutrient content in hybrid coconut leaves and its DRIS indexes were adjusted, which allowed establishing nutrient reference
values based on DRIS.
Index terms: Leaf analysis, Reference Standards, DRIS indexes.
DIAGNOSE NUTRICIONAL EM COQUEIRO HÍBRIDO CULTIVADO NA
REGIÃO NORTE DO BRASIL DO ESTADO DO PARÁ POR MEIO DO
SISTEMA INTEGRADO DE DIAGNOSE E RECOMENDAÇÃO
RESUMO - A avaliação do estado nutricional de plantas por meio da diagnose foliar, como o Sistema Integrado de Diagnose e Recomendação (DRIS), vem destacando-se dos métodos tradicionais de interpretação dos resultados da análise de tecido vegetal. Para o coqueiro, o acompanhamento nutricional por meio de
análise foliar é apontado como método eficiente para a recomendação de adubação, e os resultados têm sido tradicionalmente interpretados com a utilização do critério do nível crítico e das faixas de suficiência. Os
objetivos deste trabalho foram avaliar o estado nutricional e estabelecer padrões nutricionais para a cultura
do coqueiro híbrido, utilizando o método DRIS. O trabalho foi realizado em área comercial de coqueiros no município de Moju-PA. Utilizou-se, para formar o banco de dados, de resultados de análise foliar e de produtividade de 134 observações referentes ao período de 2001 a 2011. Verificou-se deficiências mais frequentes para o elemento K, e possivelmente excessos para elemento Mg. A ordem de limitação nutricional foi K > P > Ca > Fe > N > S > B > Zn > Cu > Mn > Mg. Os nutrientes Ca, K e Fe apresentaram maior
probabilidade de resposta positiva a adubação, já os nutrientes Mg, Cu e Mn foram diagnosticados como
os de maior probabilidade de resposta negativa à adubação. Verificou-se, também, que os nutrientes N e P apresentaram a melhor condição de equilíbrio nutricional. Foram ajustadas equações de regressão para a relação entre os teores de nutrientes em folhas de coqueiro híbrido e os respectivos índices DRIS, o que possibilitou estabelecer valores de referências nutricionais, com base no método DRIS.
Termos para indexação: diagnose foliar, padrões de referência, índices DRIS.
1(Paper 164-15). Received June 23, 2015. Accepted April 04, 2016. Thesis of the first author 2Professor at UFRA - Capitão Poço Campus. Email: ecmsaldanha@yahoo.com.br
3Professor at UFRA - Belém Campus. Email: mario.silva@ufra.edu.br
4Head of Research and Development of Company Sococo - Agroindústria da Amazônia. Email: paulom@sococo.com.br 5Agronomic Engineer at Company Sococo - Agroindústria da Amazônia. Email: samuelc@sococo.com.br
INTRODUCTION
The nutritional diagnosis in cultivated plants has evolved to used in the interpretation of the nutritional contents in plant tissues, methods that relate nutrient contents to each other, such as the Diagnosis and Recommendation Integrated System (DRIS) (BEAULFILS, 1973), replacing interpretations by traditional methods such as
the critical level and the sufficiency range, which
evaluate each nutrient in isolation. Nutritional diagnosis is an important step in detecting possible
deficiencies and assisting in fertilization programs.
In the case of coconut cultivation, nutritional status
monitoring through leaf tissue analysis was pointed
out by Sobral and Santos (1987) as an auxiliary tool
for fertilization recommendation.
Critical level and sufficiency range methods
are generally the most used criteria for the evaluation and interpretation of the nutritional status of plants and have been applied in several annual or perennial crops (PRADO et al., 2008). This method has the advantage of being able to directly interpret nutrient content by comparing the content in the sample
with the reference value (critical level) or with the sufficiency range.
However, Wadt and Dias (2014) argue that
DRIS may have as advantage, over conventional
methods, the possibility of minimizing the effects
of uncontrolled factors on variations in dry matter
concentration and / or dilution rates. This would
be due to the fact that the DRIS method calculates
an index for each nutrient, which is obtained from
relationships among nutrient accumulation rates in the evaluated tissue.
Knowing the relative accumulation rates, normalized in relation to the same relations of
plants considered healthy and productive, it is then possible to infer about the ordering of nutrients in relation to their balance in the sampled tissue. Thus, in the interpretation of DRIS indexes, negative
index indicates that the nutrient is below the optimal
level, positive index indicates that the nutrient is
above the optimal level, while the DRIS index of a nutrient close to or equal to zero indicates that this nutrient would be in balance with the other nutrients
(BEAUFILS, 1973).
In short, for being relative indexes, the diagnosis results can be ordered in an increasing
order, which is called the order of nutrient limitation (WADT, DIAS, 2014). In this case, the first nutrient
nutrient, the one that would be in excess. Nutrients with DRIS index close to zero, or with values equal to zero, would be considered nutritionally balanced
(BEAULFIS, 1973).
In the specific case of hybrid coconut plantations in the state of Pará, the leaf analyses results have traditionally been interpreted using
the critical level and sufficiency ranges criterion,
but there is a great disadvantage and assertiveness fragility. In turn, the use of the DRIS enables nutritional standards to be obtained from commercial
crop data and / or fertilization trials, thus facilitating
the attainment of reference values that may be
applicable for new materials and new management
conditions (SALDANHA et al., 2015).
However, it is important to highlight that the set of plants to be used for the definition
of nutritional standards represents, as much as possible, all interactions that may exist among factors that determine the nutritional status of crops
(RODRIGUEZ; RODRIGUEZ, 2000); therefore,
the possible number of variability of the cultivation conditions of the species to be evaluated should be
used, unlike the work of Santos et al. (2004), who proposed DRIS standards exclusively by taking leaf
samples from a single planting area and at different times of the year (six collections per year).
In this sense, the aim of this work was to
establish nutritional standards for the Critical Level method and DRIS standards for hybrid coconut and to use the DRIS standards to evaluate the nutritional status for this crop in the northeastern region of the state of Pará.
MATERIAL AND METHODS
The study was carried out in a commercial
coconut plantation located in the municipality of Moju, state of Pará (02 ° 07’00 “S and 48 ° 22’30” W). The predominant soils found in this region
correspond to Yellow Latosols (MANCIOT, 1979).
The region has a monsoon tropical climate, according
to the Köppen classification, characterized as rainy tropical, without seasonal thermal variation and with
annual average rainfall of 2,500 mm.
Data from the nutritional contents of 134 leaf samples and crop productivity of hybrid coconut
collected from 2001 to 2011 were used to compose a nutritional monitoring database. The database was
formed from coconut leaf samples collected in
on each side, removing 10 cm from the central
part. Leaflets were cleaned with cotton soaked in deionized water, removing the central rib and edges
of the limbus, and dried in an air forced circulation
oven at 75 ° C for 48 hours. Nutrients N, P, K, Ca, Mg, S, B, Cu, Fe, Mn and Zn were determined according
to methodology proposed by Malavolta et al. (1997). In all orchards, usual practices of phytotechnical management that involved the control of spontaneous herbs through the application of herbicide, cleaning of plants and biological control practices of the main
pests of coconut crop were carried out.
The database was divided into two
subpopulations (Reference Population - PR, and Non - Reference Population - PNR), as a function of fruit yield (fruits per plant per year). Reference
Populations (PR) were considered as those that
presented productivity above 130 fruits / plant-1 year
-1, according to productivity standards established
by literature (DALLEMOLE et al., 2008; LINS et al., 2003; MOHANDAS , 2012), totaling 30 cases.
Although the number of cases used in this work is small, it was higher that the sampling performed by Santos et al. (2004) also with coconut trees in the
northern region of Rio de Janeiro. The average fruit
yield in the region where data were collected was
approximately 130 fruits / plant-1 year-1
The DRIS standards for hybrid coconut
cultivation were obtained from the set of cases of the
reference population, calculating the relationships in
the form of quotient between the nutritional contents of N, P, K, Ca, Mg, S, B, Cu, Mn and Zn, both in the
direct and in the inverse form, obtaining for these relations the mean statistics, standard deviations and
variation coefficients, as recommended by Beaufils
(1973) (BEAUFILS, 1973).
In order to calculate the DRIS indexes of the 134 leaf samples, the DRIS standards obtained as
described in this work were used in the calculation of the DRIS index, that with the highest value
for the F test, for the distribution of the relations
between reference subpopulations and non-reference
subpopulation (JONES, 1981):
where: X = nutrient under study; A, B, C ..., N = nutrients that appear in the numerator or denominator of the relationships with element X; Z = number of functions involved in the calculation
of the index.
For the calculation of the DRIS functions,
Jones’s formula (1981) was adopted:
where: M (X / A) = value of the nutritional relation X / A in the study population; M (x / a) = value of the nutritional relation X / A in the reference population; S (x / a) = standard deviation of the nutritional relation in the reference population; K =
constant, adopted as a scaling factor to facilitate the
reading of the DRIS indexes in whole values, being
arbitrarily adopted the value 10.
The nutritional balance index (IBN) was
calculated by the sum of all the indexes involved, in
a module, according to the following expression:
For the interpretation of the DRIS indexes, the
standard procedure proposed by Beaufils (1973) was first used, in which the nutritional limitation order was determined by ordering the index of smallest value (more limiting by deficiency) to the one of the
greatest value (more limiting by excess). The second
interpretation procedure used was to determine the
percentage of total limitation occurrence, computing
as limiting all nutrients with negative indexes of each
sample (LEANDRO, 1998).
The percentage of occurrence in the first, second, and third orders, corresponding to the first,
second, and third indexes, respectively, to the index
from the lowest value to the highest value, provided that negative, in each sample was also obtained. This criterion was adopted with the purpose of identifying
the three most limiting nutrients in each evaluated orchard.
The database was grouped into six categories
regarding orchard productivity, considering the number of fruits / plant-1 year-1 (FPA): <50; 51-70;
differentiate the reference population from those of non-reference, and to divide the non-reference
population into five subclasses, each with a productivity interval of 20 FPA within each group of orchard, the mean DRIS index of nutrients, IBN, was calculated and the order of nutritional limitation was defined based on the direct interpretation (negative index, index equal to zero and positive index).
Linear regression analysis was used to establish models between DRIS indexes and leaf
nutrient contents, and the optimal value for the
nutritional content was then mathematically obtained
by regression based on the premise that the optimum content is equal to the value corresponding to the
nutritional balance, that is, when the nutrient DRIS index equals zero (WALWORTH; SUMNER, 1987), as also adopted by other authors (WADT et al., 1998; SILVA, 2001; REIS JÚNIOR et al., 2002; REIS JÚNIOR;MONNERAT, 2003;KURIHARA, 2004). Regression analysis was also performed between
the Nutritional Balance Index (IBN) and agricultural productivity.
Calculations related to DRIS standards, DRIS
indexes, IBN and IBNm were performed using
Microsoft Excel ® spreadsheets, and regression
analyses were performed using the Assistat ® software (SILVA; AZEVEDO, 2009).
RESULTS AND DISCUSSION
The statistics for each bivariate relation,
among the evaluated nutrients, were composed of
the set of DRIS norms for coconut tree (Table 1).
In general, the highest variation coefficients were associated to relationships involving micronutrients, as verified in rice crop (WADT et
al., 2013).
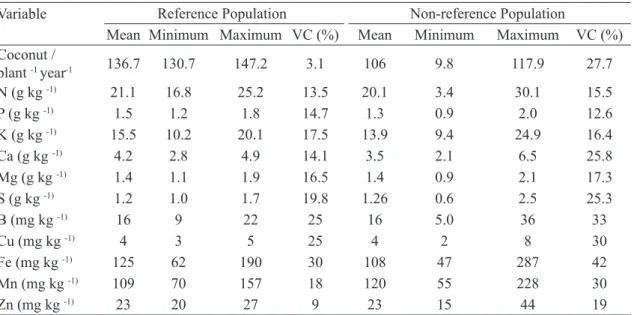
For fruit productivity averages, the variation
coefficient (VC) was lower in the reference group, compared to the non-reference group, with values
ranging from 3.1 to 27.7%, respectively (Table 2),
which indicates lower amplitude in the nutritional
contents for orchards considered as reference.
Lower VC value indicates greater sensitivity
to relationship involving the nutrient in pointing
out nutritional deficiency (ROCHA et al., 2007;
SANTANA et al., 2008).
Data presented in Table 3 were interpreted
according to procedure of Leandro (1998), considering the percentage of total limitation occurrence in the
first, second and third orders of limitation.
P> Ca> Fe> N> S> B> Zn> Cu> Mn> Mg. K and Ca, highlighting as the nutrients with the highest frequency of occurrence in the first, second and third orders, while P presented low occurrence in the first,
second and third order classes. This means that the
imbalance associated with P is probably due to its imbalance related to other nutrients, while for K and Ca, the probability of true deficiency is more relevant.
In productivities above 70 fruits / plant-1 year -1,
nutrients K and Ca were those with the highest frequency of occurrence of negative DRIS index (Table 4), while Mn and Mg were the nutrients with the highest
occurrence in excess, regardless of productivity class.
Nutritional deficiencies of potassium indicated by
the order of nutritional limitation in the classes of highest productivities can be explained by the higher
demand of this nutrient in more productive plants; once in coconut plantations, potassium deficiencies
are more common (SOBRAL, 1998) because the amounts removed are high due to the fact that the plant develops continuously. Plants that comprise
the class of highest productivity (> 130 fruits / plant-1 year-1) had lower average IBN, indicating that they
would be more nutritionally balanced. The sum of
the absolute values of the DRIS indexes composes
the mean nutritional balance index (IBNm), which
expresses the nutritional balance of the sampled
orchard. Santos et al. (2004) also found lower IBN in higher productivity classes with dwarf coconut, when evaluating nutritional status through DRIS,
corroborating values observed in this study.
Greater dependence indicates that the variation in nutrient content explains most (above 80%) of the variability observed in the DRIS indexes,
while lower dependence (<50%) indicates that the nutrient balance would be responsible for explaining
variations in DRIS indexes. Thus, positive and
significant correlations (p <0.01) between nutrient concentrations and respective DRIS indexes were verified for all nutrients (Table 5). In the case of
micronutrients B, Cu, Fe and Mn, the determination
coefficients of regression equations (R2> 80)
suggest dependence between the DRIS index and
the concentration of the respective nutrient in the
plant leaf. For N and P, there was no dependence
(R2 <50). For nutrients K, Ca, Mg, S and Zn, the
degree of dependence was intermediate (R2 between 50 and 80). Therefore, in this context, the balance
of micronutrients (except Zn) was dependent on the
availability of the nutrient in the plant, and the N
and micronutrient contents in work with cotton crop, with emphasis on the higher determination coefficient values obtained with micronutrients, similar to results found in this work.
Thus, as in this work (R2 = 0.35), other authors
(SERRA et al., 2012; GUINDANI et al., 2009) find
smaller determination coefficient values for N (R2
= 0.49 and R2 = 0.20, respectively) in work with
cotton and rice crops, respectively. Low relationship between DRIS index and nitrogen concentration was
also observed for several perennial crops, such as apple (NACHTIGALL, 2004), citrus (SALVO, 2001)
and coffee (REIS JÚNIOR et al., 2002).
Linear regressions adjusted for the relationship
between nutrient contents and DRIS indexes (Table 5) allowed defining the optimum levels for each
nutrient (Table 6).
It was observed that the nutritional balance
values at DRIS and the leaf critical N and P levels used for nutritional monitoring in the commercial
plantation area were close to each other, with
differences smaller than 10%. For the other nutrients,
the values found were significantly different, highlighting Ca, Mg, Cu, Fe, Mn and Zn, whose differences among values found were higher than
30%. The observed differences may be indicative of the need to recalculate the values of leaf critical levels adopted for hybrid coconut cultivation in the state of
Pará, and the levels defined by the DRIS Nutritional
Balance Point can be used as comparison parameters
in future works aimed at calibrating foliar contents for the definition of critical levels.
TABLE 1 - DRIS standards - mean, standard deviation (SD), variation coefficient (VC%) in the reference
population for the relationships among nutrients in hybrid coconut cultivated in the municipality of Moju-PA.
Relationship Mean SD VC Relationship Mean SD VC Relationship Mean SD VC P/N 0.072 0.005 6.27 Mg/K 0.070 0.005 6.43 B/S 12.560 3.486 27.75 K/N 0.750 0.135 17.96 S/K 0.084 0.024 28.21 S/Cu 0.340 0.131 38.41 Ca/N 0.190 0.034 17.78 B/K 1.059 0.417 39.34 Fe/S 93.510 20.525 21.95 Mg/N 0.070 0.009 12.14 K/Cu 4.100 1.265 30.85 Mn/S 87.670 22.010 25.1
S/N 0.061 0.012 19.46 Fe/K 7.870 2.561 32.53 Zn/S 18.270 2.383 13.04 B/N 0.760 0.226 29.75 Mn/K 7.150 1.833 25.63 B/Cu 4.024 1.137 28.27 Cu/N 0.200 0.067 33.7 Zn/K 1.510 0.327 21.65 Fe/B 8.065 3.068 38.05 Fe/N 5.720 1.644 28.73 Mg/Ca 0.370 0.072 19.46 Mn/B 7.360 2.350 31.92 Mn/N 5.230 1.113 21.28 Ca/S 2.910 0.843 28.95 Zn/B 1.530 0.376 24.6 Zn/N 1.100 0.169 15.4 B/Ca 3.960 1.281 32.34 Cu/Fe 0.038 0.017 43.63 P/K 0.099 0.021 21.47 Cu/Ca 1.035 0.102 37.04 Mn/Cu 28.410 9.104 32.00 P/Ca 0.376 0.064 17.00 Fe/Ca 29.410 7.667 26 Zn/Cu 5.990 1.690 28.20 Mg/P 0.980 0.112 11.44 Mn/Ca 27.210 6.399 23.51 Mn/Fe 0.998 0.377 37.74 S/P 0.850 0.131 15.35 Zn/Ca 5.700 0.809 14.19 Zn/Fe 0.210 0.071 33.57 B/P 10.630 3.108 29.23 Mg/S 1.180 0.223 18.89 Mn/Zn 4.790 0.990 20.67 Cu/P 2.790 0.944 33.83 Mg/B 0.100 0.036 35.8
TABLE 2-Average, minimum, maximum values and variation coefficient (VC) for productivity (number of
coconut / plant -1 year -1) and leaf nutrient contents in hybrid coconut cultivated in Moju-PA
from 2001 to 2011 in reference (N = 30) and non-reference (n = 104) subpopulations.
Variable Reference Population Non-reference Population
Mean Minimum Maximum VC (%) Mean Minimum Maximum VC (%)
Coconut /
plant -1 year-1 136.7 130.7 147.2 3.1 106 9.8 117.9 27.7
N (g kg -1) 21.1 16.8 25.2 13.5 20.1 3.4 30.1 15.5
P (g kg -1) 1.5 1.2 1.8 14.7 1.3 0.9 2.0 12.6
K (g kg -1) 15.5 10.2 20.1 17.5 13.9 9.4 24.9 16.4
Ca (g kg -1) 4.2 2.8 4.9 14.1 3.5 2.1 6.5 25.8
Mg (g kg -1) 1.4 1.1 1.9 16.5 1.4 0.9 2.1 17.3
S (g kg -1) 1.2 1.0 1.7 19.8 1.26 0.6 2.5 25.3
B (mg kg -1) 16 9 22 25 16 5.0 36 33
Cu (mg kg -1) 4 3 5 25 4 2 8 30
Fe (mg kg -1) 125 62 190 30 108 47 287 42
Mn (mg kg -1) 109 70 157 18 120 55 228 30
Zn (mg kg -1) 23 20 27 9 23 15 44 19
TABLE 3-Percentage of occurrence of the most limiting nutrients diagnosed by the DRIS indexes for hybrid coconut cultivation in 134 leaf samples.
% of occurrence1
Nutrient Total (%) 1st order 2nd order 3rd order
N 49 3 7 7
P 66 4 9 15
K 84 21 24 19
Ca 59 26 10 8
Mg 25 1 6 2
S 48 6 13 10
B 45 10 10 7
Cu 39 10 4 5
Fe 58 16 10 7
Mn 35 1 4 5
Zn 42 0 0 5
TABLE 4 - Mean DRIS indexes, mean nutritional balance index (IBNm) and order of nutrient limitation in hybrid coconut orchards in the municipality of Moju-PA in six productivity classes.
Productivity 1 DRIS m index IBN m Order of limitation
n N P K Ca Mg S B Cu Fe Mn Zn
< 50 10 -1 -4 -8 -10 17 -4 1 0 -11 21 0 77 Fe>Ca>K>P=S>N>Zn=Cu>B>Mg>Mn 51 - 70 8 -2 0 -7 -5 7 -2 -1 0 -9 16 4 53 Fe>K>Ca>S=N>B>Cu=P>Zn>Mg>Mn 71 -90 9 -1 -8 -17 -12 11 -2 2 0 -4 21 9 87 K>Ca>P>Fe>S>N>Cu>B>Zn>Mg>Mn 91 -110 31 -2 -3 -9 -8 8 4 0 6 -4 7 1 52 K>Ca>Fe>P>N>B>Zn>S>Cu>Mn>Mg 110 -130 46 -1 -2 -12 -8 13 -2 1 1 1 3 3 47 K>Ca>P=S>N>B=Cu=Fe>Mn=Zn>Mg >130 30 1 -2 -8 -3 4 0 2 4 0 2 1 27 K>Ca>P>S=Fe>N=Zn>B=Mn>Cu> Mg
TABLE 5 - Statistical model of relationships between DRIS index and leaf nutrient concentration in leaf
samples of 134 hybrid coconut trees from 2001 to 2011.
Variable
Independent Dependent Statistical model R2
N1 DRIS N DRIS N = 1.41 N - 28.55 0.35**
P DRIS P DRIS P = 23.84 P - 36.02 0.43**
K DRIS K DRIS K = 3.32 K - 56.96 0.64**
Ca DRIS Ca DRIS Ca = 13.48 Ca - 55.26 0.78**
Mg DRIS Mg DRIS Mg = 44.96 Mg - 55.78 0.68**
S DRIS S DRIS S = 37.87 S - 47.98 0.77**
B DRIS B DRIS B = 2.33 B - 35.62 0.90**
Cu DRIS Cu DRIS Cu = 9.77 Cu - 37.94 0.84**
Fe DRIS Fe DRIS Fe = 0.28 Fe - 32.33 0.90**
Mn DRIS Mn DRIS Mn = 0.38 Mn - 38.48 0.84**
Zn DRIS Zn DRIS Zn = 1.95 Zn - 41.41 0.62**
** significant by F test at 1% probability
1 macronutrients (g kg -1) and micronutrients (mg kg -1)
TABLE 6 - Nutritional balance at DRIS and leaf critical level for nutrients in the hybrid coconut crop in leaf samples of 134 hybrid coconut trees from 2001 to 2011.
Nutrient Nutritional balance at DRIS1 Critical level of the region 2
N (g kg -1) 20.2 22.0
P (g kg -1) 1.5 1.4
K (g kg -1) 17.2 14.0
Ca (g kg -1) 4.1 3.0
Mg (g kg -1) 1.2 2.2
S (g kg -1) 1.3 1.5
B (mg kg -1) 15 20
Cu (mg kg -1) 4 10
Fe (mg kg -1) 115 40
Mn (mg kg -1) 101 70
Zn (mg kg -1) 21 8
1 Nutrient concentration in leaves of nutritionally balanced plants
CONCLUSION
The nutritional diagnoses carried out using
DRIS indicated K as the most limiting element due to deficiency and the most limiting ones due to excess. Mn for orchards with average productivity lower
than 90 fruits / plant-1 year-1 and Mg for orchards with average productivity above 90 fruits / plant-1 year-1
The foliar contents considered optimal by means of DRIS indicated large divergences for
nutrients Ca, Mg, Cu, Fe, Mn and Zn, when compared
to those adopted as a regional reference by means
of critical levels, showing the need for validation through experimental works.
The values considered optimal for leaf
contents in hybrid coconut were 20.2; 1.5; 17.2; 4.1; 1.2 and 1.3 g kg-1, respectively for N, P, K, Ca, Mg
and S, and 15; 4; 115; 101 and 21 mg kg-1 for B, Cu,
Fe Mn and Zn.
ACKNOWLEDGMENTS
The authors would like to thank SOCOCO S / A Agroindústria da Amazônia, for the technical and
operational support for the conduction of this study,
as well as to Agronomist, PhD. Paulo Manoel Pontes
Lins, Research and Development Director of Sococo Group for the support and data availability.
REFERENCES
BEAUFILS, E.R. Diagnosis and Recommendation Integrated System (DRIS): a general scheme for experimentation and calibration based on principles develop from research in plant nutrition. Soil Science Bulletin, Pietermaritzburg, n. 1, p.132, 1973.
DALLEMOLE, D; LINS, P; SANTANA, A.C. Análise de investimento de coqueiral híbrido PB 121
para produção de coco seco. Revista de Estudos
Sociais, Cuiabá, v.10. n.20, p.2, 2008.
GUINDANI, R.R.H.P; ANGHINONI, I.;
NACHTIGALL, G.R. DRIS na avaliação do estado
nutricional do arroz irrigado por inundação Revista Brasileira de Ciência do Solo, Viçosa, MG, v.33, p.109-118, 2009.
JONES, C.A. Proposed modifications of the diagnosis
and recommendation integrated system (DRIS) for
interpreting plant analysis. Communications Soil
Science Plant Analysis, New York, v.12,
p.785-794, 1981.
KURIHARA, C.H. Demanda de nutrientes pela soja e diagnose de seu estado nutricional. 2004. Tese (Doutorado) – Universidade Federal de Viçosa, Viçosa, 2004.
LEANDRO, W.M. Sistema integrado de diagnose
recomendação (DRIS) para a cultura da soja (Glycine maxL. Merril) na região de Rio
Verde-GO. 1998. 157 f. Tese (Doutorado) - Escola de
Agronomia e Engenharia de Alimentos, Universidade Federal de Goiás, Goiânia, 1998.
LINS, P.M.P; NETO, J.T.F.; MULLER, A.A. Avaliação de híbridos de coqueiro (cocos nucifera l.) para produção de frutos e de albúmen sólido fresco.
Revista Brasileira de Fruticultura, Jaboticabal, v.25, n.3, p.468-470, 2003.
MALAVOLTA, E.; VITTI, G.C.; OLIVEIRA, S.A. Avaliação do estado nutricional das plantas. 2. ed. rev. atual. Piracicaba: POTAFOS, 1997. 319p.
MANCIOT, R. Instalação de uma plantação de
coqueiros híbridos no Brasil. Moju-Pará: Sococo, 1979. 90 p. (Relatório de atividades).
MOHANDAS, S. Effect of NPK fertilizer levels
on mineral nutrition and yield of hybrid (Tall x
Dwarf) coconut. Madras Agricultural Journal, Coimbatore, v.99, n.1-3, p.87-91, 2012.
NACHTIGALL, G.M.; DECHEN, A.R. Dris norms
for evaluating the nutritional state of Apple tree.
Scientia Agrícola, Piracicaba, v.64. n.3, p.282-287, 2007.
PRADO, R. de M; ROZANE, D.E; VALE, D.W. do; CORREIA, M.A.R; SOUZA, H.A. de. Nutrição de plantas: diagnose foliar em grandes culturas. Jaboticabal: FCAV, Capes/Fundunesp, 2008. 301 p.
REIS JÚNIOR, R.A.; MONNERAT, P.H. DRIS
norms validation for sugarcane crop. Pesquisa
Agropecuária Brasileira, Brasília, DF, v.38,
REIS JUNIOR, R.A; CORRÊA, J.B; CARVALHO, J.G; GUIMARÃES, P.T.G. Estabelecimento de
normas DRIS para o cafeeiro no Sul de Minas Gerais: 1ª aproximação. CiênciaAgrotecnologia, Lavras, v. 26, n. 2, p. 269-282, 2002.
ROCHA, A.C. da; LEANDRO, W.M; ROCHA, A.O; SANTANA, J. das G; ANDRADE, J.W. de S.
Normas DRIS para cultura do milho semeado em
espaçamento reduzido na região de Hidrolândia,
GO, Brasil. Bioscience Journal, Washington, v.23,
p.50-60, 2007.
RODRIGUEZ, O.; RODRIGUEZ, V. Desarrollo,
determinación e interpretación de normas DRIS para el diagnóstico nutricional en plantas. Una revision.
Revista de la Facultad Agronomia, Luz, v.17, p.
449-470, 2000.
SANTANA, J. das G.; LEANDRO, W.M.; NAVES, R.V.; CUNHA, P.P. da. Normas DRIS
para interpretação de análises de folha e solo, em
laranjeira pêra, na região central de Goiás. Pesquisa Agropecuária Tropical, Goiania, v.38, p.109-117, 2008.
SALDANHA, E.C.M.; SILVA JUNIOR, M.L.; OKUMURA, R.S.; WADT, P.G.S. Normas DRIS para a cultura do coqueiro híbrido no Estado do Pará. Revista Caatinga, Mossoró, v.28, p.99-109, 2015.
SANTOS, A.L. dos; MONNERAT, P.H.;
CARVALHO, A.J.C.C. Estabelecimento de normas DRIS para o diagnóstico nutricional do
coqueiro-anão verde na região Norte Fluminense. Revista
Brasileira de Fruticultura, Jaboticabal, v.26, n.2, p.330-334, 2004.
SERRA, A. P; MARCHETTI, M. E; ROJAS, E. P; VITORINO, A. C. T. Beaufils ranges to assess the
cotton nutrient status in the southern region of Mato
Grosso. Revista Brasileira de Ciência do Solo,
Viçosa, MG, v.36, p.171- 181, 2012.
SILVA, F.A.S; AZEVEDO, C.A.V. Principal components analysis in the software Assistat –
Statistical Attendance. In: WORLD CONGRESS ON COMPUTERS IN AGRICULTURE, 7., 2009, Reno. Proceedings... St Joseph: American Society of Agricultural and Biological Engineers, 2009.
SILVA, G.G.C. Diagnose nutricional do eucalipto
pelo DRIS, M-DRIS e CND. 2001. 132 f. Dissertação (Mestrado) - Universidade Federal de Viçosa, Viçosa,
2001. (4) (Corrigir p. 12 linha 32 de SALVO, 2001
para SILVA, 2001.
SOBRAL, L.F. Nutrição e adubação do coqueiro.
In: FERREIRA, J.M.S.; WARWICK, D.R.N.;
SIQUEIRA, L.A. A cultura do coqueiro no Brasil.
2. ed. Brasília: Embrapa-SPI; Aracaju: Embrapa /
CPATC, 1998. p.129-157.
SOBRAL, L.F; SANTOS, Z.G. Sistema de recomendações de fertilizantes para o coqueiro
(Cocos nucifera L.) com base na análise foliar.
Brasília, DF: EMBRAPA-DDT, 1987. 23 p.
(Documentos, 7).
WADT, P.G.S; NOVAIS, R.F; ALVAREZ V, V.H; FONSECA, S.; BARROS, N.F. Valores de referência para macronutrientes em eucalipto obtidos
pelos métodos Dris e chance matemática. Revista
Brasileira de Ciência do Solo, Viçosa, MG, v.22, p.685-692,1998a.
WADT, P.G.S.; DIAS, J.R.M. Premissas para a aplicação do DRIS em espécies florestais e palmeiras. In: PRADO, R.M.; WADT, P.G.S. (Org.). Nutrição
e adubação de espécies florestais e palmeiras. Jaboticabal: FUNEP, 2014. v.1, p. 277-298.
WADT, P.G.S.; ANGHINONI, I.; GUINDANI, R.H.P.; LIMA, A.S.T.; PUGA, A.P.; SILVA, G.S.;
PRADO, R.M. Padrões nutricionais para lavouras
arrozeiras irrigadas por inundação pelos métodos da
CND e Chance Matemática. Revista Brasileira de
Ciência do Solo, Viçosa, MG, v.37, p.145-156, 2013.
WALWORTH, J.L; SUMNER, M.E. The diagnosis
and recommendation integrated system (DRIS).
Advances in Soil Science, New York, v.6,