Effects of arginine and phytogenic additive supplementation on performance
and health of brown-egg layers
Vitor Barbosa Fascina1*, Guilherme Aguiar Mateus Pasquali1, Daniella Aparecida Berto1, Amanda da Lapa Silva1, Edivaldo Antônio Garcia2, Antonio Celso Pezzato1, Elisabeth
Gonzales1, José Roberto Sartori1
1 Universidade Estadual Paulista “Júlio de Mesquita Filho”, Faculdade de Medicina Veterinária e Zootecnia, Departamento de Melhoramento e Nutrição Animal, Botucatu, SP, Brazil.
2 Universidade Estadual Paulista “Júlio de Mesquita Filho”, Faculdade de Medicina Veterinária e Zootecnia, Departamento de Produção Animal, Botucatu, SP, Brazil.
ABSTRACT - This study was performed to evaluate the effects of the association of different digestible arginine and phytogenic additive dietary levels on performance and health status of brown-egg layers. In this study, a total of 504 33-week-old Hisex Brown layers were distributed into a completely randomized experimental design to a 4 × 3 factorial arrangement (dietary digestible arginine levels: 880, 968, 1056, or 1144 mg/kg of feed × phytogenic additive levels: 0, 100, and 200 mg/kg of feed) with six replicate cages of seven birds per cage. The phytogenic additive was composed of extracts of Baccharis dracunculifolia (40%), Astragalus membranaceus lipopolysaccharides (20%), cinnamon, and grape seed (20%). Feed intake was reduced when diets containing 1056 mg of arginine were supplemented with 100 or 200 mg phytogenic additive per kg. Feed conversion ratio was improved when diets were supplemented with 100 mg of phytogenic additive or with 1056 mg of arginine per kg of feed. Egg mass was increased when diets were supplemented with 1056 mg arginine per kg of feed. Arginine supplementation quadratically increased albumen percentage and reduced yolk percentage. Higher arginine and phytogenic additive levels reduced heterophyl:lymphocyte ratio and blood uric acid, total cholesterol, very-low density lipoprotein, and triglyceride levels. Dietary supplementation of 100 mg of phytogenic additive associated with high arginine levels increased nitric oxide production by peritoneal macrophages and 1056 mg of arginine increased antibodies titers against Newcastle disease virus. Blood and intestinal malonaldehyde levels were reduced when 200 mg of the phytogenic additive was added. Dietary supplementation of 968 mg of arginine or 100 mg of a phytogenic additive (40% Baccharis dracunculifolia, 20%
Astragalus membranaceus, 20% cinnamon, and 20% grape seed extracts) per kilogram of diet improves the feed conversion ratio and associated inclusion of 1144 mg of arginine and 100 mg of phytogenic additive per kilogram of diet improves immune responses and health status of brown-egg layers.
Key Words: aminoacids, Arg, laying hens, plant extract
Brazilian Journal of Animal Science
© 2017 Sociedade Brasileira de Zootecnia ISSN 1806-9290
www.sbz.org.br
R. Bras. Zootec., 46(6):502-514, 2017
Received: September 7, 2016
Accepted: April 18, 2017
*Corresponding author: [email protected] http://dx.doi.org/10.1590/S1806-92902017000600005
How to cite: Fascina, V. B.; Pasquali, G. A. M.; Berto, D. A.; Silva, A. L.; Garcia, E. A.; Pezzato, A. C.; Gonzales, E. and Sartori, J. R. 2017. Effects of arginine and phytogenic additive supplementation on performance and health of brown-egg layers. Revista Brasileira de Zootecnia 46(6):502-514.
Copyright © 2017 Sociedade Brasileira de Zootecnia. This is an Open Access article distributed under the terms of the Creative Commons Attribution License (http://creativecommons.org/licenses/by/4.0/), which permits unrestricted use, distribution, and reproduction in any medium, provided the original work is properly cited.
Introduction
Phytogenic additives consist of plant dry extracts and essential oils and may have antibacterial action, improve diet digestibility, and act as antioxidants, enhancing poultry performance and health as well as the quality of poultry meat and eggs (Zhao et al., 2011; Akdemir et al., 2012). Some of the phytogenic additives used in poultry feeds are
grape seed extract, Astragalus membranaceous extract, and cinnamon extract, which active principles boost the antioxidant system and stimulate the immune system of birds, specially humoral and cell-mediated immunity, thereby contributing to enhance dietary nutrient utilization (Fascina et al., 2012; Chamorro et al., 2013), which may lead to an increased uptake of fat (Fascina et al., 2012). The plant Baccharis dracunculifolia is native of South America and presents immunomodulating, antiulcerogenic, antimicrobial, and anti-inflammatory properties, in addition to being the main botanical source for the production of green propolis by bees (Lemos et al., 2007).
from ornithine, because they lack the enzymes carbamyl phosphatase synthetase and ornithine carbamyltransferase and depend exclusively on dietary arginine to meet their requirement; however, an excess of dietary aminoacids may lead to an increased uric acid production (Corzo et al., 2005).
Under field conditions, the stress caused by health, environmental, and management challenges increases the metabolic requirements of the immune system and for the maintenance of physiological functions. The use of phytogenic additives derived from a single plant source may not be sufficient to recover the metabolic homeostasis of challenged birds. However, studies have shown that the combined use of several plant extracts improve bird immune status, antioxidant status, diet digestibility, and pathogen elimination, consequently promoting better live performance (Akdemir et al., 2012). In addition to phytogenic additives, the supplementation of essential amino acids, such as arginine, above the requirements, allow birds to maintain adequate health status, thereby improving their performance (Fouad et al., 2013).
Considering that some phytogenic additives may lead to an increased immune response of birds and high dietary arginine levels may stimulate immune system, we hypothesize that supplementation of different levels of these feed additives may lead to a synergetic response on the performance and health status of birds. Given the lack of information about the interaction between the association of feed additives and layer nutrition, mainly with arginine supplementation above layer requirements, the objective of the present study was to evaluate the effect of the association of different digestible arginine levels with different levels of a phytogenic additive consisting of cinnamon, grape seed, Astralagus membranaceus, and Baccharis dracunculifolia extracts added to diet on the performance and health status of brown layers.
Material and Methods
The experiment was carried out in Botucatu, SP, Brazil, and approved by the Ethics Committee on Animal Use (144/2012-CEUA). The city is located under geographical coordinates: Latitude −22.8904, Longitude −48.4553, 22° 53' 25" S, 48° 27' 19" W.
Five hundred and four Hisex Brown layers, with 33 weeks of age at the beginning of the experiment, were evaluated until 49 weeks of age during two production cycles of eight weeks each (a total of 16 weeks). From the hatch to the initiation of dietary treatments at 33 weeks of age, birds were fed a common diet based on corn and soybean
without phytogenic additive or arginine supplementation. A completely randomized experimental design in a 4 × 3 factorial arrangement (dietary digestible arginine levels × phytogenic additive levels), with 12 dietary treatments with six replicates of seven birds each was applied. Treatments consisted of diets with four digestible arginine levels (880, 968, 1056, or 1144 mg Arg/kg feed) and inclusion of 0, 100, or 200 mg of a mixture of plant extracts (40% alcoholic extract of Baccharis dracunculifolia, 20% dry extract of Astragalus membranaceus lipopolysaccharides, 20% dry grape seed extract, and 20% dry cinnamon extract) per kg of diet. The detailed analyzed composition of active compounds of the phytogenic additives used are: Baccharis dracunculifolia containing 25% of baccharin, grape seed extract containing 75% of proanthocyanidins, composed mainly by resveratrol, and cinnamon extract with 10% of cinnamaldehyde and other polyphenols – all analyzed values.
Hens were housed in battery cages (100 cm long, 45 cm wide, 40 cm high) equipped with trough feeders and nipple drinkers. Hens were individually vaccinated against the Newcastle disease virus (NDV; La Sota strain) by eye drop at 40 weeks of age. During the entire experimental period, birds were subjected to the same feeding management, with water ad libitum and feed supplied twice daily. Eggs were collected once daily and feed intake was monitored weekly. A photoperiod of 17 h of light per day was applied. All parameters were evaluated based on cumulative data during the two production cycles (experimental weeks 41 and 49).
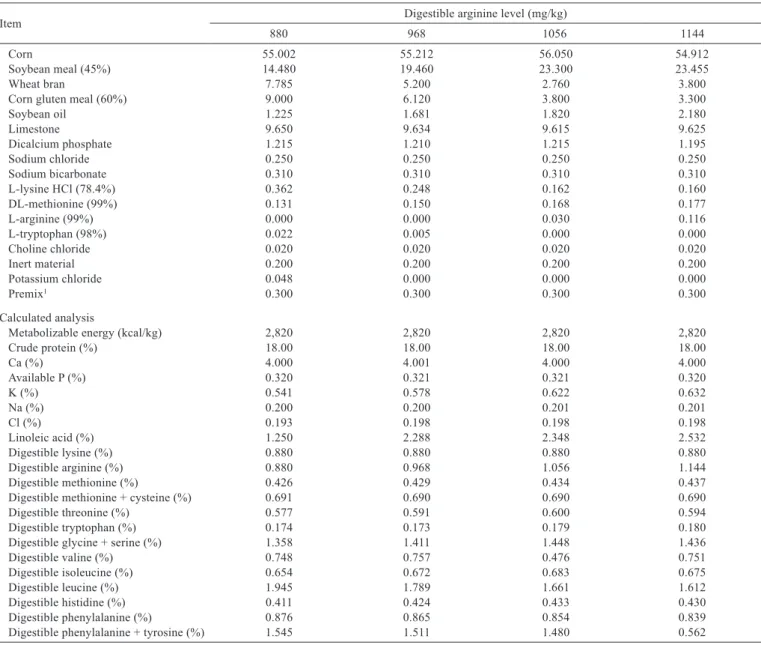
Experimental diets were based on corn and soybean meal and formulated to meet or exceed nutritional requirements of brown layers during their first egg production cycle (Table 1), according to the National Research Council (NRC, 1994), Rostagno et al. (2011), and the Hisex Brown management manual.
The following performance parameters were evaluated at the end of each production cycle: feed intake (g), egg production (%), egg mass (g), and feed conversion ratio (g of feed/g of eggs). External (eggshell percentage and egg specific gravity) and internal (albumen and yolk percentage and Haugh Unit) egg quality traits were evaluated in two eggs per experimental unit (12 eggs per dietary treatment), collected during the last three days of each production cycle.
At the end of each cycle, a hen with body weight closest to the average body weight of its experimental unit was sacrificed after 2 h of feed fasting. Spleen, thymus, and bursa were collected, weighed, and their weight relative to body weight was calculated.
for the analyses of total cholesterol (CHO), high-density lipoprotein (HDL), very-low density lipoprotein (VLDL), triglyceride (TG), glucose, uric acid, and creatinine-kinase (CK) levels using commercial kits (LaborLab®, São Paulo, Brazil). Levels were determined using an automated biochemical analyzer (BS 200, Mindray®, Shenzhen, China). Blood VLDL levels were determined by dividing TG values by 5.
One milliliter of blood of one hen per experimental unit was collected by ulnar vein puncture with a syringe with heparin for heterophil:lymphocyte (H:L) ratio determination. Differential leukocyte count was performed under an optical microscope at 100X magnification and 200 leukocytes were counted to determine H:L ratio.
Five milliliters of blood were collected by ulnar vein puncture of two hens per experimental unit to determine NDV antibody titers, using an immunoenzymatic assay (ELISA) from a commercial kit (IDEXX NDV Ab Test for chickens. IDEXX, Westbrook, Maine, United States).
One bird per experimental unit was intradermally inoculated on days 21 and 42 with 0.1 mL phytohemagglutinin (Cultilab®, Campinas, Brazil) in the third and the fourth interdigital spaces of the right foot and the same amount of saline solution was inoculated in the left foot. Skin thickness was measured before and 24 h after inoculation using a digital pachymeter. The results were obtained by the difference among measurements made at different times in mm.
Table 1 - Composition and nutritional levels of the experimental diets (as-fed basis)
Item Digestible arginine level (mg/kg)
880 968 1056 1144
Corn 55.002 55.212 56.050 54.912
Soybean meal (45%) 14.480 19.460 23.300 23.455
Wheat bran 7.785 5.200 2.760 3.800
Corn gluten meal (60%) 9.000 6.120 3.800 3.300
Soybean oil 1.225 1.681 1.820 2.180
Limestone 9.650 9.634 9.615 9.625
Dicalcium phosphate 1.215 1.210 1.215 1.195
Sodium chloride 0.250 0.250 0.250 0.250
Sodium bicarbonate 0.310 0.310 0.310 0.310
L-lysine HCl (78.4%) 0.362 0.248 0.162 0.160
DL-methionine (99%) 0.131 0.150 0.168 0.177
L-arginine (99%) 0.000 0.000 0.030 0.116
L-tryptophan (98%) 0.022 0.005 0.000 0.000
Choline chloride 0.020 0.020 0.020 0.020
Inert material 0.200 0.200 0.200 0.200
Potassium chloride 0.048 0.000 0.000 0.000
Premix1 0.300 0.300 0.300 0.300
Calculated analysis
Metabolizable energy (kcal/kg) 2,820 2,820 2,820 2,820
Crude protein (%) 18.00 18.00 18.00 18.00
Ca (%) 4.000 4.001 4.000 4.000
Available P (%) 0.320 0.321 0.321 0.320
K (%) 0.541 0.578 0.622 0.632
Na (%) 0.200 0.200 0.201 0.201
Cl (%) 0.193 0.198 0.198 0.198
Linoleic acid (%) 1.250 2.288 2.348 2.532
Digestible lysine (%) 0.880 0.880 0.880 0.880
Digestible arginine (%) 0.880 0.968 1.056 1.144
Digestible methionine (%) 0.426 0.429 0.434 0.437
Digestible methionine + cysteine (%) 0.691 0.690 0.690 0.690
Digestible threonine (%) 0.577 0.591 0.600 0.594
Digestible tryptophan (%) 0.174 0.173 0.179 0.180
Digestible glycine + serine (%) 1.358 1.411 1.448 1.436
Digestible valine (%) 0.748 0.757 0.476 0.751
Digestible isoleucine (%) 0.654 0.672 0.683 0.675
Digestible leucine (%) 1.945 1.789 1.661 1.612
Digestible histidine (%) 0.411 0.424 0.433 0.430
Digestible phenylalanine (%) 0.876 0.865 0.854 0.839
Digestible phenylalanine + tyrosine (%) 1.545 1.511 1.480 0.562
One bird per experimental unit was intraperitoneally inoculated with 1 mL of Sephadex solution (Sephadex G-50 Fine, Sigma Aldrich, at 3% in saline solution at 0.9%) per 200 g of body weight to attract macrophages to the abdominal cavity. Birds were sacrificed 48 h after inoculation and 20 mL of RPMI-1640 medium (Sigma-Aldrich) was injected in the abdominal cavity, which was then massaged to release the cells and for the collection of the abdominal liquid. The number of cells in each sample was determined by counting in a Neubauer chamber. Cell viability was determined by the technique of exclusion using Tripan Blue staining, which stains only non-viable cells, for the determination of H2O2 and NO production.
Hydrogen peroxide release by the macrophages was quantified using the method based on f phenol red oxidation by peroxidase-dependent H2O, as described by Russo et al. (1989). Sample aliquots containing abdominal cavity cells of one bird per experimental unit were used for the H2O2 production test. Samples were suspended in 1 mL phenol red to standardize the concentration to 2 × 10⁶ cells/mL and then plated (96-well plates). Plates were placed in an oven at 5% CO2 and 41 °C for 1 h, after which 10 µL sodium hydroxide (1M) were added to stop the reaction. Plates were read in an ELISA reader (TP-Reader, ThermoPlate, China) using a 630-nm wavelength filter. Hydrogen peroxide production (in nmols) was calculated according to a standard curve using absorbance values obtained for the dilutions of 1:10, 1:40, 1:80, and 1:160. Results were expressed in nmol of H2O2, using regression equations based on the standard curve.
Nitric oxide production by abdominal macrophages was determined by the colorimetric method, based on Griess reaction (Green et al., 1982), combining 100 μL of the test sample supernatant with 100 μL of Griess reagent (Need 0.1% and sulfanilamide at 1.0% in H3PO4 at 5.0%). Readings were performed in ELISA microreader at 540 nm wavelength. Results were expressed in µmols of NO/2 × 106 cells and compared with the optical density of the standard nitrogen dioxide curve.
The level of malonaldehyde (MDA) in the small intestine was determined in one bird per experimental unit at weeks 41 and 49, using the modified technique described by Madsen et al. (1998). Ten-g fractions of small intestine samples were homogenized for 1 min in 50 mL trichloroacetic acid (7.5%) in a mixer (Ultra-Turrax, IKA®, Staufen, Germany). Samples were then filtered and 5-mL aliquots were removed and mixed with 5 mL of a solution of 2-thiobarbituric acid (0.020 mol/L). The solution was placed in water bath (100 °C) for 10 min. Absorbance was
measured at 532 nm wavelength under a spectrophotometer (FeNto 600 Plus®, FENTO Indústria e Comércio de Instrumentos, São Paulo, São Paulo, Brazil). Levels of MDA were evaluated in duplicate and expressed in mg MDA/kg of intestinal tissue. Measurements were based on a standard curve (0.1-6 nmol/L concentration range) with 1,1,3,3-tetraethoxypropane.
Blood MDA was determined according to the spectrophotometric method described by Buege and Aust (1978) and Paya et al. (1992), which quantifies the complex formed by the reaction of two thiobarbituric acid molecules with one MDA molecule, yielding a pink chromogen that is quantified at 532 wavelength. Lipid peroxidation results were expressed in nmol of MDA/mL of blood, according to a standard MDA curve determined in a spectrophotometer (FeNto 600 Plus®, FENTO Indústria e Comércio de Instrumentos, São Paulo, SP, Brazil).
Data were subjected to ANOVA using the General Linear Model procedure of SAS statistical package (Statistical Analysis System, version 9.2) for completely randomized designs. Cage was the experimental unit for performance and egg quality analysis and hen for other data analysis. When significant, differences of least square means were compared by Tukey test (P<0.05). Analyses of regression of the arginine factor were not performed when the results were not significant (P>0.05) or R2<0.70, according to the PROC REG of SAS. Antibody titers against NDV were log2 transformed for statistical analysis.
Results
Egg production (%) was not affected by dietary supplementation of arginine or of phytogenic additive (P>0.05). There was an interaction between arginine and phytogenic additive for feed intake at week 41. Including phytogenic additive (100 or 200 mg/kg) to diet containing 1056 mg Arg/kg of feed reduced feed intake.
R2 = 0.98; EM
week 49 = −75.23478 + 0.25771 – 0.00012291x2, R2 = 0.88; FCR
week 49 = 8.60119 – 0.01264x + 0.00000603x2, R2 = 0.81).
Albumen percentage had a quadratic increase up to 1016 mg of Arg/kg of feed (Albumenweek 41 = 26.25999 + 0.07893x – 0.00003885x2, R2 = 0.99) (Table 3). Digestible arginine level of 1144 mg/kg of feed reduced eggshell percentage. The phytogenic additive increased Haugh unit values at the end of the experimental period. Yolk percentage was quadratically reduced up to 987 mg of Arg/kg feed (yolkweek 49 = 53.53506 – 0.05616x + 0.00002997x2, R2 = 0.76) and eggshell percentage linearly decreased as dietary arginine level increased (ESweek 49 = 10.98136 – 0.00091289x, R2 = 0.92).
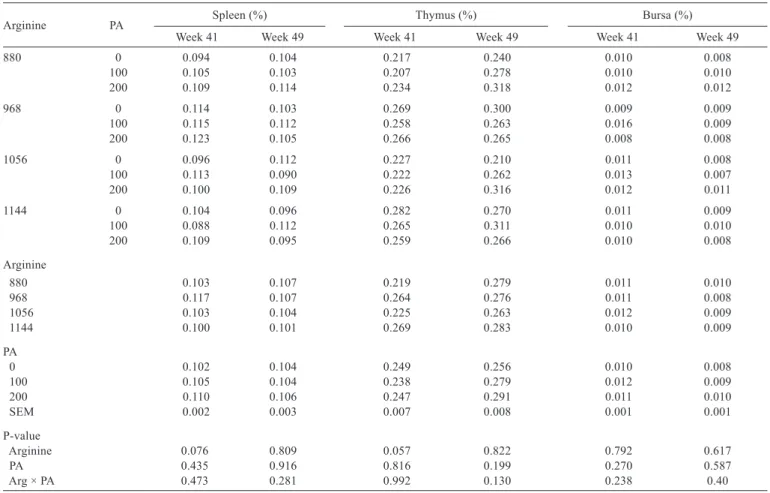
There was no effect of dietary treatments on the relative weight of the immune system organs of layers fed different arginine and phytogenic additive levels as evaluated at weeks 41 and 49 (Table 4).
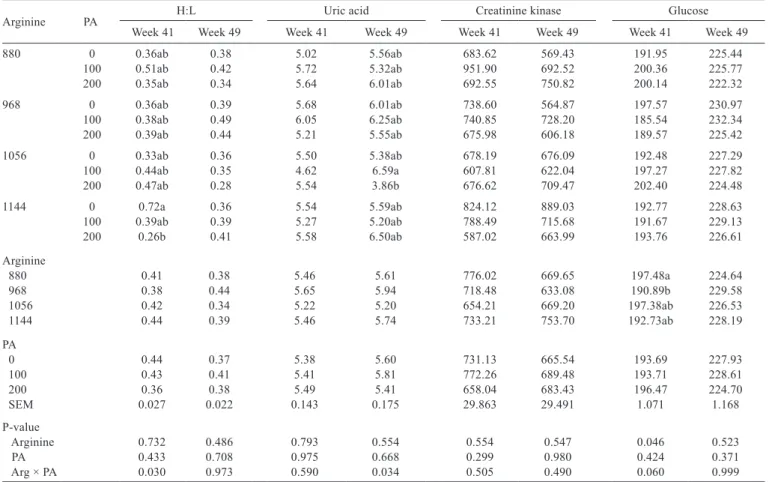
There was an interaction between arginine and phytogenic additive for H:L ratio and uric acid levels measured at weeks 41 and 49, respectively (Table 5). Hens
fed diets with 1144 mg of arginine and 200 mg of phytogenic additive per kg of feed presented lower H:L ratio than those not fed the phytogenic additive. The H:L ratio was quadratically reduced as arginine levels increased in diets without phytogenic additive up to 972.67 mg of Arg/kg of feed (H:Lweek 41PA0 = 12.89816 – 0.02385x + 0.00001226x2, R2 = 0.89). Hens fed diet with 1056 mg of arginine and 200 mg of phytogenic additive per kg presented the lowest uric acid concentration.
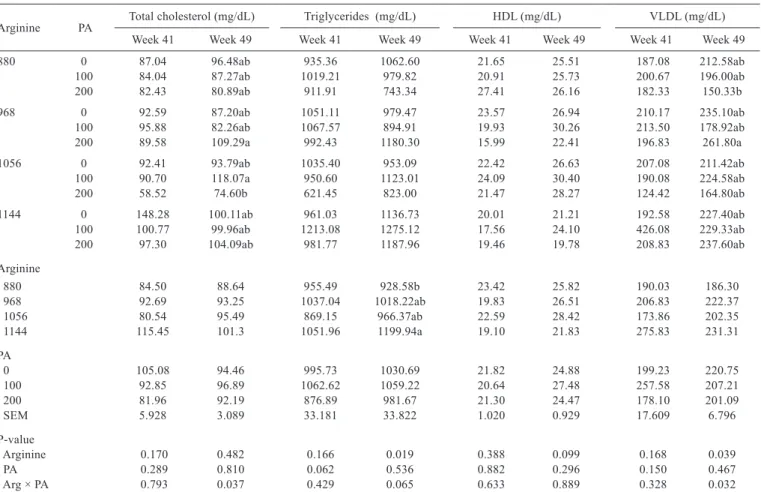
There was an interaction between arginine and phytogenic additive for CHO and VLDL blood levels at week 49 (Table 6). Hens fed diets containing 200 mg of phytogenic additive per kg of feed presented lower CHO and VLDL levels when diets were formulated to contain 1056 mg of arginine and 880 mg of arginine per kg of feed, respectively. Hens fed the diets containing 880 mg of arginine presented lower triglyceride levels than those fed 1144 mg of Arg/kg of feed.
On week 41, cutaneous basophil hypersensitivity (CBH) response quadratically increased with increasing arginine
Arginine PA Egg production (%) Feed intake (g/hen/day) Egg mass (g/hen/day) FCR (g/g) Week 41 Week 49 Week 41 Week 49 Week 41 Week 49 Week 41 Week 49
880 0 87.19 89.12 113.96ab 121.46 55.41 56.36 2.35 2.33
100 88.55 88.72 107.99b 113.19 55.52 55.37 1.94 2.10
200 90.40 92.07 110.91b 116.24 56.18 57.01 1.98 2.05
968 0 89.12 90.97 112.28ab 116.21 56.79 58.49 1.99 2.02
100 89.12 91.61 114.01ab 118.33 59.88 61.06 1.89 1.95
200 90.17 90.20 111.21b 115.36 58.04 59.34 1.90 1.95
1056 0 92.40 93.27 120.29a 125.04 60.10 59.91 1.96 2.11
100 87.47 89.84 109.19b 115.83 57.52 58.54 1.86 1.98
200 90.79 91.89 110.47b 117.07 58.52 59.11 1.88 2.00
1144 0 91.05 91.16 113.25ab 118.01 58.58 58.42 1.94 2.07
100 90.51 91.89 111.79ab 116.05 58.26 59.75 1.92 1.96
200 91.78 92.10 113.62ab 119.40 58.87 58.51 1.91 2.15
Arginine
880 88.71 89.97 110.95 116.96 55.70 56.25 2.09 2.16
968 89.47 90.93 112.50 116.63 58.24 59.63 1.93 1.97
1056 90.22 91.67 113.32 119.31 58.71 59.19 1.90 2.03
1144 91.11 91.72 112.89 117.82 58.57 58.89 1.92 2.06
PA
0 89.94 91.13 114.94 120.18a 57.72 58.29 2.06 2.13a
100 88.91 90.51 110.75 115.85b 57.79 58.68 1.90 1.99b
200 90.79 91.57 111.55 117.01ab 57.90 58.49 1.91 2.04ab
SEM 0.436 0.334 0.630 0.659 0.396 0.345 0.035 0.023
P-value
Arginine 0.242 0.198 0.485 0.408 0.024 0.002 0.210 0.037 PA 0.212 0.414 0.009 0.014 0.981 0.883 0.129 0.047 Arg × PA 0.480 0.167 0.032 0.066 0.564 0.510 0.710 0.406
Table 2 - Performance of layers fed different digestible arginine (Arg, mg/kg) and phytogenic additive (PA, mg/kg) levels
FCR - feed conversion ratio; SEM - standard error of mean.
a,b - Means followed by different letters within the same column are statistically different (P<0.05). Each mean represents six cages per treatment (with seven birds per cage).
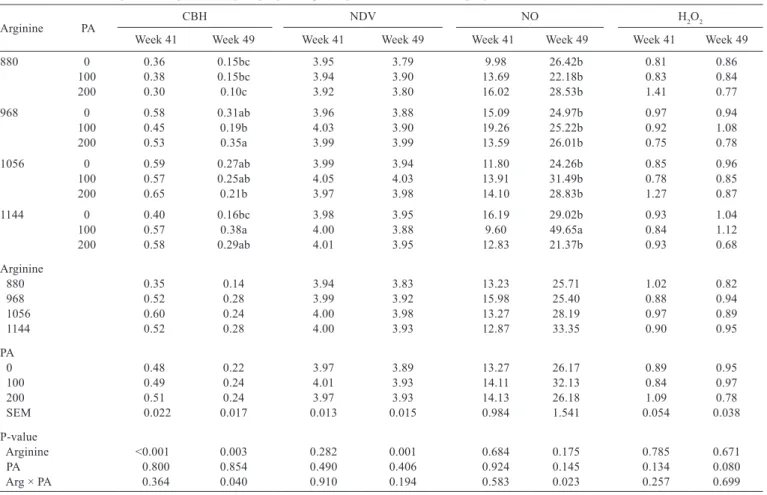
levels up to 1051 mg (CBH week 41Arg = −8.65689 + 0.01758x – 0.00000836x2; R2 = 0.99) (Table 7). There was an interaction between arginine and phytogenic additive for CBH evaluated at week 49. Hens fed diets with 200 mg of phytogenic additive and 968 mg of arginine per kg of diet presented stronger CBH than those fed 880 mg of Arg/kg of feed. Hens fed 100 mg of phytogenic additive/kg of diet presented a linear increase in CBH as arginine dietary level increased (CBH week 49100PA = −0.6424 + 0.00087614x; R2 = 0.93).
Antibody titers against NDV quadratically increased with increasing arginine levels up to 1055 mg of arginine (NDV week 49Arg = −1.27634 + 0.00994x – 0.00000471x2; R2 = 0.96). Hens fed diets with 1144 mg of arginine and 100 mg of phytogenic additive per kg presented higher NO production by peritoneal macrophages compared with those fed 0 mg and 200 mg of phytogenic additive per kg of feed. When diets contained 100 mg of phytogenic additive per kg, NO production linearly increased with increasing
arginine dietary levels (NO week 49100PA = −69.85412 + 0.10078x; R2 = 0.86).
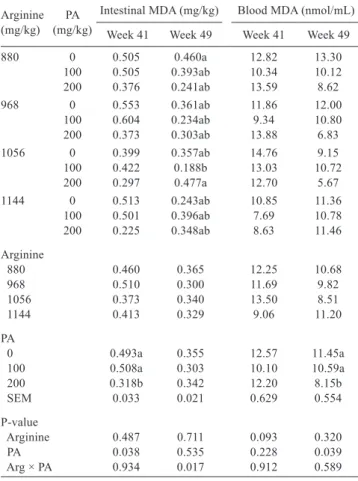
Hens fed diets with 200 mg of phytogenic additive per kg had lower intestinal MDA values at week 41 (Table 8). Supplementation of 1056 mg of arginine and 100 mg of phytogenic additive per kg of diet reduced MDA levels when compared with diets containing 0 mg or 200 mg of phytogenic additive measured at the end of the experimental period (week 49). There was no effect of arginine and phytogenic additive levels on blood MDA levels at week 41. However, at week 49, supplementation of 200 mg of phytogenic additive per kg of feed reduced blood MDA levels.
Discussion
The present study showed that the dietary inclusion of a phytogenic additive, consisting of a mixture of 40% Baccharis dracunculifolia, 20% Astragalus membranaceus,
Arginine PA Egg specific gravity (g/L) Haugh Unit Eggshell (%) Yolk (%) Albumen (%) Week 41 Week 49 Week 41 Week 49 Week 41 Week 49 Week 41 Week 49 Week 41 Week 49 880 0 1.096 1.097 87.34 87.53 10.29 10.27 24.04 24.58 65.64 65.30
100 1.096 1.102 88.16 88.97 10.11 10.12 24.45 24.91 65.38 64.91 200 1.097 1.097 84.84 86.59 10.06 10.10 24.18 24.73 65.76 65.35 968 0 1.096 1.097 86.04 86.57 9.94 10.13 23.64 24.30 66.42 65.65 100 1.097 1.096 87.70 89.04 10.09 10.08 23.17 23.96 66.73 66.07 200 1.096 1.102 87.14 87.50 10.05 10.17 23.94 24.30 66.01 65.45 1056 0 1.095 1.095 84.48 85.29 9.87 9.87 23.98 24.54 66.21 65.93 100 1.097 1.096 88.11 89.11 10.07 10.09 23.75 24.87 66.18 65.40 200 1.096 1.096 85.66 87.46 9.95 9.98 23.88 24.52 66.18 65.65 1144 0 1.095 1.095 86.64 86.53 9.95 10.04 24.14 24.60 65.91 65.38 100 1.096 1.096 87.06 88.32 9.96 10.03 24.53 25.16 65.51 65.01 200 1.094 1.094 85.07 86.31 9.74 9.79 24.34 25.00 65.90 65.31 Arginine
880 1.096 1.098 86.78 87.69 10.15a 10.16 24.22 24.74 65.59 65.19 968 1.096 1.096 86.96 87.70 10.03ab 10.12 23.58 24.19 66.39 65.72 1056 1.096 1.095 86.08 87.29 9.96ab 9.98 23.87 24.64 66.19 65.66 1144 1.095 1.095 86.26 87.05 9.89b 9.96 24.33 24.92 65.77 65.23 PA
0 1.096 1.095 86.12 86.48b 10.01 10.08 23.95 24.41 66.04 65.56 100 1.096 1.097 87.76 88.86a 10.06 10.08 23.97 24.72 65.95 65.35 200 1.096 1.096 85.68 86.96ab 9.95 10.01 24.08 24.64 65.96 65.44 SEM 0.001 0.001 0.385 0.334 0.033 0.029 0.108 0.093 0.109 0.093
P-value
Arginine 0.176 0.143 0.835 0.872 0.036 0.024 0.066 0.044 0.046 0.085 PA 0.332 0.316 0.079 0.011 0.383 0.525 0.861 0.627 0.928 0.626 Arg × PA 0.721 0.678 0.703 0.877 0.490 0.283 0.784 0.836 0.811 0.635
Table 3 - Egg quality parameters of layers fed different digestible arginine (Arg, mg/kg) and phytogenic additive (PA, mg/kg) levels
SEM - standard error of the mean.
a,b - Means followed by different letters within the same column are statistically different (P<0.05). Each mean represents two eggs per cage (12 eggs per dietary treatment).
Eggshell percentage week 49Arg = 10.98136 – 0.00091289x; R2 = 0.92.
20% cinnamon, and 20% grape seed extracts, together with the supplementation of 1056 mg arginine per kg of diet, which exceeds brown layer nutritional requirements, improved the performance by reducing feed intake and therefore, increasing feed efficiency. Zhao et al. (2011) demonstrated that plant compounds, such as cinnamaldehyde, catechins, cinnamic acid, terpenes, and resveratrol, stimulate the release of pancreatic enzymes, increase nutrient utilization, and mobilize a higher amount of amino acids for deposition in the eggs, resulting in better feed conversion ratio and lower feed intake, without affecting egg production, as observed in the present study. Despite not determined in the present study, higher pancreatic and intestinal enzyme secretion and activity were observed in broilers (Jamroz et al., 2005) fed diets supplemented with phytogenic additives, resulting in better performance and lower nitrogen excretion in the environment.
In addition to improving production performance, adequate essential amino acid supplementation promotes better internal and external egg quality (Novak et al., 2004; Silva et al., 2012). This effect was observed in the
present study, in which egg mass increased with arginine supplementation and presented a quadratic behavior up to 1048 mg of digestible arginine addition per kg of feed. Because calcium deposition in the eggshell does not depend on protein supplementation, the higher egg mass and egg weight observed resulted in a linear decrease in eggshell percentage, but did not change egg specific gravity. These results are different from findings of previous studies, which obtained higher egg weight as egg specific gravity decreased in broiler breeders (Silva et al., 2012) and in low-production layers (Basiouni et al., 2006).
In the present study, yolk percentage was quadratically reduced up to 987 mg Arg/kg, indicating that the observed egg mass increase was due to higher albumen deposition and not to yolk deposition. Literature studies indicate that, as commercial layers and breeders age, egg mass increases due to higher albumen or yolk deposition and eggshell becomes thinner (Roberts, 2004). However, at the same age, albumen and yolk deposition are apparently more dependent on nutrient supply, i.e., protein (amino acids) and lipid (fatty acids) supply, respectively. The results obtained with arginine supplementation (higher albumen
Arginine PA Spleen (%) Thymus (%) Bursa (%)
Week 41 Week 49 Week 41 Week 49 Week 41 Week 49
880 0 0.094 0.104 0.217 0.240 0.010 0.008
100 0.105 0.103 0.207 0.278 0.010 0.010
200 0.109 0.114 0.234 0.318 0.012 0.012
968 0 0.114 0.103 0.269 0.300 0.009 0.009
100 0.115 0.112 0.258 0.263 0.016 0.009
200 0.123 0.105 0.266 0.265 0.008 0.008
1056 0 0.096 0.112 0.227 0.210 0.011 0.008
100 0.113 0.090 0.222 0.262 0.013 0.007
200 0.100 0.109 0.226 0.316 0.012 0.011
1144 0 0.104 0.096 0.282 0.270 0.011 0.009
100 0.088 0.112 0.265 0.311 0.010 0.010
200 0.109 0.095 0.259 0.266 0.010 0.008
Arginine
880 0.103 0.107 0.219 0.279 0.011 0.010
968 0.117 0.107 0.264 0.276 0.011 0.008
1056 0.103 0.104 0.225 0.263 0.012 0.009
1144 0.100 0.101 0.269 0.283 0.010 0.009
PA
0 0.102 0.104 0.249 0.256 0.010 0.008
100 0.105 0.104 0.238 0.279 0.012 0.009
200 0.110 0.106 0.247 0.291 0.011 0.010
SEM 0.002 0.003 0.007 0.008 0.001 0.001
P-value
Arginine 0.076 0.809 0.057 0.822 0.792 0.617
PA 0.435 0.916 0.816 0.199 0.270 0.587
Arg × PA 0.473 0.281 0.992 0.130 0.238 0.40
Table 4 - Relative weight of the immune system organs of layers fed different digestible arginine (Arg, mg/kg) and phytogenic additive (PA, mg/kg) levels
SEM - standard error of the mean.
percentage and lower yolk and eggshell percentages) are consistent with the findings of Novak et al. (2004), who also observed that 44 to 63-week-old layers fed 900 mg lysine/kg also produced heavier eggs with higher albumen percentage and lower yolk percentage.
At the end of the experimental period, at week 49, Haugh units, which indicate albumen quality, increased when 100 mg of the phytogenic additive was added per kg of diet. The use of plant extracts with antioxidant and antibacterial activity, such as those included in the phytogenic additive used (grape seed, Astragalus membranaceus, cinnamon, and Baccharis dracunculifolia) may improve internal egg quality, as previously shown by Bozkurt et al. (2012), who added a mixture of oregano, basil, sage, myrtle, and fennel essential oils with citrus peel to layer diets. However, regardless of the action of the phytogenic additive, arginine supplementation did not affect albumen quality, as measured by Haugh unit.
Dietary addition of phytogenic additives with immunostimulating action (Rajput et al., 2013) or
the supplementation of arginine above the nutritional requirements (Ruiz-Feria and Abdukalykova, 2009) promotes the development of immune system organs of broilers. However, in the present study, no effect of phytogenic additive and/or arginine supplementation was detected on the relative weights of the spleen, thymus, or bursa of the evaluated layers. The physiological ages of broilers and commercial layers in production are very different, which may explain the differences in organ development responses, particularly of the immune organs. Therefore, the immune organs of physiologically mature chickens (layers in egg production) may respond differently to the supplementation of phytogenic additives and arginine compared with growing broiler chickens. Development of the immune system organs of 18-week-old pullets did not respond to dietary arginine levels as reported by Lieboldt et al. (2016).
Supplementation of phytogenic additives and arginine may promote stronger immune responses. Among other tools for the evaluation of the immune system, leukocyte
Arginine PA H:L Uric acid Creatinine kinase Glucose
Week 41 Week 49 Week 41 Week 49 Week 41 Week 49 Week 41 Week 49
880 0 0.36ab 0.38 5.02 5.56ab 683.62 569.43 191.95 225.44
100 0.51ab 0.42 5.72 5.32ab 951.90 692.52 200.36 225.77
200 0.35ab 0.34 5.64 6.01ab 692.55 750.82 200.14 222.32
968 0 0.36ab 0.39 5.68 6.01ab 738.60 564.87 197.57 230.97
100 0.38ab 0.49 6.05 6.25ab 740.85 728.20 185.54 232.34
200 0.39ab 0.44 5.21 5.55ab 675.98 606.18 189.57 225.42
1056 0 0.33ab 0.36 5.50 5.38ab 678.19 676.09 192.48 227.29
100 0.44ab 0.35 4.62 6.59a 607.81 622.04 197.27 227.82
200 0.47ab 0.28 5.54 3.86b 676.62 709.47 202.40 224.48
1144 0 0.72a 0.36 5.54 5.59ab 824.12 889.03 192.77 228.63
100 0.39ab 0.39 5.27 5.20ab 788.49 715.68 191.67 229.13
200 0.26b 0.41 5.58 6.50ab 587.02 663.99 193.76 226.61
Arginine
880 0.41 0.38 5.46 5.61 776.02 669.65 197.48a 224.64
968 0.38 0.44 5.65 5.94 718.48 633.08 190.89b 229.58
1056 0.42 0.34 5.22 5.20 654.21 669.20 197.38ab 226.53
1144 0.44 0.39 5.46 5.74 733.21 753.70 192.73ab 228.19
PA
0 0.44 0.37 5.38 5.60 731.13 665.54 193.69 227.93
100 0.43 0.41 5.41 5.81 772.26 689.48 193.71 228.61
200 0.36 0.38 5.49 5.41 658.04 683.43 196.47 224.70
SEM 0.027 0.022 0.143 0.175 29.863 29.491 1.071 1.168
P-value
Arginine 0.732 0.486 0.793 0.554 0.554 0.547 0.046 0.523
PA 0.433 0.708 0.975 0.668 0.299 0.980 0.424 0.371
Arg × PA 0.030 0.973 0.590 0.034 0.505 0.490 0.060 0.999
Table 5 - Heterophil:lymphocyte ratio (H:L), uric acid (mg/dL), creatinine kinase (IU/L), and glucose (mg/dL) blood levels of layers fed different digestible arginine (Arg, mg/kg) and phytogenic additive (PA, mg/kg) levels
SEM - standard error of the mean.
a,b - Means followed by different letters within the same column are statistically different (P<0.05). Each mean represents one bird per cage (six birds per dietary treatment).
Arginine PA Total cholesterol (mg/dL) Triglycerides (mg/dL) HDL (mg/dL) VLDL (mg/dL) Week 41 Week 49 Week 41 Week 49 Week 41 Week 49 Week 41 Week 49
880 0 87.04 96.48ab 935.36 1062.60 21.65 25.51 187.08 212.58ab
100 84.04 87.27ab 1019.21 979.82 20.91 25.73 200.67 196.00ab 200 82.43 80.89ab 911.91 743.34 27.41 26.16 182.33 150.33b
968 0 92.59 87.20ab 1051.11 979.47 23.57 26.94 210.17 235.10ab
100 95.88 82.26ab 1067.57 894.91 19.93 30.26 213.50 178.92ab 200 89.58 109.29a 992.43 1180.30 15.99 22.41 196.83 261.80a
1056 0 92.41 93.79ab 1035.40 953.09 22.42 26.63 207.08 211.42ab
100 90.70 118.07a 950.60 1123.01 24.09 30.40 190.08 224.58ab 200 58.52 74.60b 621.45 823.00 21.47 28.27 124.42 164.80ab 1144 0 148.28 100.11ab 961.03 1136.73 20.01 21.21 192.58 227.40ab 100 100.77 99.96ab 1213.08 1275.12 17.56 24.10 426.08 229.33ab 200 97.30 104.09ab 981.77 1187.96 19.46 19.78 208.83 237.60ab Arginine
880 84.50 88.64 955.49 928.58b 23.42 25.82 190.03 186.30
968 92.69 93.25 1037.04 1018.22ab 19.83 26.51 206.83 222.37
1056 80.54 95.49 869.15 966.37ab 22.59 28.42 173.86 202.35
1144 115.45 101.3 1051.96 1199.94a 19.10 21.83 275.83 231.31
PA
0 105.08 94.46 995.73 1030.69 21.82 24.88 199.23 220.75
100 92.85 96.89 1062.62 1059.22 20.64 27.48 257.58 207.21
200 81.96 92.19 876.89 981.67 21.30 24.47 178.10 201.09
SEM 5.928 3.089 33.181 33.822 1.020 0.929 17.609 6.796
P-value
Arginine 0.170 0.482 0.166 0.019 0.388 0.099 0.168 0.039
PA 0.289 0.810 0.062 0.536 0.882 0.296 0.150 0.467
Arg × PA 0.793 0.037 0.429 0.065 0.633 0.889 0.328 0.032
Table 6 - Blood lipids of layers fed different digestible arginine (Arg, mg/kg) and phytogenic additive (PA, mg/kg) levels
HDL - high-density lipoprotein; VLDL - very low-density lipoprotein; SEM - standard error of the mean. a,b - Means followed by different letters within the same column are statistically different (P<0.05). Each mean represents one bird per cage (six birds per dietary treatment).
profile helps to identify the efficiency of the action of immunostimulating agents and the effects of stressors. In the present study, layers fed 1114 mg Arg/kg and no phytogenic additive supplementation presented higher number of heterophils (data not shown), resulting in higher and statistically different H:L ratio compared with those fed the same arginine level, but also 200 mg of phytogenic additive/kg diet at week 41. This was also reported by Jahanian (2009) in broilers fed arginine above their nutritional requirements. Under stress (metabolic or other), the body of poultry reacts by stimulating heterophil production (Maxwell and Robertson, 1998), as it may be the case of the high arginine supplementation level (1144 mg/kg of feed) in the present study. The other experimental groups that were fed the same arginine level and were supplemented with the phytogenic additive presented H:L ratios considered optimal by Gross and Siegel (1993), possibly due to the immunoprotective or antioxidant action of the active principles of the plant extracts contained in the additive. At the end of the experiment (week 49), no significant differences in H:L ratios were observed among treatments, which is consistent with the reports of studies that applied
similar treatments to layers (Freitas et al., 2011) and broilers (Khalaji et al., 2011). As in the present study, all treatments resulted, at the end of the experiment, in H:L ratios considered low or optimal (minimum = 0.28 and maximum = 0.49); according to Gross and Siegel (1993), it was concluded that the birds did not suffer metabolic stress and were not immune-stimulated, as there was no increase in leukocyte values. Gross and Siegel (1993) propose the following H:L ratios for poultry: 0.20, 0.50, and 0.80, which characterize low, optimal, and high stress degrees, respectively.
Arginine PA CBH NDV NO H2O2 Week 41 Week 49 Week 41 Week 49 Week 41 Week 49 Week 41 Week 49
880 0 0.36 0.15bc 3.95 3.79 9.98 26.42b 0.81 0.86
100 0.38 0.15bc 3.94 3.90 13.69 22.18b 0.83 0.84
200 0.30 0.10c 3.92 3.80 16.02 28.53b 1.41 0.77
968 0 0.58 0.31ab 3.96 3.88 15.09 24.97b 0.97 0.94
100 0.45 0.19b 4.03 3.90 19.26 25.22b 0.92 1.08
200 0.53 0.35a 3.99 3.99 13.59 26.01b 0.75 0.78
1056 0 0.59 0.27ab 3.99 3.94 11.80 24.26b 0.85 0.96
100 0.57 0.25ab 4.05 4.03 13.91 31.49b 0.78 0.85
200 0.65 0.21b 3.97 3.98 14.10 28.83b 1.27 0.87
1144 0 0.40 0.16bc 3.98 3.95 16.19 29.02b 0.93 1.04
100 0.57 0.38a 4.00 3.88 9.60 49.65a 0.84 1.12
200 0.58 0.29ab 4.01 3.95 12.83 21.37b 0.93 0.68
Arginine
880 0.35 0.14 3.94 3.83 13.23 25.71 1.02 0.82
968 0.52 0.28 3.99 3.92 15.98 25.40 0.88 0.94
1056 0.60 0.24 4.00 3.98 13.27 28.19 0.97 0.89
1144 0.52 0.28 4.00 3.93 12.87 33.35 0.90 0.95
PA
0 0.48 0.22 3.97 3.89 13.27 26.17 0.89 0.95
100 0.49 0.24 4.01 3.93 14.11 32.13 0.84 0.97
200 0.51 0.24 3.97 3.93 14.13 26.18 1.09 0.78
SEM 0.022 0.017 0.013 0.015 0.984 1.541 0.054 0.038
P-value
Arginine <0.001 0.003 0.282 0.001 0.684 0.175 0.785 0.671
PA 0.800 0.854 0.490 0.406 0.924 0.145 0.134 0.080
Arg × PA 0.364 0.040 0.910 0.194 0.583 0.023 0.257 0.699
Table 7 - Cutaneous basophil hypersensitivity (CBH, mm) response, antibody titers against Newcastle disease virus (NDV, log2), and nitric
oxide (NO, μmol/2 × 106 cells) and peroxide (H
2O2, nmol/2 × 106 cells) production by peritoneal macrophages of layers fed
different digestible arginine (Arg, mg/kg) and phytogenic additive (PA, mg/kg) levels
SEM - standard error of the mean.
1 Difference in thickness (mm) of the third interdigital fold before and after phytohemagglutinin inoculation or injection with NaCl solution at 0.9%. a,b - Means followed by different letters within the same column are statistically different (P<0.05).
Each mean represents one bird per cage (six birds per dietary treatment), except for NDV (12 birds per dietary treatment). Cutaneous basophil hypersensitivity week 41Arg = −8.65689 + 0.01758x – 0.00000836x2; R2 = 0.99 (inflection point = 1051 mg/kg). Newcastle disease virus week 49Arg = −1.27634 + 0.00994x – 0.00000471x2; R2 = 0.96 (inflection point = 1055 mg/kg).
Cutaneous basophil hypersensitivity week 49100PA = −0.6424 + 0.00087614x; R2 = 0.93. Nitric oxide week 49100PA = −69.85412 + 0.10078x; R2 = 0.86.
were maintained within the range considered normal for poultry (200-500 mg/dL) (Campbell, 2004). Studies with other phytogenic additives also did not find any differences in blood glucose levels when birds were subjected to stress (Zhang et al., 2013).
The dietary inclusion of the phytogenic additive associated with the supplementation of 1056 mg of arginine reduced total CHO levels and 200 mg phytogenic additive and the basal level of arginine in the diet reduced VLDL levels. The reduction of CHO by phytogenic additives may be related to the inhibition of the enzyme HMG-CoA reductase, thereby reducing CHO biosynthesis (Ting et al., 2011). These results are consistent with studies that evaluated A. membranaceus (Zhang et al., 2013) extracts, hesperidin and naringin (Ting et al., 2011), and black cumin seeds (Yalçin et al., 2012). In the present study, hens fed 130% arginine presented reduced blood triglyceride levels. This
result is consistent with those of Fouad et al. (2013) in broilers fed arginine above their requirements, suggesting that extra arginine supply promoted the conversion of triglycerides into glycerol and free fatty acids, thereby reducing triglyceride blood levels.
Although the CBH test indicates the degree of immune organ responsiveness, particularly of the thymus that accounts for higher T lymphocyte and basophil release in the blood stream, the obtained results were not relevant. The only exception was that arginine inclusion level was lower (968 mg/kg of feed) when 200 mg of the phytogenic additive was added to the feed. The weaker CBH observed in the present study with the dietary inclusion of the phytogenic additive associated with arginine supplementation was also reported in studies with carvacrol associated with thymol (Hashemipour et al., 2013) and arginine (Jahanian, 2009).
sensitization with sheep red blood cells are simple, direct, and efficient methods to evaluate immune system responsiveness in poultry. The development and maturation of lymphoid organs, releasing defense cells, increases antibody production. In the present study, arginine supplementation increased anti-NDV antibody titers, demonstrating the immunostimulating effect of this amino acid on lymphoid organs, with higher production of T-cells, which are the cells that present antigens, and plasma cells. Some studies have reported this effect of arginine supplementation on broilers immunized against coccidiosis (Perez-Carbajal et al., 2010) or vaccinated against NDV (Jahanian, 2009) or infectious bursal disease (Ruiz-Feria and Abdukalykova, 2009).
High arginine levels associated with the phytogenic additive increased NO production by macrophages. This demonstrates the immunostimulating effect of arginine on the cell-mediated immune response, with higher macrophage and lymphocyte production and response (Guo
et al., 2015) and of the phytogenic additive, particularly of A. membranaceus and B. dracunculifolia extracts due to their proven immunostimulating and antibacterial actions (Qiu et al., 2007), resulting in higher heterophil and monocyte activity (Faix et al., 2009) and intestinal IgA production (Klasing, 2007).
The higher NO concentrations obtained in the hens fed the phytogenic additive are consistent with the findings of Gore and Qureshi (1997), who observed higher NO production by macrophages in the peritoneal cavity of broilers fed 10 IU of vitamin E in ovo. The authors attributed this result to the possible increased affinity of macrophage membrane receptor to stimulating agents, such as lipopolysaccharides, or to the higher NO synthesis promoted by vitamin E. This may have occurred in the present study due to the immunostimulating action of the lipopolysaccharides of A. membranaceus and to the action of baccharin present in B. dracunculifolia, increasing NO production. Other studies have previously demonstrated the immunostimulating action of those plants (Wang et al., 2015).
The dietary inclusion of the phytogenic additive reduced intestinal and blood MDA levels, showing the efficacy of its antioxidant action by reducing peroxidation and the release of free radicals. These effects are promoted by cinnamaldehyde present in cinnamon, resveratrol and proanthocyanins present in grape seed, B. dracunculifolia baccharin, cumaric and cafeic acids, and A. membranaceus polysaccharides. These results are consistent with the report of Faix et al. (2009), who also observed an antioxidant effect of cinnamon on the intestinal tissues, and with studies on the effects of other phytogenic additives on the muscle and other organs (Hashemipour et al., 2013). The blood MDA reduction results obtained in the present study were also observed with ginger extract (Zhao et al., 2011), carotenoids (Akdemir et al., 2012), A. membranaceus extract (Zhang et al., 2013), and carvacrol and thymol (Hashemipour et al., 2013).
Conclusions
Dietary supplementation of 968 mg of arginine or 100 mg of a phytogenic additive (40% Baccharis dracunculifolia, 20% Astragalus membranaceus, 20% cinnamon, and 20% grape seed extracts) per kilogram of diet improves the feed conversion ratio and associated inclusion of 1144 mg of arginine and 100 mg of phytogenic additive per kilogram of diet improves immune responses and health status of brown-egg layers.
Arginine (mg/kg) (mg/kg)PA
Intestinal MDA (mg/kg) Blood MDA (nmol/mL) Week 41 Week 49 Week 41 Week 49 880 0 0.505 0.460a 12.82 13.30
100 0.505 0.393ab 10.34 10.12 200 0.376 0.241ab 13.59 8.62 968 0 0.553 0.361ab 11.86 12.00
100 0.604 0.234ab 9.34 10.80 200 0.373 0.303ab 13.88 6.83 1056 0 0.399 0.357ab 14.76 9.15 100 0.422 0.188b 13.03 10.72 200 0.297 0.477a 12.70 5.67 1144 0 0.513 0.243ab 10.85 11.36
100 0.501 0.396ab 7.69 10.78 200 0.225 0.348ab 8.63 11.46 Arginine
880 0.460 0.365 12.25 10.68
968 0.510 0.300 11.69 9.82
1056 0.373 0.340 13.50 8.51
1144 0.413 0.329 9.06 11.20
PA
0 0.493a 0.355 12.57 11.45a
100 0.508a 0.303 10.10 10.59a 200 0.318b 0.342 12.20 8.15b
SEM 0.033 0.021 0.629 0.554
P-value
Arginine 0.487 0.711 0.093 0.320
PA 0.038 0.535 0.228 0.039
Arg × PA 0.934 0.017 0.912 0.589
Table 8 - Intestinal and blood malonaldehyde (MDA) levels of layers fed different digestible arginine (Arg) and phytogenic additive (PA) levels
SEM - standard error of the mean.
a,b - Means followed by different letters within the same column are statistically different (P<0.05).
Acknowledgments
The authors thank FAPESP for the grant (Process N. 2011/17570-9), CNPq for funding (Process 471531/2011-1), Ajinomoto for donating the amino acid, and CicloFarma for donating the B. dracunculifolia extract.
References
Akdemir, F.; Orhan, C.; Sahin, N.; Sahin, Dr. K. and Hayirli, A. 2012. Tomato powder in laying hen diets: effects on concentrations of yolk carotenoids and lipid peroxidation. British Poultry Science 53:675-680.
Basiouni, G.; Najib, H.; Zaki, M. M. and Al-Ankari, A. S. 2006. Influence of extra supplementation with arginine and lysine on overall performance, ovarian activities and humoral immune response in local saudi hens. International Journal of Poultry Science 5:441-448.
Bozkurt, M.; Küçükyilmaz, K.; Çatli, A. U.; Çmar, M.; Bintaş, E. and Çöven, F. 2012. Performance, egg quality, and immune response of laying hens fed diets supplemented with mannan-oligosaccharide or an essential oil mixture under moderate and hot environmental conditions. Poultry Science 91:1379-1386.
Buege, J. A. and Aust, S. D. 1978. Microsomal lipid peroxidation. Methods in Enzymology 52:302-310.
Campbell, T. W. 2004. Clinical Chemistry of Birds. p.479-492. In: Veterinary Hematology and Clinical Chemistry. Thrall, M. A., ed. Williams & Wilkins, Philadelphia.
Chamorro, S.; Viveros A.; Centeno, C.; Romero C.; Arija, I. and Brenes, A. 2013. Effects of dietary grape seed extract on growth performance, amino acid digestibility and plasma lipids and mineral content in broiler chicks. Animal 7:555-561.
Corzo, A.; Fritts, C. A.; Kidd, M. T. and Kerr, B. J. 2005. Response of broiler chicks to essential and non-essential amino acid supplementation of low crude protein diets. Animal Feed Science and Technology 118:319-327.
Faix, S.; Faixová, Z.; Plachá I. and Koppel, J. 2009. Effect of
Cinnamomum zeylanicum essential oil on anti-oxidative status in broiler chickens. Acta Veterinaria Brno 78:411-417.
Fascina, V. B.; Sartori J. R.; Gonzales, E.; Carvalho, F. B.; Souza, I. M. P. G.; Polycarpo, G. V.; Stradiotti, A. C. and Pelícia, V. C. 2012. Phytogenic additives and organic acids in broiler chicken diets. Revista Brasileira de Zootecnia 41:2189-2197.
Fouad, A. M.; El-Senousey, H. K.; Yang, X. J. and Yao, J. H. 2013. Dietary L-arginine supplementation reduces abdominal fat content by modulating lipid metabolism in broiler chickens. Animal 7:1239-1245.
Freitas, J. A.; Vanat, N.; Pinheiro, J. W.; Balarin, M. R. S.; Sforcin, J. M. and Venancio, E. J. 2011. The effects of propolis on antibody production by laying hens. Poultry Science 90:1227-1233. Gore, A. B. and Qureshi, M. A. 1997. Enhancement of humoral and
cellular immunity by vitamin E after embryonic exposure. Poultry Science 76:984-991.
Green, L. C.; Wagner, D. A.; Glogowski, J.; Skipper, P. L.; Wishnok, J. S. and Tannebaum, S. T. 1982. Analysis of nitrate, nitrite and [15N]nitrate in biological fluids. Analytical Biochemistry 126:131-138.
Gross, W. B. and Siegel, P. B. 1993. General principles of stress and welfare. p.21-34. In: Livestock, handling and transport. Grandin, T., ed. CAB International, Wallingford, UK.
Guo, Y. W.; Shi, B. L.; Yan, S. M.; Xu, Y. Q.; Li, J. L. and Li, T. Y. 2015. Effects of arginine on cytokines and nitric oxide synthesis in broilers. Journal of Animal & Plant Sciences 25:366-371. Hashemipour, H.; Kermanshahi, H.; Golian, A. and Veldkamp, T.
2013. Effect of thymol and carvacrol feed supplementation on performance, antioxidant enzyme activities, fatty acid composition, digestive enzyme activities, and immune response in broiler chickens. Poultry Science 92:2059-2069.
Jahanian, R. 2009. Immunological responses as affected by dietary protein and arginine concentrations in starting broiler chicks. Poultry Science 88:1818-1824.
Jamroz, D.; Wiliczkiewicz, A.; Wertelecki, T.; Orda, J. and Skorupińska, J. 2005. Use of active substances of plant origin in chicken diets based on maize and locally grown cereals. British Poultry Science 46:485-493.
Khalaji, S.; Zaghari, M.; Hatami, K. H.; Hedari-Dastjerdi, S.; Lofti, L. and Nazarian, H. 2011. Black cumin seeds, Artemisia leaves (Artemisia sieberi), and Camellia L. plant extract as phytogenic products in broiler diets and their effects on performance, blood constituents, immunity, and cecal microbial population. Poultry Science 90:2500-2510.
Klasing, K. C. 2007. Nutrition and immune system. British Poultry Science 48:525-537.
Lemos, M.; Barros, M. P.; Sousa, J. P. B.; Silva Filho, A. A.; Bastos, J. K. and Andrade, S. F. 2007. Baccharis dracunculifolia, the main botanical source of Brazilian green propolis, displays antiulcer activity. Journal of Pharmacy and Pharmacology 59:603-608. Lieboldt, M. A.; Frahm, J.; Halle, I.; Görs, S.; Schrader, L.;
Weigend, S.; Preisinger, R.; Metges, C. C.; Breves, G. and Dänicke, S. 2016. Metabolic and clinical response to Escherichia coli lipopolysaccharide in layer pullets of different genetic backgrounds supplied with graded dietary L-arginine. Poultry Science 95:595-611.
Madsen, H. L.; Sørensen, B.; Skibsted, L. H. and Bertelsen, G. 1998. The antioxidative activity of summer savory and rosemary in dressing stored exposed to light or in darkness. Food Chemistry 63:173-180.
Maxwell, M. H. and Robertson, G. W. 1998. The avian heterophil leucocyte: a review. World’s Poultry Science Journal 54:155-178. NRC - National Research Council. 1994. Nutrient requirements of
poultry. 9th rev. ed. Natl. Acad. Press, Washington, DC.
Novak, C.; Yakout, H. and Scheideler, S. 2004. The combined effects of dietary lysine and total sulfur amino acid level on egg production parameters and egg components in Dekalb Delta laying hens. Poultry Science 83:977-984.
Paya, M.; Halliwel, B. and Hoult, J. R. 1992. Interactions of a series of coumarins with reactive oxygen species: scavenging of superoxide, hypochlorous acid and hydroxyl radicals. Biochemical Pharmacology 44:205-214.
Perez-Carbajal, C.; Caldwell, D.; Farnell, M.; Stringfellow, K.; Pohl, S.; Casco, G.; Pro-Martinez, A. and Ruiz-Feria, C. A. 2010. Immune response of broiler chickens fed different levels of arginine and vitamin E to a coccidiosis vaccine and Eimeria challenge. Poultry Science 89:1870-1877.
Qiu, Y.; Hu, Y. L.; Cui, B. A.; Zhang, H. Y.; Kong, X. F.; Wang, D. Y. and Wang, Y. G. 2007. Immunopotentiating effects of four chinese herbal polysaccharides administered at vaccination in chickens. Poultry Science 86:2530-2535.
Rajput, N.; Naeem, M.; Ali, S.; Zhang, J. F.; Zhang, L. and Wang, T. 2013. The effect of dietary supplementation with the natural carotenoids curcumin and lutein on broiler pigmentation and immunity. Poultry Science 92:1177-1185.
Rostagno, H. S., Albino, L. F. T.; Donzele, J. L.; Gomes, P. C.; Oliveira, R. F. M.; Lopes, D. C.; Ferreira, A. S. and Barreto, S. L. T. 2011. brazilian tables for poultry and swine - composition of feedstuffs and Nutritional Requirements. 3rd ed. Vicosa, MG, Brasil. Ruiz-Feria, C. A. and Abdukalykova, S. T. 2009. Arginine and vitamin
E improve the antibody responses to infectious bursal disease virus (IBDV) and sheep red blood cells in broiler chickens. British Poultry Science 50:291-297.
Russo, M.; Teixeira, H. C. and Marcondes, M. C. 1989. Superoxide-independent hydrogen peroxide release by macrophages. Brazilian Journal of Medical and Biological Research 22:1271-1273. Silva, L. M. G. S.; Murakami, A. E.; Fernandes, J. I. M.; Dalla Rosa,
D.; Urgnani, J. F. 2012. Effects of dietary arginine supplementation on broiler breeder egg production and hatchability. Brazilian Journal of Poultry Science 14:233-304.
Ting, S.; Yeh, H. S. and Lien, T. F. 2011. Effects of supplemental levels of hesperetin and naringenin on egg quality, serum traits and antioxidant activity of laying hens. Animal Feed Science and Technology 163:59-66.
Wang, X.; Li, Y.; Shen, J.; Wang, S.; Yao, J. and Yang, X. 2015. Effect of Astragalus polysaccharide and its sulfated derivative on growth performance and immune condition of lipopolysaccharide-treated broilers. International Journal of Biological Macromolecules 76:188-194.
Yalçin, S.; Yalçin, S.; Uzunoğlu, K.; Duyum, H. M. and Eltan, Ö. 2012. Effects of dietary yeast autolysate (Saccharomyces cerevisiae) and black cumin seed (Nigella sativa L.) on performance, egg traits, some blood characteristics and antibody production of laying hens. Livestock Science 145:13-20.
Zhang, G. G.; Yang, Z. B.; Wang, Y. and Yang, W. R. 2013. Effects of
Astragalus membranaceus root processed to different particle sizes on growth performance, antioxidant status, and serum metabolites of broiler chickens. Poultry Science 92:178-183.