(Annals of the Brazilian Academy of Sciences) ISSN 0001-3765
www.scielo.br/aabc
Model of wetland development of the Amapá coast
during the late Holocene
JOSÉ T.F. GUIMARÃES1, MARCELO C.L. COHEN1,2, MARLON C. FRANÇA1,
RÚBEN J. LARA3 and HERMANN BEHLING4
1Programa de Pós-Graduação em Geologia e Geoquímica, Laboratório de Dinâmica Costeira
Universidade Federal do Pará, Av. Perimetral 2651, Terra Firme, 66077-530 Belém, PA, Brasil
2Faculdade de Oceanografia, Universidade Federal do Pará, Rua Augusto Corrêa, 1, Guamá, 66075-110 Belém, PA, Brasil 3Center for Tropical Marine Ecology (ZMT), Fahrenheitstr. 6, 28359 Bremen, Germany
4Department of Palynology and Climate Dynamics, Albrecht-von-Haller-Institute for Plant Sciences
University of Göttingen, Untere Karspüle 2, 37073 Göttingen, Germany
Manuscript received on September 23, 2008; accepted for publication on May 14, 2009
ABSTRACT
The modern vegetation types, sedimentary sequences, pollen records and radiocarbon dating obtained from three sed-iment cores from Calçoene Coastal Plain were used to provide a palaeoecological history during the late Holocene of Amapá coastal wetland according to flood regime, sea-level and climatic changes. Based on these records, four phases of vegetation development are presented and they probably reflect the interaction between the flow energy to the sediment accumulation and the brackish/freshwater influence in the vegetation. This work suggests inter-changes among time periods characterized by marine and fluvial influence. The longitudinal profile did not reveal the occurrence of mangrove in the sediment deposited around 2100 yr B.P. During the second phase, the mud pro-gressively filled the depressions and tidal channels. The mangrove probably started its development on the chan-nel edge, and the herbaceous field on the elevated sectors. The third phase is characterized by the interruption of mangrove development and the increase of “várzea” vegetation that may be due to the decrease in porewater salin-ity related to a decrease in marine water influence. The last phase is represented by the mangrove and “várzea” increase. The correlation between current patterns of geobotanical unit distribution and palaeovegetation indicates that mangrove and “várzea” forests are migrating over the herbaceous field on the topographically highest part of the studied coast, which can be related to a relative sea-level rise.
Key words:Amazon river, climatic changes, mangrove, palynology, sea-level.
INTRODUCTION
Mangroves are the most favorable environment for pa-laeoclimatic studies during the Holocene because of their high sedimentation rates and susceptibility to cli-matic and sea-level changes (Gornitz 1991). Hence, the sediments deposited beneath mangrove vegetation provide useful indications of tidal regime (Scholl 1964, Woodroffe 1981, Van de Plassche 1986). Furthermore,
Correspondence to: José Tasso Felix Guimarães E-mail: [email protected]
the relative proportion between mangrove and “várzea” vegetation contributes to the study of fresh and brackish-water influence, as mangroves are more tolerant to soil salinity (Lacerda et al. 1995, Youssef and Saenger 1999, Alongi et al. 2000) than “várzea” forest (Gonçalves-Alvim et al. 2001). Soil salinity is basically controlled by flooding frequency and position along the estuarine gradient (Lara and Cohen 2006).
gener-ally the response of individual mangrove species to the gradients of flooding frequency (Cohen and Lara 2003), waterlogging (Hutchings and Saenger 1987), nutrient availability (Junk 1997), soil salinity across the inter-tidal area (Wolanski et al. 1990) and volume of river water discharge, which depends of regional rainfall (Mörner 1999, Cohen et al. 2005b).
Palaeoecological and sedimentologial studies in the Amazon basin during the Late Pleistocene and Holocene have suggested that dryer periods correspond to less pre-cipitation and reduced river discharge (e.g. Colinvaux and De Oliveira 2000, Vital and Stattegger 2000, Maslin et al. 2000). Thus, interchanges between dry and wet periods may have significant impacts on coastal wetland, as they modify the soil salinity gradients and the soil moisture (Cohen et al. 2005a).
In a previous work using remote sensing (Cohen and Lara 2003), pollen analysis, and radiocarbon dating, it was possible to identify the impact of climatic changes during the last thousand years on the eastern sector of the Amazonian mangroves (Behling et al. 2001, 2004, Cohen et al. 2005a, b, 2008, Lara and Cohen 2008). Using these same tools, this work presents a model of wetland development of the Amapá coast during the late Holocene.
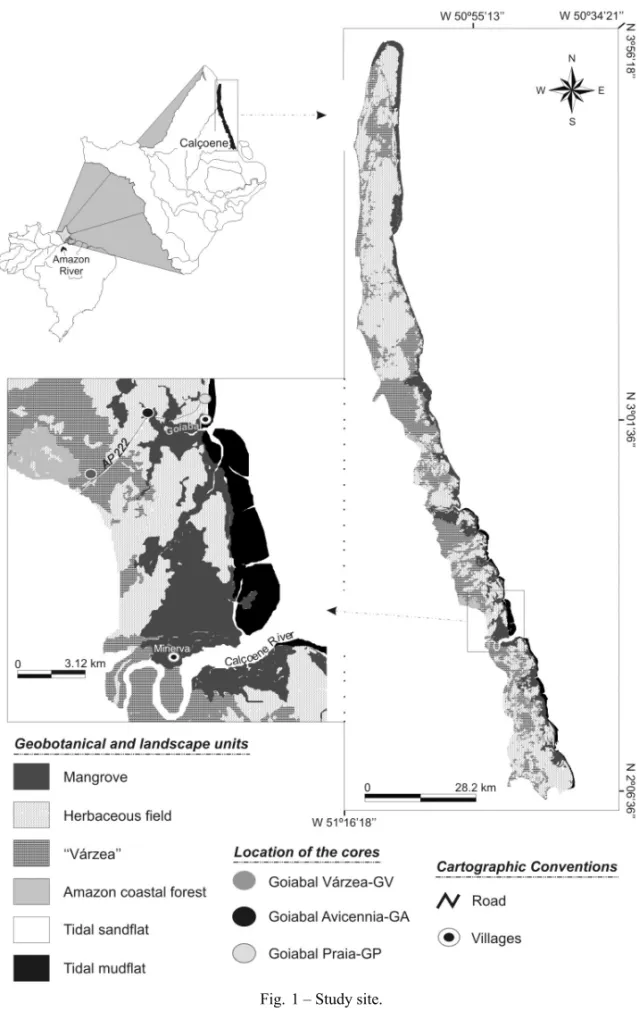
STUDYAREA
The study site is located close to the city of Calçoene on the Amapá coast, in the eastern Amazon region (Fig. 1). Allison et al. (1990) identified coastal mud-flat colonized by mangroves and marshes. According to Boaventura and Narita (1974), this region is charac-terized by Holocene deposits formed in a fluviomarine coastal plain with tidal influence. The area with muddy deposits is mainly colonized by mangroves. The tidal range is about 5.2 m and the current velocities reach 2 m/s (Schaeffer-Novelli and Cintron-Molero 1988).
Modern vegetation of the Calçoene is represented by “terra firme” (Amazon coastal forest) vegetation (10.288 km2), savanna (1.236 km2), mangrove, “várzea”
and flooded herbaceous plain (2.808 km2) (Morais and
Morais 2000). The periodically inundated herbaceous field occurs on the limit of the tidal influence and it is represented mainly by Poaceae, Cyperaceae, Nympha-ceae, AlismataNympha-ceae, Araceae and Maranthaceae.
Fol-lowing the topographical gradient, there is a perman-ently inundated herbaceous field composed of “agua-pé” (Eichornia crassipes(Mart.), “cabomba” (Cabomba
aquaticaDC.) and “mururé” (Nynphaeasp.) in some
sectors with small depressions that have no significant inflows, outflows and peat accumulation (Costa Neto 2004). The “várzea” vegetation includes “tiriricão”
(Scleria sp.), “aninga” (Montrichardia arborescens L.
Schott), “buriti” (Mauritia flexuosaL.f.), “açaí” ( Euter-pe oleraceaMart.), “mururés” (Eichorniasp.) and “piri”
(Cyperus giganteusVahl.). The mangroves present the
Avicennia nitidaJacq.,Avicennia germinans(L.) Stearn,
Rhizophora mangleL.,Lagunculariasp. and
Laguncu-laria racemosaGaertn. (Leite et al. 1974).
The following units represent the vegetation of study site: Amazon coastal forest, “várzea”, herbaceous field and mangrove (Fig. 1). Calçoene mangroves pres-ent an area of about 311 km2 and are densely covered
of forests, mainly byAvicennia,Rhizophora, and
Lagun-cularia, from the high spring tide to the mean tidal
level. The hinterland mangrove makes contact with the herbaceous field (1.201 km2) mainly represented by
Cyperaceae and Poaceae, conditioning the development of discontinuous fringes. The “várzea” forests are gen-erally represented byMauritia flexuosaL.f., Eichornia
sp., andEuterpe oleraceaMart. They cover an area of
about 684 km2, which is influenced by periodic floods
of sediment loaded, nutrient-rich fresh water rivers. Only a few sectors of topographically elevated areas are cov-ered by the Amazon coastal forest (18 km2).
MATERIALS AND METHODS
REMOTESENSINGDATA ANDIMAGEPROCESSING
Fig. 1 – Study site.
The radiometric correction was related to the atten-uation of atmospheric effects and was based on the min-imum histogram pixel approach (Chavez 1988). Image
were selected based on the optimum index factor scheme (Chavez et al. 1982), and chosen for visual inter-pretation. Validation was assisted by allocating ground control points for the classification of different phyto-physiognomies. The typical species of plants in each unit was documented by photographic documentation and GPS measurements. These sites were located in a Geographic Information System (GIS) by matching and distinguishing botanical formations.
SAMPLING ANDSAMPLEPROCESSING
Three sediment cores were collected using a Russian Sampler. The geographical position of the cores was determined by GPS. Sediment color was classified ac-cording to the Rock-Color Chart (Goddard et al. 1984). The cores were sampled from an area colonized by “várzea” (N 02◦34′38′′, W 50◦53′17′′), mangrove
vege-tation (N 02◦35′59′′, W 50◦52′08′′) and on a tidal
sand-flat (N 02◦36′48′′, W 50◦50′41′′), and they were called
Goiabal Várzea – GV (1.45 meter depth), Goiabal
Avi-cennia– GA (1.65 meter depth) and Goiabal Praia – GP
(1.45 meter depth), respectively (Fig. 1).
For pollen analysis, 1 cm3sediment samples were
taken at 5 cm intervals along the cores. Prior to pro-cessing the sediment, one tablet of exotic Lycopodium
spores was added to each sample for the calculation of pollen concentration (grains/cm3) and pollen
accumu-lation rates (grains/cm2/yr). All samples were prepared
using standard pollen analytical techniques including acetolysis (Faegri and Iversen 1989). Sample residues were mounted in a glycerin gelatin medium. Identifica-tion of pollen grains and spores were based on pollen morphological descriptions (Roubik and Moreno 1991, Herrera and Urrego 1996, Colinvaux et al. 1999). Sam-ples were counted to a minimum of about 300 pollen grains or to 100–200 pollen grains in the case of samples with a low pollen concentration. The total pollen sum excludes fern spores, fungal spores, algae and micro-foraminifers. Pollen and spore data are presented in pollen diagrams as percentages of the total pollen sum. Taxa were grouped into mangrove, herbaceous field, “várzea” and Amazon coastal forest. The softwares Tilia and Tilia Graph were used to the calculation and plot of the pollen diagrams (Grimm 1987).
RADIOCARBONDATING
Three bulk samples of 2 cm3each were used for
radio-carbon dating. The sediment samples were checked and mechanically cleaned under the microscope. The resid-ual material was then extracted with 1% HCl, 1% NaOH at 60◦C, and again 1% HCl (alkali residue). The
al-kali extraction of the organic fractions (humic acids) was precipitated with HCl, washed and dried. The14C
con-centration of the samples was measured by comparing the simultaneously collected 14C,13C, and12C beams
of each sample with those of Oxalic Acid standard CO2
and coal background material. The samples were an-alyzed by the Accelerator Mass Spectrometry (AMS) at the Leibniz Laboratory of Isotopic Research at the Christian-Albrechts University in Kiel (Germany). The calibration of the radiocarbon dates was carried out fol-lowing Stuiver et al. (1998). The results are reported in calibrated years before 1950 AD. (cal yr B.P.) with precision of 2σ.
RESULTS
TEXTURALDESCRIPTION OFSEDIMENTCORES
TABLE I
Textural description of the sediment cores.
Core Depth (cm) Textural description
0–40 Brown organic mud bioturbated 40–70 Dark gray organic clay, compact
Goiabal Várzea 70–90 Light gray mud with dark gray and grayish orange spots
90–145 Grayish orange silty clay with dark grey spots, very compact
0–40 Dark yellow oxidized mud, with light gray spots, somewhat fine sandy
Goiabal Avicennia 40–90 Light gray mud, compact 90–105 Dark gray organic mud
105–125 Light gray mud
125–165 Dark brown organic mud bioturbated
0–30 Moderate brown sand
30–50 Pale yellowish brown silty san with very few root fragments remains, compact
Goiabal Praia 50–70 Grayish brown sandy silt phitoturbated, compact 70–85 Moderate yellowish brown sand 85–95 Grayish brown sandy silt, compact 95–115 Moderate brown sand with dark brown spots 115–145 Moderate yellowish brown sand
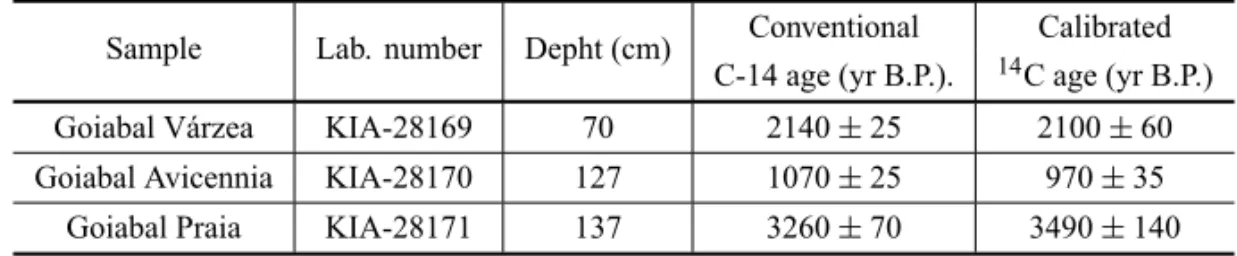
RADIOCARBONDATES ANDSEDIMENTATIONRATES
Radiocarbon dating of the GV core at 70 cm (KIA-28169), GA core at 127 cm (KIA-28170) and GP core at 137 cm (KIA-28171) depths yielded ages of 2100±
60, 970±35 and 3490±140 cal yr B.P, respectively.
The calculated sedimentation rates, based on the cali-brated radiocarbon dates (Table II), are about 0.33 mm/ yr (GV), 1.3 mm/yr (GA) and 0.39 mm/yr (GP), which are similar to sedimentation rates from other areas of the Pará coast, for instance, 0.3–1 mm/yr in the Marajó Island (Behling et al. 2004, Cohen et al. 2008), and 0.3–1.3 mm/yr in Taperebal (western Bragança) and Bragança Peninsula (Cohen et al. 2005a, Vedel et al. 2006). Besides, the sedimentation rates estimated in the study site are within the vertical accretion range of 8 to 0.1 mm/yr recorded in other mangrove forest (e.g. Bird 1980, Spenceley 1982, Cahoon and Lynch 1997).
Palaeoenvironmental studies on the Pará coast in-dicate a decrease in the sedimentation rate from the low to the topographically higher limit of the mangrove ar-eas (Cohen et al. 2005a, Behling et al. 2001), which
al-lowed to propose a model of Holocene mangrove de-velopment to Bragança Peninsula-northern Brazil (Co-hen et al. 2005b). Thus, the similar sedimentation rates between the Pará coast and the study site suggest that these sediments accumulated in a continuous way.
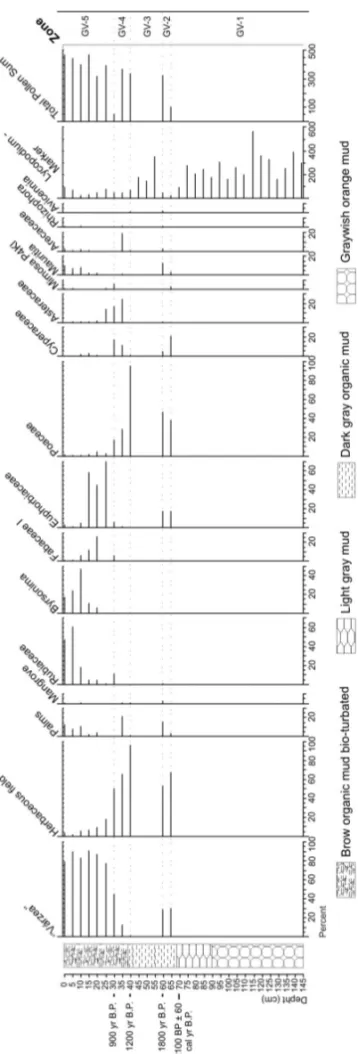
POLLENDATA
Based on the pollen analyses of the GV, GA and GP cores (Fig. 1), three pollen profiles were developed, which show the different paleovegetation zones (Figs. 2, 3 and 4).
GOIABALVÁRZEARECORD
The GV core base, in Zone GV-1 (145–65 cm, 16 sam-ples for pollen analysis), does not present pollen con-centration suitable for statistical analysis. However, in Zone GV-2 (65–60 cm, 2 samples) a sedimentary unit occurs mainly with herbaceous pollen, constituted by Poaceae (40–45%) and Cyperaceae (5–20%). “Várzea” pollen is frequent and consists of Euphorbiaceae (18%)
and Mauritia (2–11%). After this herbaceous field
TABLE II
Radiocarbon dates (AMS) of the samples.
Sample Lab. number Depht (cm) Conventional Calibrated C-14 age (yr B.P.). 14C age (yr B.P.)
Goiabal Várzea KIA-28169 70 2140±25 2100±60
Goiabal Avicennia KIA-28170 127 1070±25 970±35
Goiabal Praia KIA-28171 137 3260±70 3490±140
which characterizes again a barren interval with coal fragments restricted to Zone GV-3 (60–40 cm, 3 sam-ples). The next zone, GV-4 (40–30 cm, 3 samples), is represented by Poaceae (16–95%), Cyperaceae (2– 16%), Asteraceae (0–25%), Arecaceae (0–20%) and
Mimosa(0–5%) pollen, which represent an herbaceous
vegetation assembly. The top of GV core (Zone GV-5, 30–0 cm, 6 samples) is dominated by Euphorbiaceae (2–70%), Rubiaceae (2–60%), Fabaceae (2–25%),
Byr-sonima (0–47%) and Mauritia (0–14%) pollen, which
characterizes the current “várzea” vegetation (Fig. 2).
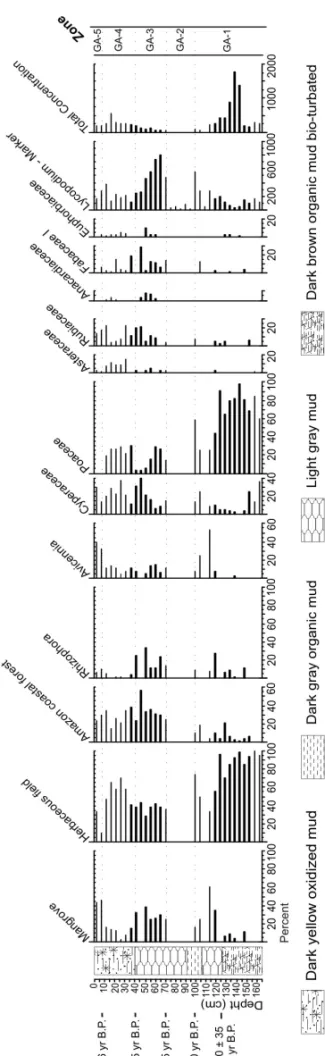
GOIABALAVICENNIARECORD
The GA core bottom, in Zone GA-1 (165–100 cm, 14 samples), is marked by the dominance of herbaceous field pollen, mainly constituted by Poaceae (25–97%) and Cyperaceae (5–36%). The mangrove pollen per-centage, represented byAvicennia(0–53%) and
Rhizo-phora(0–25%), increases to the top of this zone.
How-ever, the samples in the Zone GA-2 (100–70 cm, 5 sam-ples) did not present pollen (barren interval).
The next zone, GA-3 (70–40 cm, 6 samples), reveals a heterogeneous vegetation assembly. This zone is char-acterized by the herbaceous, Amazon coastal forest and mangrove pollen grains, mainly represented by Cyper-aceae (6–40%) PoCyper-aceae (5–30%), AsterCyper-aceae (2–5%), Rubiaceae (5–20%), Fabaceae (0–30%), Euphorbiaceae (0–10%), Anarcadiaceae (0–10%),Rhizophora(0–33%)
andAvicennia(0–15%).
In the Zone GA-4 (40–10 cm, 7 samples), the herba-ceous field (48–70%) and the Amazon coastal forest pollen (15–35%) are well represented, while the man-grove pollen decreases significantly (2–15%). However, the Amazon coastal forest and herbaceous pollens de-crease progressively until Zone GA-5 (10–0 cm, 2 sam-ples), which is marked by the mangrove pollen, mainly represented by Avicennia (35–40%) and Rhizophora
(5–10%). Nowadays, the study site is mainly colonized byAvicenniatrees.
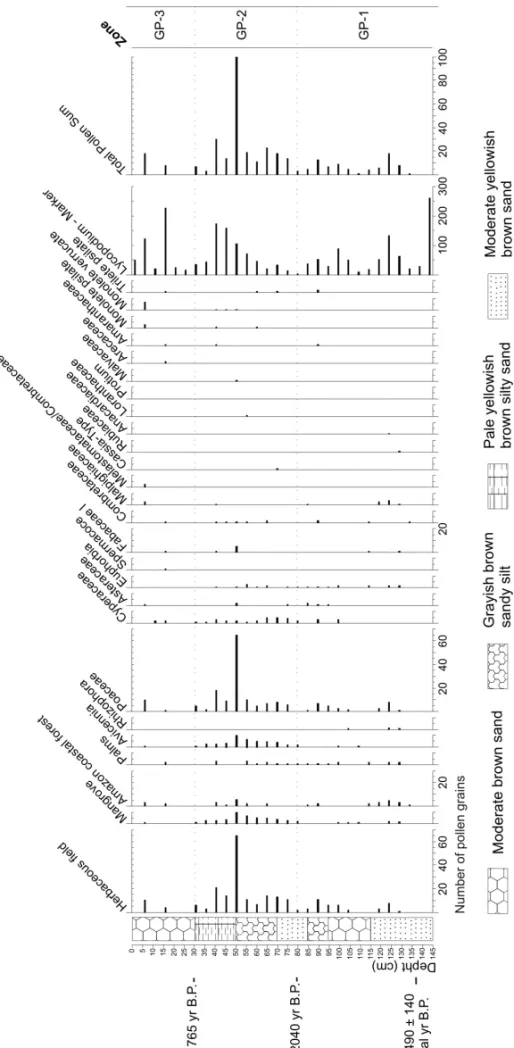
GOIABALPRAIARECORD
The Goiabal praia-GP core presents, for each sample, a mean pollen amount of one hundred (Fig. 4). The Zone GP-1 (145–80 cm, 13 samples) reveals a sector that was either unproductive or that contains only a few pollen grains. The next zone, GP-2 (80–30 cm, 11 samples), is characterized by the herbaceous, Amazon coastal forest and mangrove pollens, mainly represented by Poaceae (2–65%), Cyperaceae (1–5%) andAvicennia(2–10%).
This vegetation assembly probably indicates a sediment deposition in a transition environment between herba-ceous field and mangrove. In Zone GP-3 (30–0 cm, 6 samples) the pollen becomes less frequent, which char-acterizes again a barren interval.
In the case of the GP core, the low pollen quantity is probably due to the sediment grain size, because this core is constituted basically of sand. Grain size is the main factor determining the pollen preservation (Co-linvaux et al. 1999). The pollen fixed in muddy sedi-ments generally presents better preservation (Cohen 2003) ahead of the effects of biochemical action on pol-len and spore structure (Sangster and Dale 1961, 1964).
DISCUSSION
THEPOLLENSIGNAL IN THESEDIMENT
The pollen records of sediment cores assume that pollen accumulating in the sediment represents the vege-tation above (local vegevege-tation). Thus, the strength of the pollen signal from each kind of vegetation is distance-weighted (e.g. Davis 2000). The dates on the mod-ern pollen accumulation rate from Bragança Peninsula-northeastern Pará coast indicate that, in the mangroves,
Rhizophora is a very high pollen producer, while
Avi-cenniaandLagunculariaare very low ones. The pollen
accumulation rates ofRhizophoraandAvicenniaon the
Rhizophora/Avicenniadominated forest area are about
14.500 and 450 grains/cm2/yr, respectively. The pollen
traps from the herbaceous plain site, which are located at least 1–2 km away from the next Rhizophora trees
and 100 m away from the nextAvicennia, document an
average of 410 Rhizophoragrains/cm2/yr and an
aver-age of 8 Avicennia grains/cm2/yr. This indicates that
a certain amount of Rhizophora pollen grains can be
transported by wind, while wind transportation of
Avi-cenniapollen is very low (Behling et al. 2001).
There-fore, regarding the Goiabal sediments, it would be rea-sonable to propose that the vegetation patterns, which probably extended about 1 km, will be reflected in pollen records of the sediment cores. Those contributions to pollen loading at the sampling site from each vegetation pattern on the landscape will decrease with the increas-ing distance from the samplincreas-ing site.
THEWETLANDDYNAMICS
Krauss et al. (2008) described the effects that multi-ple ecological factors may have on mangrove develop-ment, such as salinity, light, nutrients, and flooding im-pact. In addition, they identified the importance of non-traditional factors – temperature, CO2, and sea-level rise
– as important drivers not only to mangrove establish-ment on a global scale, but also to seedling growth and persistence on a local scale.
Regarding the formation of the sedimentary de-posits from mangroves, this can be described by a com-bination of models that include both lateral accretion and aggradation (e.g. Woodroffe et al. 1989), follow-ing the topographic zone of mangrove development (Cohen et al. 2005a). The analysis of sub-environments set within a depositional system by facies variation can indicate lateral sediment accretion. The lateral migration
of sub-environments coexisting within a depositional system produces deposits with different characteristics that are superposed upon each other in the stratigraphic column. This mechanism can be driven by changes in the flow energy through, for example, wave action or tidal currents in mangrove forest (e.g. Furukawa and Wolan-ski 1996, Cohen and Lara 2003, Cohen et al. 2005b). This process can produce displacement of wetland zona-tion due to modificazona-tion of topography and flood fre-quency, imposing gradients in soil salinity. The wetland boundaries are displaced when the soil is inundated by brackish or saline tidal water. Therefore, there is no need to invoke only changes in seawater salinity to explain such vegetation migrations. This can also justify changes in a mangrove dominated byRhizophorato one
predom-inantly colonized byAvicenniaaccording to changes in
the topography, as the first mangrove genus has lower salinity tolerance than the second one.
Physical processes may be used to explain also the transition of terra firme to “várzea” vegetation. How-ever, these mechanisms explain certain wetland migra-tion, such as the “várzea”/mangrove one. Salinity is an essential physicochemical component for the survival of mangrove (e.g. Snedaker 1982, Clark et al. 1998, Alongi et al. 2000), while the “várzea” vegetation has low salin-ity tolerance (e.g. Wittmann et al. 2004, Junk 2005). Thus, it is probably necessary to invoke changes in tidal water salinity in this case.
GEOBOTANICALUNITS FROMCALÇOENE: DEVELOPMENT ANDDYNAMICS
1999, Cohen et al. 2005b). The specific properties of propagules, namely their dispersal characteristics (Ra-binowitz 1978), their mass arrival linked to individual storms (Eagler 1952, Pernetta 1993) and their resistance to consumption by predators (Smith et al. 1989), help to explain many features of the mangrove zonation. Flood tolerance (Naidoo 1985, McKee 1993) and the height of ground surface (Baltzer 1969, Chapman 1976) also indirectly control the zonation.
The term ‘Mangrove’ was used to denote the mor-pho-dynamic units within which mangrove forests are inserted. It includes the geophysical, geomorphic and biogeochemical components of the area (Thom 1984).
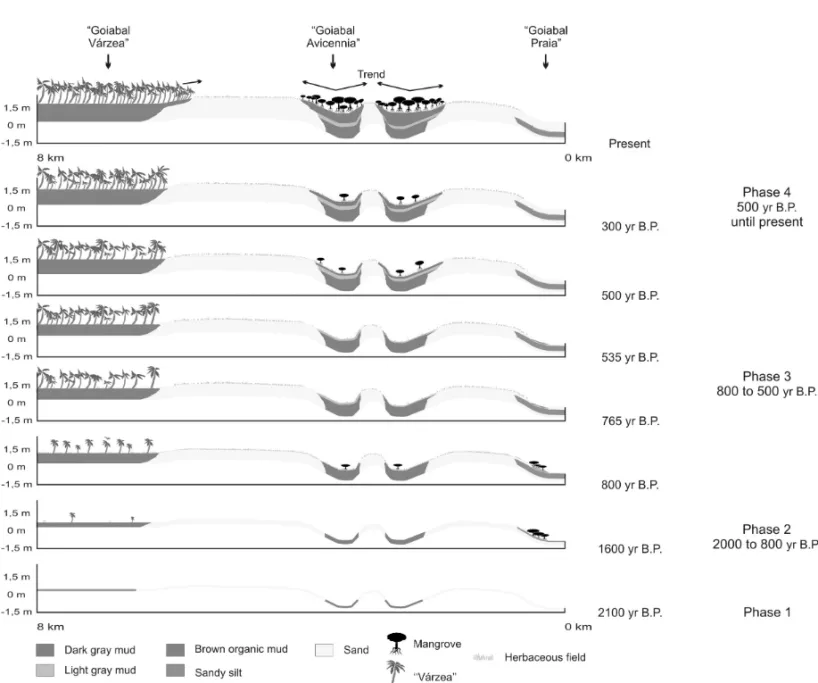
The sedimentary sequences, pollen records and distribution of modern vegetation types obtained from the study site, added to previously published models on mangrove development proposed to the Bragança Penin-sula, northern Brazil (Cohen et al. 2005a), allowed to propose a model of wetland development to the Amapá coast according to its flood regime, sea-level and cli-matic changes during the Late Holocene. Based on these records, four development phases are proposed (Fig. 5):
Phase 1
The longitudinal profile did not reveal the occurrence of mangrove in the sediment deposited around 2100 yr B.P (Zone GV-1). Sandy sediments covered topographically high areas and tidal flats, while the muddy sediments occupied coastal valleys.
Phase 2
The limited radiocarbon dates hinder a precise synchro-nization of the events. However, assuming a regular sed-imentation rate within the sediment accumulation rates obtained to the Pará coast (Behling et al. 2001, 2004, Cohen et al. 2005a, b, 2008, Vedel et al. 2006, Lara and Cohen 2008), from 1900 until 1200 yr B.P., the mud progressively filled the depressions and tidal channels. The mangrove probably started its development on the channel edge, and the herbaceous field on the high sec-tors. At the end of this time period, a brown organic mud was accumulated simultaneously to the herbaceous field at GA and GV sites. Mangrove and the “várzea” forest are still incipient.
At the GP site, between 1100 and 800 yr B.P., an increase in grain-size occurred (silty sand to sand), prob-ably originated from the increase in the water flow en-ergy, which buried the mangrove area, while the GA and GV sectors present transitional environments with herb-aceous field/mangrove and herbherb-aceous field/“várzea”, respectively (Zone GA-1 and GV-4).
Phase 3
The interruption of mangrove development in the zones GA-2 and GP-3, between∼760 and 530 yr B.P.,
indi-cates unfavorable conditions to mangrove development in these sectors, which may be due to the decrease in porewater salinity.
During this time interval, the “várzea” vegetation, adapted to fresh water flooding, expanded in GV area. This situation suggests that the study area may have been affected by a decrease in marine water influence.
Phase 4
Around 500 yr B.P., the environmental conditions fa-vored the mangrove development in GA site, as well as the “várzea” increase in GV site. The distance of the sampling sites to the coastline, which determines the soil salinity with the topography (Lara and Cohen 2006), may explain the simultaneous mangrove occurrence on the GA and the “várzea” colonization on the GV site.
Between 300-80 yr B.P., a retraction of the man-grove area occurred in the GA, while the herbaceous vegetation increased or was kept constant. During this interval, a decrease in the porewater salinity may have occurred again.
The correlation between current patterns of geo-botanical unit distribution and palaeovegetation indic-ates that mangroves and “várzea” forests are migrating over the herbaceous field on the topographically highest part of the studied coast.
CONCLUSIONS
Fig. 5 – Model of wetland development in the Calçoene coastal plain.
The correlation between current patterns of geo-botanical unit distribution and palaeovegetation indic-ates that mangroves and “várzea” forests are migrating over the herbaceous field on the topographically highest part of the study site, which can be related to a relative sea-level rise.
ACKNOWLEDGMENTS
We thank the members of the Center for Tropical Marine Ecology-Germany and of the Laboratório de Dinâmica Costeira-UFPa in Brazil for their support. This study was supported by the Conselho Nacional de Desenvolvimento Científico e Tecnológico (CNPq) process 562398/2008-2 and the German Ministry for Education and Research (BMBF) under the code 03F0154A.
RESUMO
segunda fase, a lama preencheu progressivamente as depres-sões e canais de maré. Provavelmente, os manguezais inicia-ram seu desenvolvimento nas margens dos canais, e os campos herbáceos nos setores elevados. A terceira fase é caracteri-zada por uma interrupção no desenvolvimento dos manguezais e a expansão da vegetação de várzea devido a uma diminuição na influência das águas marinhas. A última fase é represen-tada pela expansão de manguezais e várzeas. A correlação entre os padrões atuais de distribuição das unidades geobotâ-nicas e a paleovegetação indica que os manguezais e as flo-restas de várzea estão migrando sobre os campos herbáceos nos setores topograficamente mais elevados do litoral em es-tudo, o que pode estar relacionado a um aumento do nível relativo do mar.
Palavras-chave: rio Amazonas, mudanças climáticas, man-guezal, palinologia, nível do mar.
REFERENCES
ALLISON MA, NITTROUER CA, RINE JM, VITAL H, KUEHLSA, FARIAJRLEC, DIASGTM ANDFIGUE -REDOJRAG. 1990. Depocenters of Amazon River sedi-ment along the Amapá Coast-Brazil. AGU Fall Meeting. San Francisco. Abstract, 23–31.
ALONGIDM, TIRENDIFANDCLOUGHBF. 2000. Below-ground decomposition of organic matter in forests of the mangroveRhizophora stylosaandAvicennia marina along the arid coast of Western Australia. Aquat Bot 68: 97–122.
ANDERSENST. 1970. The relative pollen productivity and representation of North European trees, and correction for tree pollen spectra. Danm Geol Und (II) 96, 99 p. BALTZERF. 1969. Les formations vegetales associées au delta
de la Dumbea (Nouvelle Caledonie). Cah ORSTOM, Ser Geol 1: 59–84.
BALTZERF. 1970. Etude sédimentologique du marais de Mara (Côte ouest de la Nouvelle Calédonie) et de for-mations quaternaires voisines. Mémoires expédition fran-çaise sur les récifs coralliens de la Nouvelle Calédonie, Fondation Singer-Polignac 4: 146–169.
BEHLINGH, COHENMCLANDLARARJ. 2001. Studies on Holocene mangroves ecosystem of the Bragança Peninsula in north-eastern Pará, Brazil. Palaeogeogr Palaeclimatol Palaeoecol 167: 225–242.
BEHLING H, COHEN MCL AND LARA RJ. 2004. Late Holocene mangrove dynamics of Marajó Island in Ama-zonia, northern Brazil. Veget Hist Archaeobot 13: 73–80.
BIRDECF. 1980. Mangroves and coastal morphology. The Victorian Naturalist 97: 48–58.
BOAVENTURA FMCANDNARITA C. 1974. Geomorfolo-gia da Folha NA/NB.22 - Macapá. In: Projeto RADAM. Projeto de Integração Nacional. Rio de Janeiro: DNPM, Parte II 6: 1–36.
CAHOONDRANDLYNCHJC. 1997. Vertical accretion and shallow subsidence in a mangrove forest of southwest Florida: Mangroves and Saltmarshes 1: 173–186. CHAPMAN VJ. 1976. Manlal Vegetation of Papua New
Guinea, the Philippines and Oceania. In: CHAPMANVJ (Ed), Mangrove Vegetation. J Cramer Publ, Lichtenstein, 447 p.
CHAVEZ PS. 1988. An improved dark-object subtraction technique for atmospheric scattering correction of mul-tispectral data. Remote Sens Env 24: 450–479.
CHAVEZPS, BERLINGLANDSOWERSLB. 1982. Statis-tical method for selecting Landsat MSS ratios. J Appl Photogr Enging 8: 23–30.
CLARKMW, MCCONCHIED, LEWISDWANDSAENGER P. 1998. Redox stratification and heavy metal partition-ing inAvicenniadominated mangrove sediments: a geo-chemical model. Chem Geol 149: 147–171.
COHENMCL. 2003. Past and current mangrove dynamics on the Bragança peninsula, northern Brazil. PhD The-sis. Bremen, University of Bremen. Center for Tropical Marine Ecology, 110 p.
COHENMCLANDLARA RJ. 2003. Temporal changes of mangrove vegetation boundaries in Amazonia: Applica-tion of GIS and remote sensing techniques. Wetl Ecol Manag 11: 223–231.
COHENMCL, SOUZAFILHOPWM, LARARJ, BEHLING HANDANGULORJ. 2005a. A model of Holocene man-grove development and relative sea-level changes on the Bragança Peninsula (Northern Brazil). Wetl Ecol Manag 13: 433–443.
COHENMCL, BEHLINGHANDLARARJ. 2005b. Amazo-nian mangrove dynamics during the last millennium: The relative sea-level and the Little Ice Age. Rev Palaeobot Palyno 136: 93–108.
COHENMCL, LARARJ, SMITHCB, ANGÉLICARS, DIAS BSANDPEQUENOT. 2008. Wetland dynamics of Marajó Island, northern Brazil, during the last 1000 years. Catena 76: 70–77.
COLINVAUXPAANDDEOLIVEIRAPE. 2000. Palaeoecol-ogy and climate of the Amazon basin during the last glacial cycle. J Quat Sci 15: 347–356.
COSTANETOSV. 2004. Relatório de vegetação: Subsídio ao diagnóstico sócio ambiental. Relatório Técnico. Macapá: IEPA/GERCO, 32 p.
DAVISMB. 2000. Palynology after Y2K – understanding the source area of pollen in sediments. Annu Rev Earth Pl Sc 28: 1–18.
EAGLERFE. 1952. Southeast saline Everglades vegetation, Florida and its management. Plant Ecol 3: 213–265. FAEGRIKANDIVERSENJ. 1989. Textbook of Pollen
Anal-yses. J Wiley & Sons Ltd, Chichester, 328 p.
FURUKAWAKANDWOLANSKIE. 1996. Sedimentation in mangrove forests. Mangroves and Salt Marshes 1: 3–10. GODDARDEN, TRASKPD, FORDRK, ROVEON, SINGE -WALDJTANDOVERBECKRM. 1984. Rock- color chart. Geolog Soc Am, USA.
GONÇALVES-ALVIMSJ, VAZ DOSSANTOSMCFANDFER -NANDESGW. 2001. Leaf Gall Abundance onAvicennia germinans(Avicenniaceae) along an interstitial salinity gradient. Biotropica 33: 69–77.
GORNITZV. 1991. Global coastal hazards from future sea level Rise. Palaeogeogr Palaeclimatol Palaeoecol 89: 379–398.
GRIMM EC. 1987. CONISS: a FORTRAN 77 program for stratigraphically constrained cluster analysis by the method of the incremental sum of square. Comput Geosci 13: 13–35.
HERRERALF ANDURREGOLE. 1996. Atlas de polen de las plantas útiles y cultivadas de la Amazonia colombiana. Tropenbos Colombia, Bogotá, 462 p.
HUTCHINGSP AND SAENGERP. 1987. Ecology of Man-groves. Queesland University Press, 388 p.
JANSSENCR. 1973. Local and regional pollen deposition. In: BIRKSJHBANDWESTRG (Eds), Quaternary plant Ecology. Blackwell Scientific, Oxford, 326 p.
JUNKWJ. 1997. The Central Amazon Floodplain: Ecology of a Pulsing System. Springer, New York, 525 p. JUNKWJ. 2005. Flood pulsing and the linages between
ter-restrial, aquatic, and wetland systems. Verh Int Ver Theor Angew Limnol 29: 11–38.
KRAUSSKW, LOVELOCKCE, MCKEEKL, LÓPEZ-HOFF -MAN L, EWE SML ANDSOUSA WP. 2008. Environ-mental drivers in mangrove establishment and early de-velopment: A review. Aquat Bot 89: 105–127.
LACERDA LD, ITTEKKOT V AND PATCHINEELAM SR. 1995. Biogeochemistry of mangrove soil organic matter: a comparison betweenRhizophoraandAvicenniasoils in South-eastern Brazil. Estuar Coast Shelf Sci 40: 713–720. LARA RJ ANDCOHEN MCL. 2006. Sediment porewater salinity and mangrove vegetation height in Bragança, North Brazil: an ecohydrology-based empirical model. Wetl Ecol Manag 14: 349–358.
LARARJANDCOHENMCL. 2008. Palaeolimnological stud-ies and ancient maps confirm secular climate fluctuations in Amazonia. Climatic Change 94: 399–408.
LEITEPF, VELOSOHPANDGÓESFILHOL. 1974. Vege-tação da Folha NA/NB.22-Macapá. In: Projeto RADAM, Projeto de Integração Nacional. Rio de Janeiro: DNPM, Parte I 6: 9–40.
MASLINMA, BURNSSJ, DURHAME, GREIGS, GROOTES P, NADEAU MJ, PLATZMAN E, SCHLEICKER MAND SCHNEIDERR. 2000. High resolution marine palaeocli-mate records of the Amazon River discharge over the last 12,000 years. J Quat Sci 15: 419–434.
MCKEEKL. 1993. Soil physicochemical patterns and man-grove species distribution: Reciprocal effects? J Ecol 81(3): 477–487.
MENEZESM, BERGERUANDWORBESM. 2003. Annual growth rings and long-term growth patterns of mangrove trees from the Bragança peninsula, North Brazil. Wetl Ecol Manag 11(4): 233–242.
MORAISPD ANDMORAISJD. 2000. O Amapá em Pers-pectiva: uma abordagem histórico-geográfica. Editora Valcan, Macapá, 200 p.
MÖRNER NA. 1999. Sea-level and climate: rapid regres-sions at local warm phases. Quatern Int 60: 75–82. NAIDOO G. 1985. Effects of waterlogging and salinity on
plant water relations and on the accumulation of solutes in three mangrove species. Aquat Bot 22: 133–143. PERNETTAJC. 1993. Mangrove forests, climate change and
sea-level rise: hydrological influences on community structure and survival, with examples from the Indo-West Pacifi. A Marine Conservation and Development Report. IUCN, Gland (Switzerland), 46 p.
RABINOWITZD. 1978. Early growth of mangrove seedlings in Panama, and an Hypothesis concerning the relationship of dispersal and zonation. J Biogeogr 5: 113–133. ROUBIKDWANDMORENOJE. 1991. Pollen and Spores of
SANGSTERAGANDDALEHM. 1964. Pollen grain preser-vation of underrepresented species in fossil spectra. Can J Bot 42: 437–449.
SCHAEFFER-NOVELLIYANDCINTRON-MOLEROG. 1988. Expedição nacional aos manguezais do Amapá, Ilha de Maracá. Relatório técnico. Brasília: CNPq, 99 p. SCHOLLDW. 1964. Recent Sedimentary Record in Mangrove
Swamps and Rise in Sea Level Over the Southwestern Coast of Florida: Part 1. Mar Geol 1: 344–366.
SMITH TJ, CHANHT, MCIVORCCAND ROBBLEEMB. 1989. Comparisons of seed predation in tropical tidal forests from three continents. Ecology 70: 146–151. SNEDAKERSC. 1978. Mangroves: their value and
perpetua-tion. Nature Resour 14: 6–13.
SNEDAKERSC. 1982. Mangrove species zonation: Why? In: SENDNANDRAJPUROHITKS (Eds), Tasks for vegeta-tion science. Dr W Junk Publishers, The Hague, p. 111– 125.
SPENCELEYAP. 1982. Sedimentation patterns in mangal on Magnetic Island near Townsville, North Oueensland. AustraKa. Singapore J Trap Geog 24: 100–107. SUGITAS. 1994. Pollen representation of vegetation in
Qua-ternary sediments: theory and method in patchy vegeta-tion. J Ecol 82: 881–897.
STUIVERM, REIMERPJ, BARDE, BECKJW, BURRGS, HUGHENKA, KROMER B, MCCORMACG,VAN DER PLICHTJANDSPURKM. 1998. INTCAL98 Radiocar-bon Age Calibration, 24000-0 cal BP. RadiocarRadiocar-bon 40: 1041–1083.
THOMBG. 1984. Coastal landforms and geomorphic pro-cesses. In: SNEDAKERSCANDSNEDAKERJG (Eds), The Mangrove Ecosystem: Research Methods. Mono-graphs on Oceanographic Methodology, vol. 8. UNESCO, United Kingdom, p. 3–17.
VAN DEPLASSCHEO. 1986. Sea level research: A manual for the collecion and evaluation of data. Geobooks: Norwich, 615 p.
VEDELV, BEHLINGH, COHENMCLANDLARARJ. 2006. Holocene mangrove dynamics and sea-level changes in Taperebal, northeastern Pará State, northern Brazil. Veget Hist Archaeobot 15: 115–123.
VITALHANDSTATTEGGERK. 2000. Lowermost Amazon River: evidence of late Quaternary sea-level fluctuations in a complex hydrodynamic system. Quatern Int 72: 53– 60.
WITTMANNF, JUNKWJANDPIEDADEMTF. 2004. The várzea forests in Amazonia: flooding and the highly dy-namic geomorphology interact with natural forest succes-sion. For Ecol Manage 196: 199–212.
WOLANSKIE, MAZDAY, KINGBANDGAYS. 1990. Dy-namics, flushing and trapping in Hinchinbrook Channel, a giant mangrove swamp. Estuar Coast Shelf Sci 31: 555–579.
WOODROFFECD. 1981. Mangrove Swamp Stratigraphy and Holocene Transgression, Grand Cayman Island, West In-dies. Mar Geol 41: 271–294.
WOODROFFECD, CHAPPELLJ, THOMBGANDWALLEN -SKYE. 1989. Depositional model of a macrotidal estuary and flood plain, South Alligator River, northern Australia. Sedimentology 36: 737–756.