ABSTRACT: Agricultural intensification to improve wheat yield has increased the demand for nitrogen fertilizers. This study aimed to investigate the wheat response in succession to soybean due to application of nitrogen rates and sources in top dressing, as well as to determine the N rates of maximum technical yield (MTY) and maximum economic yield (MEY).A field experiment was carried out in Ponta Grossa, Paraná State, Brazil, on a clayey Typic Hapludox (Oxisol) under a continuous no-till. A randomized block design was used, with 3 replications in a 4 × 3 complete factorial arrangement. The treatments consisted of a control and 3 N rates at 40; 80 and 120 kg∙ha−1 as calcium nitrate (CN), ammonium sulfate (AS), and urea (UR) in top dressing at tillering of wheat crop. Increasing N
SOIL AND PLANT NUTRITION -
Article
Nitrogen fertilization in top dressing for wheat crop
in succession to soybean under a no-till system
Shivelly Los Galetto1*, Angelo Rafael Bini1, Adriano Haliski1, Danilo Augusto Scharr1,
Paulo Rogério Borszowskei2, Eduardo Fávero Caires3
1. Universidade Estadual de Ponta Grossa - Agronomia - Ponta Grossa (PR), Brazil. 2. Centro de Ensino Superior dos Campos Gerais - Agronomia - Ponta Grossa (PR), Brazil.
3. Universidade Estadual de Ponta Grossa - Departamento de Ciência do Solo e Engenharia Agrícola - Ponta Grossa (PR), Brazil.
*Corresponding author: shivelly@gmail.com
Received: Mar. 29, 2016 – Accepted: Sept. 5, 2016
rate in top dressing increased plant height, 1,000-grain mass, and grain yield, but it also favored the plant lodging and reduced the hectoliter mass of wheat. The N, P, Ca, and S concentrations in grains increased with N fertilization. MTY would be obtained at 96; 69 and 67 kg N∙ha−1 in top dressing, respectively, as CN, AS, and UR. Although CN proved to be an effective source of N for application in top dressing, its use was infeasible by the high cost of fertilizer. Both AS and UR showed economic viability, and MEY with these 2 sources would be obtained at a rate of 45 kg N∙ha−1 in top dressing for wheat yield of 4.0 t∙ha−1 in succession with soybean.
Nitrogen fertilization for wheat under no-till
INTRODUCTION
The main wheat producers in order of volume are the United States of America, China, and European Union (USDA 2016). Wheat is the major winter crop grown in Sothern Brazil in succession of corn or soybean (Mori e Ignaczak 2011). The estimated production of wheat in Brazil is around 6.0 million tons, with an average yield of 2.3 t∙ha−1 (CONAB 2016). Because nitrogen is the nutri-ent absorbed and exported in the largest amount by the wheat crop, proper management of N fertilization has been one of the most important management practices to increase wheat grain yield and quality (Rossi et al. 2013). In Southern Brazil, particularly in the states of Rio Grande do Sul and Santa Catarina, N recommendations for the wheat crop have been based on the soil organic matter (SOM) content and the previous crop (corn and soybean) with a grain yield of 2.0 t∙ha−1 (CQFS and SBCS 2004). It is also recommended adding 20 kg N∙ha−1 for the wheat grown after soybean and 30 kg N∙ha−1 for the wheat grown after corn, per additional ton of grain to be produced. The use of SOM content to calculate N rates is based on con-stant rates of mineralization and release of N. Since fac-tors related to soil, climate, and cropping system interfere with N mineralization, this type of recommendation has not shown great reliability (van Raij 2011).In the Paraná State, the N fertilizer recommendations for the wheat crop have been based solely on previous crop of corn or soy-bean (RCBPTT 2014).
The development of more productive genotypes requires some adjustments in N fertilization to meet adequate demand of N by plants. When applied at a low rate, N can limit grain yield, whereas excessive N rate can cause plant lodging, making it difficult to harvest and reduce wheat yield (Schwenke et al. 2014). In addition, the use of exces-sive N rate results in a high risk to the environment, lead-ing to economic and environmental unsustainability of the agricultural system.
Urea (UR) is the most produced and used N source in agriculture. However, depending on soil and weather condi-tions, considerable NH3-Nlosses by volatilization can occur following UR application on the soil surface (Soares et al. 2012; Schwenke et al. 2014). Wheat in Southern Brazil has been grown in no-till systems. Cover crop residue on the soil surface, which is essential to the no-till success, reduces the contact of the fertilizer with the soil and decreases the
conversion of NH3 to NH4+, favoring NH
3 volatilization losses (Prando et al. 2013). The NH3 losses occur due to hydrolysis of UR by urease, producing ammonium car-bonate, which readily unfolds in NH3 e CO2 (Tasca et al. 2011).The rate of hydrolysis of UR is influenced by the amount and type of vegetation present in the soil surface, as well as amount of N applied (Espindula et al. 2014).
Because of high cost of N fertilizer for production crop, the use of N sources which promote lower N-NH3 losses by volatilization, as calcium nitrate (CN) or ammonium sulfate (AS), would be a way to increase fertilizer efficiency and maximize wheat yield (Yano et al. 2005; Teixeira Filho et al. 2010; Prando et al. 2013; Schwenke et al. 2014). Since Ca exhibits synergism with N (Franco et al. 2007), using an N source containing Ca could increase the N use efficiency by wheat. However, there is insufficient information on the efficiency and economic viability of using CN in wheat crop. Field studies comparing traditional N sources applied in top dressing in wheat, such as AS and UR, with the use of CN (which contains Ca in its composition), are essential to evaluate the N use efficiency and to define appropriate rates of application by the N sources.
This study reports a field trial that examined the effects of N rates and sources in top dressing at tillering of wheat following soybean in a no-till system on yield and quality of wheat. The objectives were (i) to evaluate grain yield and nutrient concentration in grain of wheat as affected by N rates applied in the forms of CN, AS, and UR; (ii) to deter-mine the N rates of maximum technical yield (MTY) and maximum economic yield (MEY) to obtain high wheat yield.
MATERIAL AND METHODS
The experiment was carried out in Ponta Grossa, Paraná, Brazil (lat 25°03′S; long 50°05′W) on a clayey Typic Hapludox (Oxisol) (Embrapa 2013). According to Köppen-Geiger System (Peel et al. 2007), the climate at the site is classified as a Cfb type (mesothermal, humid, subtropical), with mild summer, frequent frosts during the winter, and no defined dry season. The average altitude is 972 m with average maximum and minimum temperatures of 22 and 13 °C, respectively. The annual precipitation is about 1,550 mm. Before the establishment of the experiment, soil chemical and granulometric analyses of the 0 – 0.20 m depth showed the following results: pH (1:2.5 soil: 0.01 mol∙L−1 CaCl
of 4.8; total acidity (H + Al) of 70.8 mmolc∙dm−3; exchangeable Ca2+, Mg2+, and K+ contents of 33.5; 9.0 and 2.0 mmol
c∙dm −3, respectively; P (Mehlich-1) of 10.7 mg∙dm−3; SO
4–S (0.01 mol∙L−1 calcium phosphate) of 8.3 mg∙dm−3; total organic matter of 43.9 g∙dm−3; and 490; 122 and 388 g∙kg−1 of clay, silt, and sand, respectively. The field site had been used for grain cropping under the no-till system during 10 years with predominance of soybean-wheat succession. Only during the 2007 and 2012 winter season, black oat was grown as a cover crop.
A randomized block design was used, with 3 replications in a 4 × 3 complete factorial arrangement. Plot size was 5.0 × 4.0 m, with 23 rows. The treatments consisted of a control and 3 N rates at 40; 80 and 120 kg∙ha−1 as CN, AS, and UR in top dressing at tillering of wheat crop. The N sources used contained in its composition: CN — 160 g N∙kg−1 and 136 g Ca∙kg−1; AS — 210 g N∙kg−1 and 220 g S∙kg−1; and UR — 440 g N∙kg−1. The N rates as CN, AS, and UR were applied manually in a single application on the total area at the soil surface of each plot at 20 days after plant emergence, preceding a rain event of 20 mm.
Wheat (Triticum aestivum L.) cv. Supera was sown on
June 22, 2014, after the soybean crop at a seeding rate of 58 seeds∙m−1 and row spacing of 0.17 m. During wheat sowing, 330 kg∙ha−1 of the 5–25–25 (N–P
2O5–K2O) formula were applied. The control of pests, disease, and weeds was carried out according to the needs of the wheat crop, so as to enable adequate development of the plants to achieve the maximum grain yield potential. The air temperature and rainfall historical averages (40 years) as well as those that occurred during the wheat crop development period in 2014 are shown in Figure 1.Throughout the development period
of the wheat crop, there was no water limitation. Rainfall and temperature data for the duration of the experiment were very close to the historical average of the region.
Samples of wheat flag leaves were collected for foliar analysis diagnosis, in 30 plants of each subplot, during the crop flowering period. The concentrations of N, P, K, Ca, Mg, and S in leaves were determined according to the procedures described by Malavolta et al. (1997).
At physiological maturity of the wheat crop, plant height and percentage of lodged plant were determined according to the methodology described by Prando et al. (2012). Plant height was evaluated in 3 plants of each plot (from the plant base to the apex of the principal stem, excluding the awn). Lodging of the plants was also evaluated by visual estimation of the percentage of plants with slope upper than 45° in a central area of 12 m² of each plot. Soon after, grain was harvested from 7.65 m2 (middle of 15 rows × 4 m in length), and grain yield was expressed in 130 g∙kg−1 moisture content. After harvest, a sample grain was ground, and grain concentrations of N, P, K, Ca, Mg, and S were analyzed according to the procedures described in Malavolta et al. (1997).
The 1,000-grain mass was determined by weighing 2 sub-samples of 500 grains of each plot and the hectoliter mass (HM), by weighing a sample of known volume (250 mL), being the result transformed in standard unit (kg∙hL−1).
The partial factor productivity of N (PFPN) was cal-culated according to Ladha et al. (2005) by the equation:
PFPN (kg∙kg−1) = G N/NA
where: GN is the grain yield by adding a determined N rate (kg∙ha−1); N
A is the amount of N (kg∙ha
−1) applied. For this calculation, it was used the total amount of N applied in wheat crop in both sowing and top dressing. Data were submitted to analysis of variance and regression methods. The N rates applied were analyzed through regression analyses where the criterion for model selection was the magnitude of the determination coefficients significant at p < 0.05. The effects of N sources were compared by the Tukey’s test at p = 0.05. Statistical analysis was performed by using the computational program Sisvar 5.3. An economic analysis of N fertilization was conducted using global average prices of the products over the last 5 years. The average prices of fertilizers per kg of N, based on Cost, Insurance and Freight (CIF) payment, Figure 1. Monthly rainfall and temperature during the development
period of the wheat crop in 2014, and 40 years average monthly rainfall and temperature at Ponta Grossa, Southern Brazil.
Jun Jul Aug Sep Oct
20
15
10
Oct
Temper
atur
e (°
C)
R
ainf
all (mm)
5
0
200
150
100
50
0
Rainfall - 2014
Temperature - 2014 Temperature - 40 years
Rainfall - 40 years
Nitrogen fertilization for wheat under no-till
were estimated at $ 3.86 for CN, $ 1.94 for AS, and $ 1.37 for UR. The average price of wheat was estimated at $ 263.00 per ton of grain. Based on average prices of the products, the ratio of unit cost between kg of N and kg of wheat grain was 14.7 for CN, 7.4 for AS, and 5.2 for UR. MTY and MEY of N in top dressing were calculated according to the procedures described by Alvarez (1994).
RESULTS AND DISCUSSION
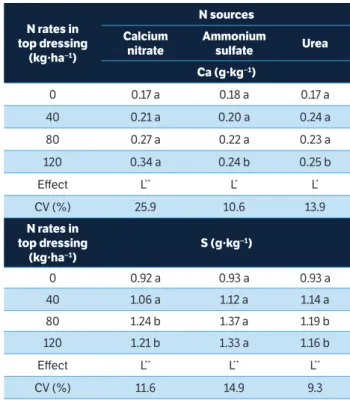
The concentrations of N, P, K, Ca, Mg, and S in leaves (Table 1) as well as the concentrations of N, P, K, and Mg in wheat grain (Table 2) were not significantly influenced (p > 0.05) by the interaction effect of rates and sources of N in top dressing. The concentrations of Ca and S in wheat grain were significantly influenced (p < 0.05) by the interaction of rates and sources of N (Table 3).
Increasing N rates in top dressing in the wheat crop linearly increased the N, P, Ca, and S concentrations and did not affect the K and Mg concentrations, both in leaves (Table 1) and grain (Tables 2,3). The Ca-leaf concentration was higher with the use of CN and the S-leaf concentration was higher with the use of AS (Table 1). The Ca-grain concentration was also higher with the application of CN at the highest N rate
Treatments N P K Ca Mg S N rates in top dressing
(kg∙ha−1) g∙kg−1
0 42.5 2.4 25.3 3.3 1.8 2.7 40 43.0 2.7 26.2 4.0 2.0 3.0 80 44.2 2.9 25.5 4.9 2.1 3.2 120 46.4 2.8 25.6 4.8 1.9 3.4
Effect L** L** ns L** ns L*
CV (%) 3.4 6.9 1.3 15.3 5.7 8.4
N sources (kg∙ha−1)
N P K Ca Mg S g∙kg−1
Calcium nitrate 43.4 2.7 25.5 4.6 2.0 2.9 Ammonium sulfate 43.5 2.6 26.4 3.9 1.9 3.4 Urea 44.7 2.6 25.5 4.0 1.8 3.0
LSD 3.2 0.2 1.6 0.5 0.2 0.3
CV (%) 1.3 1.8 1.6 7.4 4.3 7.0 Table 1. Concentrations of N, P, K, Ca, Mg, and S in wheat leaves as affected by nitrogen rates and sources applied in top dressing in a no-till system.
**p < 0.01; *p < 0.05. ns = Non-significant; L = Linear effect by regression analysis; CV = Coefficient of variation; LSD = Least significant difference by Tukey’s test (p = 0.05).
N rates in top dressing
(kg∙ha−1)
N sources Calcium
nitrate
Ammonium
sulfate Urea Ca (g∙kg−1)
0 0.17 a 0.18 a 0.17 a
40 0.21 a 0.20 a 0.24 a
80 0.27 a 0.22 a 0.23 a
120 0.34 a 0.24 b 0.25 b
Effect L** L* L*
CV (%) 25.9 10.6 13.9
N rates in top dressing
(kg∙ha−1)
S (g∙kg−1)
0 0.92 a 0.93 a 0.93 a
40 1.06 a 1.12 a 1.14 a
80 1.24 b 1.37 a 1.19 b
120 1.21 b 1.33 a 1.16 b
Effect L** L** L**
CV (%) 11.6 14.9 9.3
Table 3. Concentrations of Ca and S in wheat grain as affected by nitrogen rates and sources applied in top dressing in a no-till system.
Means followed by the same letter in the line do not differ by Tukey’s test (p = 0.05); **p < 0.01; *p < 0.05. L = Linear effect of nitrogen rates applied in top dressing by regression analysis; CV = Coefficient of variation.
Treatments N P K Mg N rates in top dressing
(kg∙ha−1) g∙kg−1
0 22.4 2.6 5.3 1.0
40 23.3 2.8 5.3 1.1
80 25.1 2.9 5.0 1.1
120 25.3 3.0 5.1 1.1
Effect L** L** ns ns
CV (%) 5.9 6.0 2.5 4.2
N sources (kg∙ha−1)
N P K Mg
g∙kg−1
Calcium nitrate 23.7 2.9 5.2 1.1 Ammonium sulfate 24.1 2.8 5.2 1.1
Urea 24.3 2.8 5.2 1.1
LSD 2.0 0.4 0.3 0.1
CV (%) 1.3 3.4 0.4 2.7
Table 2. Concentrations of N, P, K, and Mg in wheat grain as affected by nitrogen rates and sources applied in top dressing in a no-till system.
**p < 0.01. ns = Non-significant; L = Linear effect by regression analysis; CV = Coefficient of variation; LSD = Least significant difference by Tukey’s test (p = 0.05).
120 kg∙ha−1) (Table 3). Since the CN had 136 g Ca∙kg−1 and the AS had 220 g S kg−1 in its composition, the eff ect of these sources on Ca and S nutrition certainly has occurred because of larger amount of Ca and S added to the soil. Th e N sources did not change the N, P, K, and Mg concentrations in leaves (Table 1) and wheat grain (Table 2).
Th e synergistic eff ect between N and P is well known, and this eff ect was observed in our study, since the increase in N rates in top dressing increased the N and P concentrations in leaves (Table 1) and wheat grain (Table 2), certainly due to higher P uptake by plants. Th e NO3− uptake occurs by active process, which requires metabolic energy for transportation from an electrochemical potential gradient, requiring greater amounts of ATP, formed from the P uptake (Bredemeier and Mundstock 2000). Th us, with the supply of N in top dressing in the wheat crop, the plant may have absorbed larger amount of P in order to maintain balance in metabolism (Ruff y 1990). Moreover, the increase in N provided by top dressing fertilization may have favored root growth of wheat plant (Xue et al. 2014). Th is could be facilitated by the P uptake, since the mobility of this nutrient in the soil is low (Santos et al. 2008).In our study, increasing the N rate in top dressing signifi cantly increased the N and S concentrations in leaves (Table 1) and wheat grain (Table 3), and this eff ect must have occurred because of the N × S interaction. Th e synergistic eff ect between N and S can directly infl uence the quality of products. Sulfur increases the methionine concentration in the cereal proteins, and N can change the proportion of albumins, globulins, glutenins,
and polaminas (Tea et al. 2005). Salvagiotti et al. (2009) found that S fertilization in the wheat crop improved the N use effi ciency by increasing N uptake by plants due to N × S interaction. Anyway, leaf concentrations of P and S in all treatments were in the suffi cient range for wheat crop (Bélanger et al. 2011; Steinfurth et al. 2012).
Wheat grain yield was signifi cantly infl uenced (p < 0.05) by the interaction of rates and sources of N (Figure 2a). For the 3 N sources, wheat grain yield increased with an increase in top-dressed N rates, exhibiting a quadratic response. Th e N sources only provided signifi cant diff erences in wheat grain yield when the higher N rates were applied (80 and 120 kg∙ha−1). Grain yield was signifi cantly higher with the use of CN and AS than with the use of UR when 80 kg∙N ha−1 were applied in top dressing. At 120 kg N∙ha−1, grain yield was higher with the application of CN compared with the use of AS and UR.
In our study, wheat was grown in succession to soybean. Leguminous crops provide considerable N residual in the soil due mainly to the smaller C/N relation of straw (about 20:1), and higher rates of decomposition and mineralization of N can be recycled and recovered by the crop in succession (Nunes et al. 2011b).This could explain the decrease in grain yield when the highest N rate was applied (Figure 2a). Although the greater N uptake provides greater protein concentration in the grain, the excess of N often negatively influences HM, impairing the criteria for marketing grain, since the protein content is not a parameter used in Brazil (Nunes et al. 2011a). In other studies, increased supply of N applied in top dressing also increased wheat grain yield according to the quadratic model, with estimated rates from 70 to 126 kg∙ha−1 to obtain grain yields ranging from 3,654 to 5,032 kg∙ha−1 (Teixeira Filho et al. 2010, 2011; Espindula et al. 2010; Nunes et al. 2011a).In a soil with high residue of N in succession to leguminous crops, Prando et al. (2012) obtained wheat grain yield of 4,347 kg∙ha−1, similarly to that achieved in our study.
Based on regression equations for grain yields (Figure 2a) and unit cost ratio of products (kg of N per kg of wheat grain of 14.7 for CN, 7.4 for AS and 5.2 for UR), MTY and MEY would be reached with rates of 96 and 0.7 kg N∙ha−1 as CN; 69 and 45 kg N∙ha−1 as AS; and 67 and 45 kg N∙ha−1 as UR, respectively. Wheat grain yields at rates of MTY and MEY would be 4,131 and 3,434 kg∙ha−1 with CN; 4,182 and 4,082 kg∙ha−1 with AS; and 4,015 and Figure 2. Grain yield (a) and lodging (b) of wheat considering the
nitrogen rates and sources in top dressing. **p < 0.01; *p < 0.05.
¯ = Calcium nitrate; £ = Ammonium sulfate; ▲ = Urea; LSD = Least signifi cant diff erence by Tukey’s test (p = 0.05).
!
3300 3600 3900 4200
0 40 80 120
Grain yield (kg ha
-1)
N rates in top dressing (kg.ha-1) = 3475 + 16.18x - 0.121x2 R = 0.84*
LSD338.2
= 3419 + 14.81x - 0.077x2 R = 0.99**
= 3436 + 21.65x - 0.157x2 R = 0.99**
= -1.53 + 0.091x R = 0.87** = -3.17 + 0.233x R = 0.91** = -2.67 + 0.350x R = 0.90*
0 15 30 45
0 40 80 120
Lodging (%)
N rates in top dressing (kg.ha-1)
LSD16.5
(a) (b)
4200 3900 3600 3300 0 40 L odging (%)
N rates in
top dressing (kg·ha–1)
N rates in
top dressing (kg·ha–1)
Gr
ain yield (k
g·ha
–1)
80 120 0
0 40 45 30 15 LSD₃₃₈.₂ LSD₁₆.₅ 80 120
ŷ = 3419 + 14.81x - 0.077x²; R² = 0.99** ŷ = 3436 + 21.65x - 0.157x²; R² = 0.99** ŷ = 3475 + 16.18x - 0.121x²; R² = 0.84*
ŷ = -1.53 + 0.091x; R² = 0.87** ŷ = -3.17 + 0.233x ; R² = 0.91** ŷ = -2.67 + 0.350x; R² = 0.90*
Nitrogen fertilization for wheat under no-till
3,958 kg∙ha−1 with UR, respectively. Although CN application have provided an increase in the order of 20% in grain yield, its use has been totally infeasible because of high cost of the fertilizer. Based on average price of wheat of $ 263.00 per ton of grain, the economic return with the use of AS and UR would be $ 85.00 and $ 65.00 per hectare, respectively, with the N application rate of MEY (45 kg∙ha−1). Therefore, these 2 sources showed economic viability for application at tillering of wheat following soybean in a no-till system. The MEY rate of N obtained for top-dressed application as AS and UR (45 kg N∙ha−1) is in agreement with the current N fertilizer recommendation for wheat crop in the Paraná State, in soil with previous soybean crop (30 – 60 kg N∙ha−1) (RCBPTT 2014).
The PFPN was not significantly influenced (p > 0.05) by the interaction effect of rates and sources of N on top dressing. There was no change in PFPN with the different N sources. Considering the average amount of N applied by the N sources on wheat crop, the PFPN varied from 86 to 87 kg∙kg−1. Due to the law of diminishing returns, wheat yield gains decreased with increasing N fertilizer rates. The PFPN decreased from 208 kg∙kg−1 with N application only at sowing (16.5 kg N∙ha−1) to 70; 42; and 28 kg∙kg−1 with the application of 16.5 kg N∙ha−1 at sowing more 40; 80 and 120 kg N∙ha−1 in top dressing, respectively. Since the average global value of the PFPN for the wheat crop is 44.5 kg∙kg−1 (Ladha et al. 2005), the PFPN value obtained in our study was higher than the world average value with N application at a rate of 56.5 kg N∙ha−1 (16.5 kg∙ha−1 at sowing and 40 kg∙ha−1 in top dressing) and remained very close to the world average value with N application at 96.5 kg∙ha−1 (16.5 kg∙ha−1 at sowing and 80 kg∙ha−1 in top dressing).
The plant lodging of wheat was significantly influenced (p < 0.05) by the interaction of rates and sources of N (Figure 2b). Increasing the N rates in top dressing increased linearly the percentage of lodged plants for the 3 N sources studied. However, with the application of the higher N rate (120 kg∙ha−1), the plant lodging was significantly lower with the use of CN compared to UR. When the AS was applied, the percentage of lodged plants was not significantly different from treatments with CN and UR. The plant lodging was 11; 28 and 45% with the use of CN, AS, and UR, respectively, at 120 kg N∙ha−1. Since the leaf Ca concentration was higher with the use of CN (Table 1), these results should be related to the increase in Ca uptake by wheat crop resulting from
the application of CN to the soil. With the application of 120 kg N∙ha−1 in the form of CN, there was an addition of 102 kg Ca∙ha−1. Calcium in the form of pectate is the main constituent of the middle lamella and provides resistance to cell wall,participating in the biosynthesis of lignin (Hepler 2005). The increase in lignin in wheat stems promotes greater resistance to lodging, suggesting that lignin increases the physical strength of the internodes (Peng et al. 2014). Similar response related to the use of AS and UR on plant lodging of wheat was also observed by Teixeira Filho et al. (2010) and Prando et al. (2013).
In several studies, it is reported evidence of the influence of plant lodging on wheat grain yield (Espindula et al. 2010; Melero et al. 2013; Prando et al. 2012; Teixeira Filho et al. 2010, 2011; Zagonel and Fernandes 2007).However, in our study, there was no significant correlation between the wheat grain yield and plant lodging (r = 0.18ns).Lodged plants can harm the grain filling due to the greater difficulty of the vascular tissue in the translocation of assimilates and nutrients to the grains (Berry et al. 2004). Berry e Spink (2012) evaluated the lodging effect on wheat grain yield due to the induction of different degrees of inclination. The authors concluded that plants with 45° inclination caused up to 18% of losses on grain yield, while, with 80° slope, losses on grain yield reached up to 54%.In addition, the decrease in wheat grain yield due to the plant lodging has been usually more pronounced in the mechanized harvest, in which the fallen plants would not be harvested (Peng et al. 2014).In our study, the absence of a significant correlation between wheat grain yield and plant lodging could occur becausethe harvest was manual, i.e. all the plants were harvested and threshed, including those which were lodged.
2013; Nunes et al. 2011a). In addition, adequate rainfall in the grain filling stage (Figure 1) may have accentuated this effect (Berry and Spink 2012). However, compared to the use of AS and UR, the application of CN provided plants with greater height (Figure 3b) and, at the same time, lower percentage of plants lodged (Figure 2b) at the highest N rate (120 kg∙ha−1), probably due to the presence of Ca in its composition. Calcium is directly associated with meristematic growth of plant cells responsible for the extension of the stem, in addition to stimulation of the mitotic division of these cells (Hepler 2005).
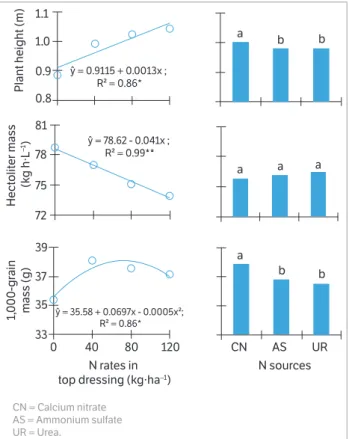
The HM (Figure 3b) and the 1,000-grain mass (Figure 3c) of wheat were not significantly influenced (p > 0.05) by the interaction effect of rates and sources of N in top dressing. The HM decreased linearly with the increase in N rates, at a rate of 0.041 kg∙hL−1 per kg of N applied in top dressing (Figure 3b). The N sources did not cause significant changes in wheat HM. In several studies involving the application of N rates in the wheat crop, there was also a linear reduction in HM by using N rates of up to 120 kg∙ha−1 (Cazetta et al. 2008; Prando et al. 2013) or 200 kg∙ha−1 (Trindade et al.
2006; Teixeira Filho et al. 2010). In these studies, the lowest HM with increasing N rate was attributed to the increase in the number of ears or grains per area, which may cause an increase in the competition by assimilates, compromising grain quality. However, in our study, there was no such effect because the 1,000-grain mass of wheat was raised with the application of N rates, exhibiting a quadratic response (Figure 3c). Based on the regression equation obtained, the maximum 1,000-grain mass (38 g) would be reached with the rate of 70 kg N∙ha−1 in top dressing. Thus, a reduction in HM because of increased number of ears or grains per area would be expected only in higher N rates.Relating the 2 parameters, the HM and the 1,000-grain mass, it appears that there is no relationship between them, i.e. the higher HMdoes not always correspond to the greater 1,000-grain mass, a fact confirmed in the study carried out by Smanhotto et al. (2006). According to these authors, each cultivar has distinct grain size and, consequently, different mass. The HM is divided by the mass of a known volume; regardless of the grain size, the volume is constant, while the 1,000-grain mass does not involve volume, but only mass. In our study, it is more likely that the reduction in HM with increasing N rates occurred due to the higher plant lodging. Lodged plants generate ears in a more humid environment, leading to an increase in germination or rot grain and decrease in HM (Zagonel and Fernandes 2007). Regarding N sources, the use of CN provided greater 1,000-grain mass than the application of AS and UR (Figure 3c), possibly due to the effects of CN on lower percentage of lodged plants (Figure 2b), which may have facilitated the grain filling (Berry et al. 2004).
CONCLUSION
Calcium nitrate is an efficient source for supplying N to wheat grown in succession to soybean, but its use is unfeasible by the high cost of the fertilizer. Ammonium sulfate and urea are economically viable N sources for application in top dressing in wheat following soybean.
The maximum technical yield to the wheat crop following soybean in a no-till system is achieved with the application of 96 kg N∙ha−1 as CN, 69 kg N∙ha−1 as AS, and 67 kg N∙ha−1 as UR. A rate of 45 kg N∙ha−1 as AS or UR in top dressing to no-till wheat following soybean provides the maximum economic yield to obtain grain yield of 4.0 t∙ha−1.
1.1
a
a a a
a
b b
b b
1.0
0.9
0.8
81
78
75
72
39
37
35
33
0 40 80 120 CN AS UR
N rates in top dressing (kg·ha–1)
N sources
Hect
olit
er ma
ss
(k
g h∙L
–1)
1,
000-gr
ain
ma
ss (g)
Plant height (m)
ŷ = 35.58 + 0.0697x - 0.0005x²; R² = 0.86* ŷ = 0.9115 + 0.0013x ;
R² = 0.86*
ŷ = 78.62 - 0.041x ; R² = 0.99**
Figure 3. Plant height (a), hectoliter mass (b), and 1,000-grain mass (c) of wheat considering the nitrogen rates and sources in top dressing.
**p < 0.01; *p < 0.05. Means followed by the same letter do not differ
by Tukey’s test (p = 0.05).
Nitrogen fertilization for wheat under no-till
Alvarez, V. V. H. (1994). Avaliação da fertilidade do solo
(superfície de resposta – modelos aproximativos para expressar
a relação fator-resposta). 3. ed. Viçosa: UFV.
Bélanger, G., Claessens, A. and Ziadi, N. (2011). Relationship
between P and N concentrations in maize and wheat leaves.
Field Crops Research, 123, 28-37. http://dx.doi.org/10.1016/j.
fcr.2011.04.007.
Berry, P. M. and Spink, J. H. (2012). Predicting yield losses
caused by lodging in wheat. Field Crops Research, 137, 19-26.
http://dx.doi.org/10.1016/j.fcr.2012.07.019.
Berry, P. M., Sterling, M., Spink, J. H., Baker, C. J.,
Sylvester-Bradley, R., Mooney, S. J., Tams, A. R. and Ennos, A. R.
(2004). Understanding and reducing lodging in cereals.
Advances in Agronomy, 14, 217-271. http://dx.doi.org/10.1016/
S0065-2113(04)84005-7.
Bredemeier, C. and Mundstock, C. M. (2000). Regulação
da absorção e assimilação do nitrogênio nas plantas.
Ciência Rural, 30, 365-372. http://dx.doi.org/10.1590/
S0103-84782000000200029.
Cazetta, D. A., Fornasieri Filho, D., Arf, O. and Germani, R.
(2008). Qualidade industrial de cultivares de trigo e triticale
submetidos à adubação nitrogenada no sistema de plantio
direto. Bragantia, 67, 741-750. http://dx.doi.org/10.1590/
S0006-87052008000300024.
Comissão de Química e Fertilidade do Solo and Sociedade
Brasileira de Ciência do Solo (2004). Manual de Adubação e
de Calagem para os Estados do Rio Grande do Sul e Santa
Catarina. 10. ed. Porto Alegre: CQFS, SBCS.
C o m p a n h i a N a c i o n a l d e A b a s t e c i m e n t o ( 2 0 1 6 ) .
Acompanhamento da safra brasileira de grãos 2015/16 – sexto
levantamento, março de 2016. Brasília: CONAB.
Empresa Brasileira de Pesquisa Agropecuária (2013). Sistema
brasileiro de classificação de solos. 3. ed. Rio de Janeiro:
Embrapa.
Espindula, M. C., Rocha, V. S., Souza, M. A., Campanharo,
M. and Pimentel, A. J. B. (2014). Urease inhibitor (NBPT)
and efficiency of single or Split application of urea in wheat
crop. Revista Ceres, 61, 273-279. http://dx.doi.org/10.1590/
S0034-737X201400020001.
REFERENCES
Espindula, M. C., Rocha, V. S., Souza, M. A., Grossi, J. A. S. and
Souza, L. T. (2010). Doses e formas de aplicação de nitrogênio
no desenvolvimento e produção da cultura do trigo. Ciência
e Agrotecnologia, 34, 1404-1411. http://dx.doi.org/10.1590/
S1413-70542010000600007.
Franco, H. C. J., Bologna, I. R., Faroni, C. E., Vitti, A. C. and
Trivelin, P. C. O. (2007). Acúmulo de macronutrientes em
cana-de-açúcar em função da adubação nitrogenada e dos resíduos
culturais incorporados ao solo no plantio. Bragantia, 66,
669-674. http://dx.doi.org/10.1590/S0006-87052007000400017.
Hepler, P. K. (2005). Calcium: a central regulator of plant growth
and development. The Plant Cell, 17, 2142-2155. http://dx.doi.
org/10.1105/tpc.105.032508.
Ladha, J. K., Pathak, H., Krupnik, Z. J., Six, J. and Kessel, C. V.
(2005). Efficiency of fertilizer nitrogen in cereal production:
retrospect and prospects. Advances in Agronomy, 87, 1-71.
http://dx.doi.org/10.1016/S0065-2113(05)87003-8.
Malavolta, E., Vitti, G. C. and Oliveira, S. A. (1997). Avaliação
do estado nutricional das plantas: princípios e aplicações. 2.
ed. Piracicaba: Potafos.
Melero, M. M., Gitti, D. C., Arf, O. and Rodrigues, R. A. F. (2013).
Coberturas vegetais e doses de nitrogênio em trigo sob sistema
plantio direto. Pesquisa Agropecuária Tropical, 43, 343-353.
http://dx.doi.org/10.1590/S1983-40632013000400001.
Mori, C. and Ignaczak, J. C. (2011). Aspectos econômicos do
complexo agroindustrial do trigo. In J. L. F. Pires, L. Vargas
and G. R. Cunha (Eds.), Trigo no Brasil: bases para produção
competitiva e sustentável (p. 41-76). Passo Fundo: Embrapa Trigo.
Nunes, A. S., Souza, L. C. F. and Mercante, F. M. (2011a).
Adubos verdes e adubação mineral nitrogenada em cobertura
na cultura do trigo em plantio direto. Bragantia, 70, 432-438.
http://dx.doi.org/10.1590/S0006-87052011000200026.
Nunes, R. S., Lopes, A. A. C., Sousa, D. M. G. and Mendes, I.
C. (2011b). Sistemas de manejo e os estoques de carbono e
nitrogênio em Latossolo de Cerrado com a sucessão
soja-milho. Revista Brasileira de Ciência do Solo, 35, 1407-1419.
http://dx.doi.org/10.1590/S0100-06832011000400035.
Peel, M. C., Finlayson, B. L. and McMahon, T. A. (2007). Update
Hydrology and Earth System Sciences, 11, 1633-1644. http:// dx.doi.org/10.1127/0941-2948/2006/0130.
Peng, D., Chen, X., Yin, Y., Lu, K., Yang, W., Tang, Y. and Wang, Z.
(2014). Lodging resistance of winter wheat (Triticum aestivum
L.): lignin accumulation and its related enzymes activities due to
the application of paclobutrazol or gibberellin acid. Field Crops
Research, 157, 1-7. http://dx.doi.org/10.1016/j.fcr.2013.11.015.
Pietro-Souza, W., Bonfim-Silva, E. M., Schlinchting, A. F. and
Silva, M. C. (2013). Desenvolvimento inicial de trigo sob doses
de nitrogênio em Latossolo Vermelho de Cerrado. Revista
Brasileira de Engenharia Agrícola e Ambiental, 17, 575-580.
http://dx.doi.org/10.1590/S1415-43662013000600001.
Prando, A. M, Zucareli, C., Fronza, V., Bassoi, M. C. and
Oliveira, F. A. (2012). Formas de uréia e doses de nitrogênio
em cobertura no desempenho agronômico de genótipos de
trigo. Semina: Ciências Agrárias, 33, 621-632. http://dx.doi.
org/10.5433/1679-0359.2012v33n2p621.
Prando, A. M., Zucareli, C., Fronza, V., Oliveira, F. A. and
Oliveira Júnior, A. (2013). Características produtivas do
trigo em função de fontes e doses de nitrogênio. Pesquisa
Agropecuária Tropical, 43, 34-41. http://dx.doi.org/10.1590/
S1983-40632013000100009.
Reunião da Comissão Brasileira de Pesquisa de Trigo e Triticale
(2014). Informações técnicas para trigo e triticale – safra 2015.
Brasília: Embrapa.
Rossi, E. S., Mendes, M. C., Junior, O. P., Rizzardi, D. A. and Silva,
C. A. (2013). Agronomics characteristics of wheat cultivars
in response to UR treaded with URse inhibitor in coverage.
Brazilian Journal of Applied Technology for Agricultural Science,
6, 39-46. http://dx.doi.org/10.5935/PAeT.V6.
Ruffy, J. T. W. (1990). Phosphorus stress effects on assimilation
of nitrate. Plant Physiology, 94, 328-333. http://dx.doi.org/ 10.
1104/ pp. 94. 1.
Salvagiotti, F., Castellarín, J. M., Miralles, D. J. and Pedrol, H.
M. (2009). Sulfur fertilization improves nitrogen use efficiency
in wheat by increasing nitrogen uptake. Field Crops Research,
113, 170-177. http://dx.doi.org/10.1016/j.fcr.2009.05.003.
Santos, D. R., Gatiboni, L. C. and Kaminski, J. (2008). Fatores que
afetam a disponibilidade do fósforo e o manejo da adubação
fosfatada em solos sob sistema plantio direto. Ciência Rural, 38,
576-586. http://dx.doi.org/10.1590/S0103-84782008000200049.
Schwenke, G. D., Manning, W. and Haigh, M. (2014). Ammonia
volatilisation from nitrogen fertilisers surface-applied to bare fallows,
wheat crops and perennial-grass-based pastures on Vertosols.
Soil Research, 52, 805-821. http://dx.doi.org/10.1071/SR14107.
Smanhotto, A., Nóbrega, L. H. P., Opazo, M. A. U. and Prior,
M. (2006). Características físicas e fisiológicas na qualidade
industrial de cultivares e linhagens de trigo e triticale. Revista
Brasileira de Engenharia Agrícola e Ambiental, 10, 867-872.
http://dx.doi.org/10.1590/S1415-43662006000400013.
Soares, J. R., Cantarella, H. and Menegale, M. L. C. (2012).
Ammonia volatilization losses from surface-applied urea with
urease and nitrification inhibitors. Soil Biology and Biochemistry,
52, 82-89. http://dx.doi.org/10.1016/j.soilbio.2012.04.019.
Steinfurth, D., Zörb, C., Braukmann, F. and Mühling, L. H.
(2012). Time-dependent distribution of sulphur, sulphate and
glutathione in wheat tissues and grain as affected by three
sulphur fertilization levels and late S fertilization. Journal
of Plant Physiology, 169, 72-77. http://dx.doi.org/10.1016/j.
jplph.2011.08.012.
Tasca, F. A., Ernani, P. R., Rogeri, D. A., Gatiboni, L. C. and
Cassol, P. C. (2011). Volatilização de amônia do solo após a
aplicação de ureia convencional ou com inibidor de urease.
Revista Brasileira de Ciência do Solo, 35, 493-502. http://dx.doi.
org/10.1590/S0100-06832011000200018.
Tea, I., Genter, T., Violleau, F. and Kleiber, D. (2005). Changes
in the glutathione thiol-disulfide status in wheat grain by
foliar sulphur fertilization: consequences for the rheological
properties of dough. Journal of Cereal Science, 41, 305-315.
http://dx.doi.org/10.1016/j.jcs.2004.10.003.
Teixeira Filho, M. C. M., Buzetti, S., Andreotti, M., Arf, O. and
Benet, C. G. S. (2010). Doses, fontes e épocas de aplicação
de nitrogênio em trigo irrigado em plantio direto. Pesquisa
Agropecuária Brasileira, 45, 797-804. http://dx.doi.org/10.1590/
S0100-204X2010000800004.
Teixeira Filho, M. C. M., Buzetti, S., Andreotti, M., Arf, O.
and Sá, M. E. (2011). Application times, sources and doses
of nitrogen on wheat cultivars under no till in the Cerrado
region. Ciência Rural, 41, 1375-1382. http://dx.doi.org/10.1590/
S0103-84782011000800013.
Trindade, M. G., Stone, L. F., Heinemann, A. B., Cánovas, A. D.
and Moreira, J. A. A. (2006). Nitrogênio e água como fatores
Nitrogen fertilization for wheat under no-till
Engenharia Agrícola e Ambiental, 10, 24‑29. http://dx.doi.
org/10.1590/S1415-43662006000100004.
United States Department of Agriculture (2016). World
agricultural supply and demand estimates. Washington: USDA.
Van Raij, B. (2011). Fertilidade do solo e manejo de nutrientes.
Piracicaba: IPNI.
Xue, Y. F., Zhang, W., Liu, D. Y., Yue, S. C., Cui, Z. L., Chen, X.
P. and Zou, C. Q. (2014). Effects of nitrogen management on
root morphology and zinc translocation from root to shoot of
winter wheat in the field. Field Crops Research, 161, 38-45.
http://dx.doi.org/10.1016/j.fcr.2014.01.009.
Yano, G. T., Takahashi, H. W. and Watanabe, T. S. (2005).
Avaliação de fontes de nitrogênio e épocas de aplicação em
cobertura para o cultivo do trigo. Semina: Ciências Agrárias, 26,
141-148. http://dx.doi.org/10.5433/1679-0359.2005v26n2p141.
Zagonel, J. and Fernandes, E. C. (2007). Doses e épocas de
aplicação de redutor de crescimento Afetando cultivares de
trigo em duas doses de nitrogênio. Planta Daninha, 25,