ABSTRACT:The purpose of this study was to evaluate Cu and Zn migration and fractions in sandy soil of vineyards. In Urussanga (SC), Brazil, soil samples were collected from a 4-year-old and 15-year-old vineyard, and from a forested area. In the soils, the chemical characteristics of Cu and Zn were analyzed by the EDTA method, which determines the fraction available in soil; 3050B method of the USEPA for total concentrations, which represents the pseudo-soil contents in the pseudo-soil; and chemical fractionation, which estimates soluble fraction, exchangeable fraction, fraction associated with clay minerals, fraction associated with organic matter and residual fraction. The results show that there is accumulation of Cu and Zn in sandy soils cultivated with grapevines and with frequent fungicide applications.
SOIL AND PLANT NUTRITION -
Article
Copper and zinc accumulation, fractionation
and migration in vineyard soils from Santa
Catarina State, Brazil
Gustavo Brunetto1*, Jucinei Jose Comin2, Alcione Miotto2, Marcel Pires de Moraes2, Paula Beatriz
Sete5, Djalma Eugênio Schmitt3, Luciano Colpo Gatiboni3, George Wellington Bastos de Melo4,
Gildean Portela Morais5
1.Universidade Federal de Santa Maria -Centro de Ciências Rurais - Departamento de Solos - Santa Maria (RS), Brazil. 2.Universidade Federal de Santa Catarina - Engenharia Rural - Florianópolis (SC), Brazil.
3.Universidade do Estado de Santa Catarina - Solos e Recursos Naturais - Lages (SC), Brazil. 4.Empresa Brasileira de Pesquisa Agropecuária - Uva e Vinho - Bento Gonçalves (RS), Brazil.
5.Universidade Federal de Santa Catarina - Programa de Pós-Graduação em Agroecossistemas - Florianópolis (SC), Brazil.
*Corresponding author: brunetto.gustavo@gmail.com
Received: Sept. 15, 2016 – Accepted: Feb. 6, 2017
These higher levels were found in soils with longer cultivation time (15 years old), but were restricted to the superficial layers of the soil. Most of the Cu was extracted by EDTA method, and it may be considered as available to plants. The EDTA also extracted a small part of Zn. Most of the Cu in the vineyard soils can be characterized by low geochemical mobility, but in the uppermost soil layers of the oldest vineyard, there was an increase in Cu content associated with soil organic matter. Most of the Zn in the vineyard soil was associated with minerals, which indicates low mobility and also low potential for toxicity to plants and microorganisms.
INTRODUCTION
In the southern region of Santa Catarina (SC), Brazil, vineyards are planted on soils located on lands near sea level with sandy texture, predominance of 1:1 clay, low organic matter content, acidic soil and low natural fertility (Schmitt et al. 2013). The grapevines are subjected to the application of Cu- and Zn-bearing fungicides for control of fungal leaf diseases (Mackie et al. 2012; Tiecher et al. 2016). Because of washing of trace-elements by rainwater or deposition of senescent leaves or pruned branches containing Cu and Zn derived from the applications, the concentration of the two elements in the soil may increase through the years. Therefore, there may be an increase in Cu concentration in vineyard soils of traditional winegrowing regions of the world (Fernández-Calviño et al. 2008; Toselli et al. 2009; Fernández-Calviño et al. 2010), including those in Brazil, as reported in some exploratory studies on copper (Casali et al. 2008; Nogueirol et al. 2010; Brunetto et al. 2016) and zinc (Fernández-Calviño et al. 2012).
Copper and Zn in the soil are retained by physical-chemical bonds and their lability depends on the ligand, especially on the content of minerals, oxides and hydroxides of iron (Fe), aluminum (Al) and manganese (Mn), carbonates and organic matter (Bradl 2004; Couto et al. 2015), but also on the soil pH value (Chaignon et al.2003; Shaheen et al. 2015), cation exchange capacity (CEC) and the composition of the organic matter (Fernández-Calviño et al. 2010). Normally, adsorption of Cu and Zn in the soil first occurs in the most avid binding sites and then the remaining trace elements are redistributed in fractions that are retained with less energy and, consequently, with greater availability and mobility (Miotto et al. 2013). However, frequent applications of fungicides can increase the Cu and Zn content in the soil, modifying distribution of the fractions, increasing toxicity to plants (Nagajyoti et al. 2010) and transfer by the runoff solution on the soil surface and percolated in the soil profile, increasing water contamination (Fernández-Calviño et al. 2012).
Methods for chemical analysis are used to estimate the Cu and Zn content in the soil. The total content of the two trace elements, like that estimated by the 3050B method of the USEPA (USEPA 1996), has been a useful indicator, but it may, for example, present low correlation with bioavailability of the element to plants (Miotto et al. 2013). For that reason, extractions with chemical products in an
isolated manner have been used, such as chelating agents, like Ethylenediamine tetra acetic acid (EDTA) (Schramel et al. 2000). However, for some soils, EDTA may present limited capacity for predicting the contents of the trace elements that may be available to plants or potentially transferred to the environment (Chaignon and Hinsinger 2003). Thus, the results of Cu and Zn in the soil obtained in by an isolated method of analysis may be improved by joining them with chemical fractionation. Through the sequential use of chemical extractors, it removes the Cu and the Zn of the most labile fractions up to the most stable (Tessier et al. 1979).
Thus, it is possible to separate the total quantity of the trace element in the soils or sediments into bioavailable fractions (soluble in water or exchangeable), potentially bioavailable (associated with clay minerals, oxides, carbonates and organic matter) and residual (mineral structure) (Tessier et al. 1979). With the use of this technique, an increase of Cu has been verified in vineyard soils, especially in the mineral and organic fraction (Casali et al. 2008; Nogueirol et al. 2010) and of Zn in the residual or mineral fraction (Fernández-Calviño et al. 2012). But studies in traditional winegrowing regions of the world reporting Cu and Zn distribution in different soil fractions are scarce, and in Brazil are non-existent. This study aims to evaluate Cu and Zn migration and fractions in sandy soils of vineyards with a history of fungicide application.
MATERIALS AND METHODS
The vineyard and forest soils used in the present study were collected in the municipality of Urussanga (lat 28°31’22’S’, long 49°19’3’W’),in the southern region of SC, Brazil. The soil of the vineyards and the forest was sandy Typic Hapludalf (Soil Survey Staff 2006) (Table 1).The soil had a sandy surface horizon, which was derived from a granite substrate, exhibited predominance of 1:1 clay and was located on flat land (Santos et al. 2015). Climate in the region is humid subtropical (Cfa), with annual mean temperature of 19.4 °C and mean annual rainfall of 1,619mm (Embrapa 2003).
The vineyards were of different ages and, consequently, had different histories of application of Cu-bearing fungicides, such as Bordeaux mixture (Ca (OH)2 + CuSO4)
fungicides, such as Mancozeb. Vineyard 1 was established in 2006 at a density of 2.525 plants per hectare and vineyard 2 was established in 1995 at a density of 1.429 plants per hectare. Vineyard 1 (lat 28°34’34,2’S’, long 49°16’07’’W and altitude of 29m) and vineyard 2 (lat 28°33’49,5’’S, long 49°15’50,2’’W and altitude of 24m) were formed of
the Niágara Rosada cultivar, grafted onto the rootstock
Paulsen 1103. The plants of the two vineyards were trained in the pergola trellis training system and each one of the vineyards occupied an area of approximately one hectare. Before setting up the vineyards, limestone was applied on the soil surface, with later incorporation, to raise the pH in water to 6.0. At planting, 17.5kg P·ha-1 and 63.3kg K·ha-1
were applied on each one of the vineyards for fertilization. Throughout the annual grapevine cycle on the soil surface of each vineyard, approximately 50kg N·ha-1, 20kg K·ha-1
and 22kg P·ha-1were applied. The forest soil, located near
the vineyards, had never been cultivated and did not have a history of fertilizer application.
Soil collection was made in December 2010, 4 and 15 years after establishment of vineyard 1 and vineyard 2, respectively. Sampling was performed in a representative area of the vineyards through the opening of six trenches with dimensions of 0.3 × 0.5 × 0.5m at random points near the plant row. The soil samples from the forest area,
used as a reference, were collected at random in trenches with the same dimensions as those of the vineyards. In the vineyards and in the forest, soil was collected at the 0.00-0.05, 0.05-0.10, 0.10-0.15, 0.15-0.20, 0.20-0.25, 0.25-0.30, 0.30-0.40, 0.40-0.50 and 0.10-0.20m layers. The soil samples were dried in open air, passed through a sieve with a 2mm mesh and reserved for analyses. The physical and chemical attributes were determined in the 0.0-0.05, 0.05-0.10 and 0.10-0.20m layers. Analysis of granulometric distribution of the soil constituents was performed by the pipette method and of organic matter (OM) by the Walkley-Black method (Embrapa 1997). Analysis of pH in water, the available phosphorus content (Pa), exchangeable contents of K
+ (K e), Ca
2+ (Ca e),
Mg2+ (Mg
e) and Al 3+ (Al
e) were determined according to
Tedesco et al. (1995). The crystalline iron (Fed) contents
were extracted by sodium citrate-bicarbonate-dithionite, and amorphous Fe (Feo) by ammonium oxalate (Tedesco
et al. 1995).
Total Cu contents (CuEPA) and Zn contents (ZnEPA) were
determined in all the soil samples by the 3050B method of the USEPA (USEPA, 1996). Available Cu contents (CuEDTA)
and Zn contents (ZnEDTA) were analyzed with the use of
the EDTA extractor (Chaignon et al., 2003). Chemical fractionation of Cu and Zn was carried out in the soil of
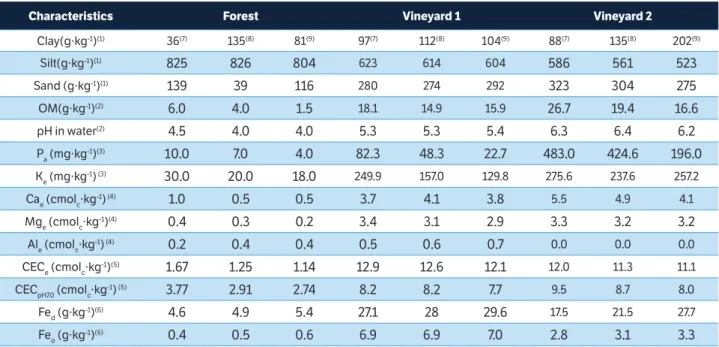
Characteristics Forest Vineyard 1 Vineyard 2
Clay(g·kg-1)(1) 36(7) 135(8) 81(9) 97(7) 112(8) 104(9) 88(7) 135(8) 202(9)
Silt(g·kg-1)(1) 825 826 804 623 614 604 586 561 523
Sand (g·kg-1)(1) 139 39 116 280 274 292 323 304 275
OM(g·kg-1)(2) 6.0 4.0 1.5 18.1 14.9 15.9 26.7 19.4 16.6
pH in water(2) 4.5 4.0 4.0 5.3 5.3 5.4 6.3 6.4 6.2
Pa (mg·kg-1)(3) 10.0 7.0 4.0 82.3 48.3 22.7 483.0 424.6 196.0
Ke (mg·kg-1) (3) 30.0 20.0 18.0 249.9 157.0 129.8 275.6 237.6 257.2
Cae (cmolc·kg-1) (4) 1.0 0.5 0.5 3.7 4.1 3.8 5.5 4.9 4.1
Mge (cmolc·kg
-1)(4) 0.4 0.3 0.2 3.4 3.1 2.9 3.3 3.2 3.2
Ale (cmolc·kg-1) (4) 0.2 0.4 0.4 0.5 0.6 0.7 0.0 0.0 0.0
CECe (cmolc·kg-1)(5) 1.67 1.25 1.14 12.9 12.6 12.1 12.0 11.3 11.1
CECpH7.0 (cmolc·kg-1) (5) 3.77 2.91 2.74 8.2 8.2 7.7 9.5 8.7 8.0
Fed (g·kg-1)(6) 4.6 4.9 5.4 27.1 28 29.6 17.5 21.5 27.7
Feo (g·kg
-1)(6) 0.4 0.5 0.6 6.9 6.9 7.0 2.8 3.1 3.3
Table 1.Main physical and chemical characteristics of the forest, vineyard 1 (4 years) and vineyard 2 (15 years) soils, at 0.0-0.05, 0.05-0.10 and 0.1-0.20m depth.
(1)Pipette method (Embrapa 1997); (2)Determined according to Tedesco et al. (1995);(3)Extracted Mehlich 1 extractor (Tedesco et al. 1995); (4)Extracted by KCl 1 mol·L-1 extractor (Tedesco et al. 1995); (5)Determined according to CQFS-RS/SC,2016; (6)Extracted by (NH
4)2C2O4H2O 0,2 mol·L
the 0.0-0.05, 0.05-0.10 and 0.10-0.20m layers (Tessier et al. 1979). There was thus determination of the following:
i. Soluble fraction (CuSol and ZnSol);
ii. Exchangeable fraction (CuE and ZnE);
iii. Fraction associated with clay minerals (CuMin
and ZnMin);
iv. Fraction associated with organic matter (CuOM
and ZnOM); and
v. Residual fraction (CuR and ZnR).
Total Cu and Zn (CuT and ZnT) were analyzed in
unfractionated soil (Miotto et al. 2013). Determination of CuSol and ZnSol contents was carried out by Inductively
Coupled Plasma Atomic Emission Spectrometry (ICP-AES) (Perkin Elmer, Optima 2100 DV) and the content of the other fractions was by Atomic Absorption Spectrometry (AAS). The Cu and Zn contents were subjected to analysis of variance and when the effects were significant, the mean values were compared by the Tukey test (p < 0.05). The data on CuEPA and CuEDTA and ZnEPA and ZnEDTA were subjected
to correlation analysis.
RESULTS AND DISCUSSION
Accumulation and migration of Cu and Zn in the soil profile
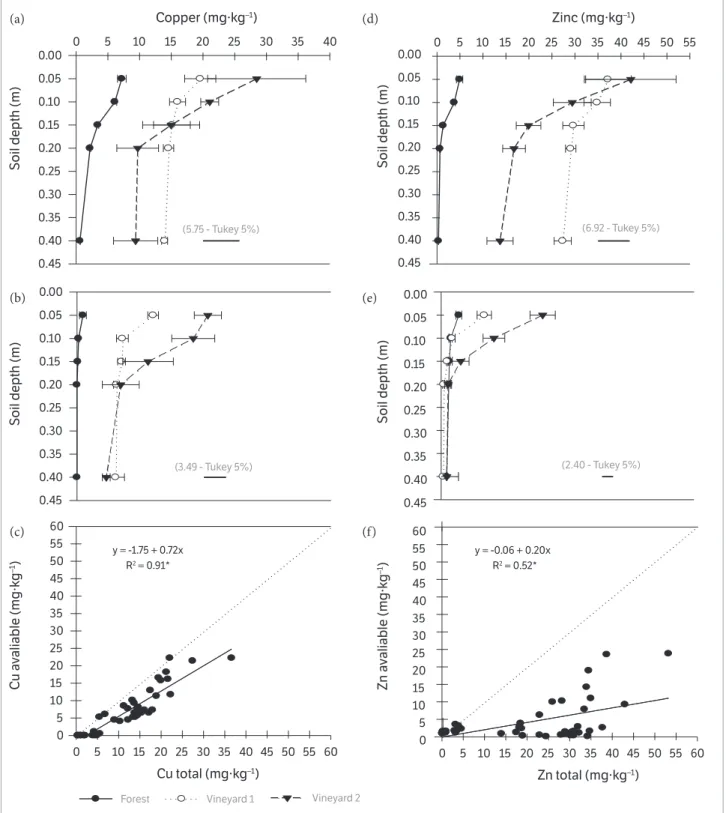
Total Cu contents (CuEPA) were higher at the 0.0-0.05m
layer (Figure 1a) in the 15-year-old vineyard soil, while in the 4-year-old vineyard, CuEPA contents were the same at
all the soil depths sampled in this study. The lowest levels of CuEPA were found in the forest soil.
The highest CuEDTA contents were observed up to the
depth of 0.15m in the vineyard 2 soil (Figure 1b). The CuEDTA
levels in the soil of vineyards 1 and 2 were significantly higher than the forest soil. On the other hand, the ZnEPA
contents at all depths in the vineyard 1 and 2 soils were higher than the content observed in the forest soil (Figure 1d). The highest ZnEPA contents in the vineyard soils were
observed in the 0.10 m to 0.40 m layers of the vineyard 1 soil. At the depth of 0.20 and 0.40m, higher ZnEPA contents
were observed in comparison to the vineyard 2 soil. The highest ZnEDTA contents were observed up to the depth of
0.10m in the vineyard 2 soil (Figure 1e). Thehigher contents of CuEPA and ZnEPA, and CuEDTA and ZnEDTA, frequently used
to assess the mobility of Cu and Zn in the soil profile and, in the case of EDTA, the availability of the element to the
plants, may be explained by the frequent leaf applications of fungicides over the years for control of fungal leaf diseases (Mackie et al., 2012; Santiago-Martin et al. 2015). In vineyard 1 (4-year-old), ZnEPA levels at the 0.10 to
0.40 m layers were higher than those observed in vineyard 2 (15-year-old). This can be attributed to the longer history of Zn fungicide application on grapevine leaves and also from poultry waste application used as source of N, P and K in fertilization and grapevine production (Fernández-Calviño et al. 2012).
The highest contents of CuEPA and ZnEPA, CuEDTA and
ZnEDTA in the uppermost layer of the soil (0.00-0.10 m)
(Figure 1 a,b,d,e) can be mainly explainedby the fact that the soil was not tilled(Miotto et al. 2013). Copper has high binding affinity to the organic matter functional groups, like the groups containing S, N, carboxylic and phenolic groups (Croué et al. 2003), increasing its complexation and, consequently, reducing its availability. Zinc normally has higher binding affinity to functional groups of the mineral solid phase of the soil, but a part may also be associated with functional groups of the organic phase (Girotto et al. 2010; Fernández-Calviño et al. 2012). However, part of the Cu and the Zn migrated in depth, and this may have occurred through water flow in the soil mass, through the turbulent water flow in macropores and through cracks in the soil or even by bioturbation (Girotto et al. 2010). For Zn, solute flow in the soil mass appears to be the most important mechanism since a fraction (ZnEPA) of the element tends
The increase of total Cu and Zn, but especially of bioavailable Cu and Zn extracted by EDTA, particularly in the uppermost soil layers, may raise toxicity to plant roots
(Nagajyoti et al. 2010), as well as to spontaneous or sown cover crops that cohabitate the vineyards, and lead to the transfer of the two trace elements on the soil surface either Figure 1. (a) Total copper content (CuEPA); (b) copper avaliable to plants (CuEDTA); (c) correlation between CuEPA and CuEDTA at all depths (n=45); (d) total zinc (ZnEPA); (e) zinc avaliable to plants (ZnEDTA) and (f) correlation between ZnEPA and ZnEDTA at all depths (n=72), in the forest, vineyard 1 (4 years) and vineyard 2 (15 years) soils; (*= means ± standard deviation do not differ from each other according to Tukey’s test p < 0.05). Bars represent standart deviation of the mean. Dashed line represents reference line.
Copper (mg·kg–1)
0 5 10 15 20 25 30 35 40
Soil depth (m)
Soil depth (m)
Soil depth (m)
Soil depth (m)
0.00 0.05 0.10 0.15 0.20 0.25 0.30 0.35 0.40 0.45 0.00 0.05 0.10 0.15 0.20 0.25 0.30 0.35 0.40 0.45 0.00 0.05 0.10 0.15 0.20 0.25 0.30 0.35 0.40 0.45 0.00 0.05 0.10 0.15 0.20 0.25 0.30 0.35 0.40 0.45
Cu total (mg·kg–1)
0 5 10 15 20 25 30 35 40 45 50 55 60
C u a v aliable (mg· kg –1) 0 5 10 15 20 25 30 35 40 45 50 55 60 0 5 10 15 20 25 30 35 40 45 50 55 60
y = -1.75 + 0.72x R2 = 0.91*
Zinc (mg·kg–1)
0 5 10 15 20 25 30 35 40 45 50 55
Zn total (mg·kg–1)
0 5 10 15 20 25 30 35 40 45 50 55 60
Z n a v aliable (mg· kg –1)
y = -0.06 + 0.20x R2 = 0.52*
(5.75 - Tukey 5%)
(3.49 - Tukey 5%)
(6.92 - Tukey 5%)
(2.40 - Tukey 5%)
Forest Vineyard 1 Vineyard 2
(a) (d)
(b) (e)
through the runoff solution or adsorbed in the sediment (Fernández-Calviño et al. 2012), increasing contamination of surface waters adjacent to the vineyards.
Vineyard 1 and vineyard 2 soils exhibited a linear relationship with the CuEPA contents at all depths of the forest
(Figure 1c). The slope of the straight line (0.72) indicates that 72% of the CuEPA was extracted by EDTA, which is available
to plants. The ZnEDTA contents at all depths exhibited a linear
relationship with the ZnEPA contents, but the slope of the
straight line (0.20) suggests that only 20% of the ZnEPA was
extracted by EDTA (Figure 1f). Some studies, for example, those undertaken with Cu in acidic or calcareous soils, report that EDTA may extract from less than 10% up to
95% of total Cu (Chaignon et al. 2003; Toselli et al. 2009). Normally, the quantity of Cu and Zn extracted with EDTA shows a strong correlation with the total quantity, but it is not always correlated with the quantity taken up by the plants (Chaignon and Hinsinger 2003).
Cu and Zn fractions in the soil
In the vineyard 1 soil, the highest contents of CuSol, CuE,
CuMi, CuOM, CuR and the sum of the fractions in general
were observed in the uppermost soil layers, 0.00-0.05 and 0.10-0.20m (Table 2). The highest CuMin and CuOM contents
were observed in the 0.00-0.10m layer in the vineyard 2
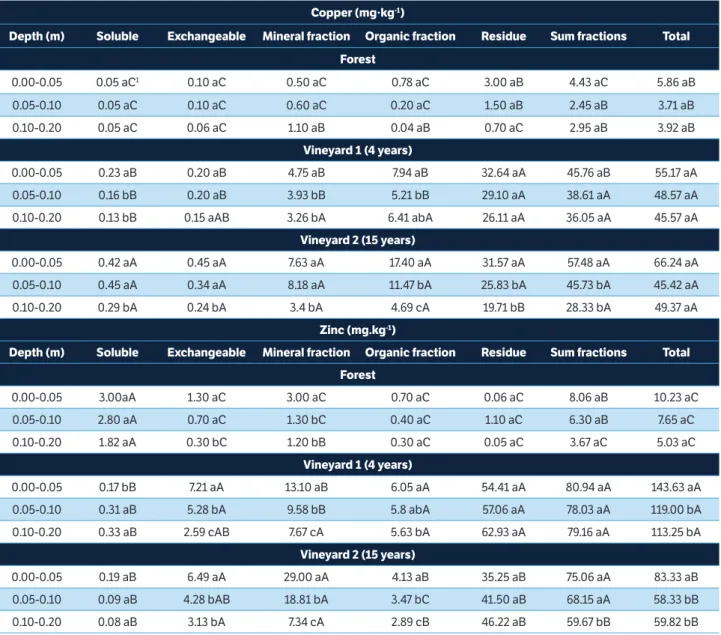
(1)Means ± standard deviation followed by the same uppercase letter in the column and by the same lowercase letter on the line do not differ from each other according to Tukey’s test (p < 0.05); nsi: non-significant interaction.
Table 2. Forms of copper and zinc in three layers of forest, vineyard 1 (4 years) and vineyard 2 (15 years) soils.
Copper (mg·kg-1)
Depth (m) Soluble Exchangeable Mineral fraction Organic fraction Residue Sum fractions Total
Forest
0.00-0.05 0.05 aC1 0.10 aC 0.50 aC 0.78 aC 3.00 aB 4.43 aC 5.86 aB
0.05-0.10 0.05 aC 0.10 aC 0.60 aC 0.20 aC 1.50 aB 2.45 aB 3.71 aB
0.10-0.20 0.05 aC 0.06 aC 1.10 aB 0.04 aB 0.70 aC 2.95 aB 3.92 aB
Vineyard 1 (4 years)
0.00-0.05 0.23 aB 0.20 aB 4.75 aB 7.94 aB 32.64 aA 45.76 aB 55.17 aA
0.05-0.10 0.16 bB 0.20 aB 3.93 bB 5.21 bB 29.10 aA 38.61 aA 48.57 aA
0.10-0.20 0.13 bB 0.15 aAB 3.26 bA 6.41 abA 26.11 aA 36.05 aA 45.57 aA
Vineyard 2 (15 years)
0.00-0.05 0.42 aA 0.45 aA 7.63 aA 17.40 aA 31.57 aA 57.48 aA 66.24 aA
0.05-0.10 0.45 aA 0.34 aA 8.18 aA 11.47 bA 25.83 bA 45.73 bA 45.42 aA
0.10-0.20 0.29 bA 0.24 bA 3.4 bA 4.69 cA 19.71 bB 28.33 bA 49.37 aA
Zinc (mg.kg-1)
Depth (m) Soluble Exchangeable Mineral fraction Organic fraction Residue Sum fractions Total
Forest
0.00-0.05 3.00aA 1.30 aC 3.00 aC 0.70 aC 0.06 aC 8.06 aB 10.23 aC
0.05-0.10 2.80 aA 0.70 aC 1.30 bC 0.40 aC 1.10 aC 6.30 aB 7.65 aC
0.10-0.20 1.82 aA 0.30 bC 1.20 bB 0.30 aC 0.05 aC 3.67 aC 5.03 aC
Vineyard 1 (4 years)
0.00-0.05 0.17 bB 7.21 aA 13.10 aB 6.05 aA 54.41 aA 80.94 aA 143.63 aA
0.05-0.10 0.31 aB 5.28 bA 9.58 bB 5.8 abA 57.06 aA 78.03 aA 119.00 bA
0.10-0.20 0.33 aB 2.59 cAB 7.67 cA 5.63 bA 62.93 aA 79.16 aA 113.25 bA
Vineyard 2 (15 years)
0.00-0.05 0.19 aB 6.49 aA 29.00 aA 4.13 aB 35.25 aB 75.06 aA 83.33 aB
0.05-0.10 0.09 aB 4.28 bAB 18.81 bA 3.47 bC 41.50 aB 68.15 aA 58.33 bB
soil, and decreased with depth (0.10-0.20m) (Table 2), while CuSOL contents, CuR contents, sum of the fractions and CuE
contents were equal among the 0.00-0.05, 0.05-0.10 and lower at the 0.10-0.20m layers.
Th e CuT content was equal in the three layers assessed.
In the three soil layers of vineyard 2, higher contents of CuSol
and CuE were observed in comparison with the vineyard
1 and forest soil. In the vineyard 2 soil, but in the 0.00-0.05 and 0.10-0.20m layers, the highest contents of CuMin and
CuOM were observed, compared to the vineyard 1 and forest
soils. But the CuR, sum of the fractions and CuT contents in
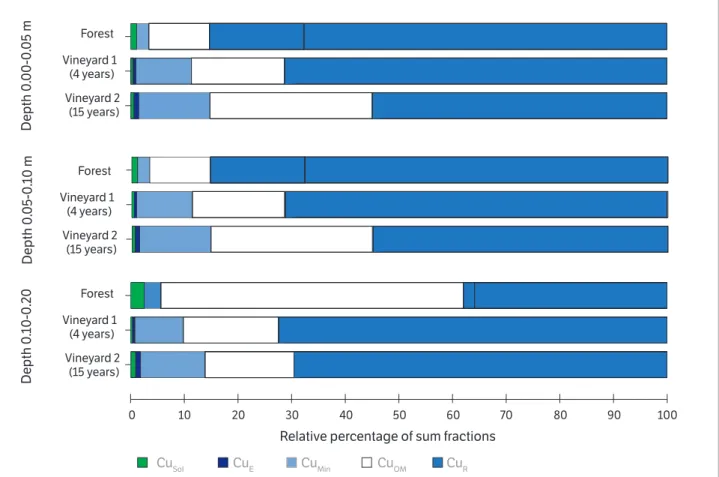
the three layers were similar between the soil of vineyard 2 and vineyard 1. Nevertheless, in all the layers, the contents of the Cu fractions observed in vineyard 1 and, especially, in vineyard 2, were higher than those seen in the forest soil. In the 0.00-0.05, 0.05-0.10 and 0.10-0.20m layers of the forest, vineyard 1 and vineyard 2 soil, in general, the highest percentages of Cu were observed in the residual fraction (CuR), followed by the fraction associated with organic matter
(CuOM) and CuE (Figure 2). But in the vineyard 2 soil where,
in general, the highest Cu contents were seen (Table 2), a decrease in the CuR percentage and an increase especially
in the CuOM fraction, followed by the CuMin fraction, were
observed, especially in the 0.00-0.05 and 0.05-0.10m layer. It should be emphasized that in the 0.10-0.20m layer of the forest soil, a higher percentage of Cu was observed in the exchangeable fraction (CuE), which may be attributed to
the lower pH in water value in this layer (Table 1) in comparison with the soils of the two vineyards.
Th e higher contents of most of the Cu fractions in the uppermost soil layers of the vineyard 1 and 2 soils agree with the results obtained by CuEPA (Figure 1a) and CuEDTA
(Figure 1b). Th e higher contents of the Cu fractions in the soil of vineyard 2 may be attributed to the higher age of the vineyard and, consequently, the history of application of copper-bearing leaf fungicides (Casali et al., 2008). Th e accumulation of Cu in the residual fraction (CuR) in all the
layers of the forest, vineyard 1 and vineyard 2 soils, indicates that the trace element is in a more stable or unavailable fraction (Tessier et al. 1979).
Figure 2. Percent average distribution of Cu fractions (CuEexchangeble; CuSOL soluble; CuMIN bonded to oxides; CuOM bonded to organic matt er and CuR residual Cu) in soil layers of the forest, vineyard 1 (4 years) and vineyard 2 (15 years).
Depth 0
.00-0
.05 m
Depth 0
.05-0
.10 m
Vineyard 2 (15 years) Vineyard 1
(4 years) Forest Vineyard 2
(15 years) Vineyard 1
(4 years) Forest
Vineyard 2 (15 years) Vineyard 1
(4 years) Forest
Relative percentage of sum fractions
CuSol CuE CuMin CuOM CuR
0 10 20 30 40 50 60 70 80 90 100
Depth 0
.10-0
.2
The capacity for inactivating the Cu in the residual fraction when in soil surface layers may be attributed to the higher presence of recalcitrant organic carbon and, in the deeper layers, as in the 0.10-0.20m layer, to the clay and silt content (Table 1), but also to amorphous inorganic matter and clay minerals, as well as reaction time (Tessier et al. 1979). Nevertheless, the results showing an increase in Cu in the faction associated with organic matter (CuOM), especially in the uppermost layers
(0.00-0.05 and 0.05-0.10 m) of the oldest vineyard, agree with those obtained by Casali et al. (2008). This occurs because Cu has the electron configuration [Ar]3d104s1,
and has high reactivity with the functional groups containing S and N, in addition to the carboxylics and phenolics of the soil organic matter (Croué et al. 2003). However, the CuOM contents, for example, in the two
uppermost layers (0.00-0.05 and 0.05-0.10 m) of the vineyard 2 soil were less than the contents reported in studies already undertaken in soils of other vineyards of traditional winegrowing regions, which report contents oscillating from 40 to 400 mg kg-1 (Fernández-Calviño
et al. 2009). This may be explained, not only, but most probably, by the low organic matter contents (Table 1), in comparison to the studies already undertaken, but may also be associated with the composition of the organic matter (Fernández-Calviño et al. 2010).
The increase in the percentage of CuMin, especially
in the uppermost layers of vineyard 2, may happen because of the saturation of the organic matter functional groups (Croué et al. 2003). In the mineral fraction, Cu is associated with the functional groups of Fe and even Mn oxides (Bradl 2004), but also as the soil of the present study has low oxide contents (Table 1), it is possible that part of it is adsorbed with less binding energ y to the silanol and aluminol groups of the phyllosilicates.
The highest ZnE, ZnMin, ZnOM and ZnT contents in
the vineyard 1 and vineyard 2 soils were observed in the uppermost soil layers, especially in the 0.00-0.05m layer (Table 2). But the ZnR contents among the vineyard 1 soil
layers were equal, and in the vineyard 2 soils, the highest ZnR
contents were observed in the 0.00-0.05 and 0.05-0.10 m layers. The highest contents of the ZnE, ZnMin, ZnOM,
ZnR fractions, sum of the fractions and ZnT fraction
in the three layers were observed in the vineyard soils
(Table 2). But the highest ZnOM, ZnR and ZnT contents
were observed in the vineyard 1 soil layers, and in the vineyard 2 soil layers, the highest ZnMin contents were
observed, with the ZnE contents being equal for the soils
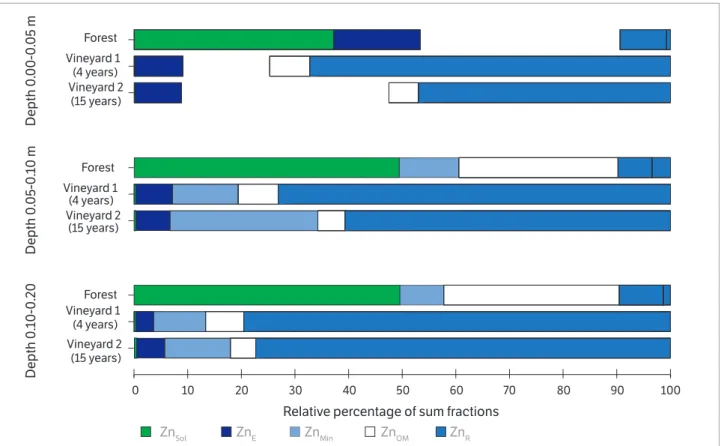
of the two vineyards. In the 0.00-0.05, 0.05-0.10 and 0.10-0.20 m layers, the highest percentages of Zn in the forest, vineyard 1 and vineyard 2 soils were observed in the residual fraction (ZnR) (Figure 3).
In the 0.00-0.05 and 0.05-0.10m layer of the vineyard 1 soil, where the highest ZnT contents were observed (Table 2),
the highest percentages observed were of ZnR. But in
the same soil layers of vineyard 2, which exhibited lower ZnT contents (Table 2), higher percentages of
Zn were observed in the mineral fraction (ZnMin) in
comparison to the vineyard 1 soil. It should be highlighted that especially in the deepest layers (0.05-0.10 and 0.10-0.20 m) in the forest soil, the highest percentages of Zn were observed in the solution (ZnSol), which may
be explained by the low pH values (Table 1), which decreases Zn adsorption with the soil and, consequently, increases its availability to plants.
The higher contents of all the Zn fractions in the soils of the two vineyards in comparison to the forest soil may be attributed to the application of Zn-based leaf fungicides, and in the vineyard 1 soil, also the application of poultry manure. In addition, the higher contents of Zn fractions, such as ZnE, ZnMin, ZnOM and even ZnT in the uppermost layer of
the vineyard 1 and vineyard 2 soils agree with the ZnEPA and
ZnEDTA contents (Figure 1d, 1e) and with the data of the Cu
fractions (Table 2), CuEPA and CuEDTA (Figure 1a, 1b). The
higher CuR contents that were reflected in the percentages
in the vineyard soils, especially in the uppermost layers of vineyard 1, but also the ZnMin in the 0.00-0.05 and 0.05-0.10 m
layers of vineyard 2, represent two fractions of the trace element that are more stable, characterized by low availability and mobility (Fernández-Calviño et al., 2012), explaining in part the low quantity of Zn extracted by EDTA, in relation to the ZnEPA (Figure 1f). Fernández-Calviño et al. (2012)
Relative percentage of sum fractions
ZnSol ZnE ZnMin ZnOM ZnR
0 10 20 30 40 50 60 70 80 90 100
Depth 0
.00-0
.05 m
Depth 0
.05-0
.10 m
Vineyard 2 (15 years) Vineyard 1
(4 years) Forest Vineyard 2
(15 years) Vineyard 1
(4 years) Forest
Vineyard 2 (15 years) Vineyard 1
(4 years) Forest
Depth 0
.10-0
.2
0
Figure 3. Percent average distribution of Zn fractions (ZnEexchangeble; ZnSOL soluble; ZnMIN bonded to oxides; ZnOM bonded to organic matt er and ZnR residual Zn) in soil layers of the forest, vineyard 1 (4 years) and vineyard 2 (15 years).
CONCLUSION
Cu and Zn were accumulated in the uppermost layers of the vineyard soils and especially in higher quantity in the older vineyard. Approximately 72% of the total Cu was extracted by the EDTA method and, thus, may be considered as available to plants; however, only 20% of the total Zn was extracted by EDTA.
Most of the Cu in the vineyard soils was distributed in the residual fraction, characterized by low geochemical mobility, but in the uppermost soil layers of the oldest vineyard, there was an increase in the Cu content associated
with soil organic matter. Most of the Zn in the vineyard soil was distributed in the residual fraction and associated with minerals, which indicates low mobility and also low potential for toxicity to plants and microorganisms.
ACKNOWLEDGMENTS
The authors express their thanks to the CNPq (Universal edict, 2011; Process no 479005/2011-7) and FAPESC
(Public call nº 04/2011; Contract nº 1339/2012-5) for funding.
Brunett o, G., Melo, G.W.B., Terzano, R., Buono, D., Astolfi , S., Tomasi,
N., Pii, Y.,Mimmo, T. and Cesco, S. (2016). Copper accumulation in
vineyard soils: Rhizosphere processes and agronomic practices to
limit its toxicity. Chemosphere, 132, 293-307. htt ps://doi.org/10.1016/j. chemosphere.2016.07.104.
REFERENCES
Casali, C. A., Moterle, D. F., Rheinheimer, D. S.,Brunett o, G., Corcini,
A. L. M., Kaminski, J. and Melo, G. W. B. (2008). Formas e dessorção
de cobre em solos cultivados com videira na Serra Gaúcha do Rio
Grande do Sul. Revista Brasileira de Ciência do Solo, 32, 1479-1487.
Couto, R. R., Lazzari, C. J. R., Trapp, T., De Conti, L., Comin, J. J.,
Martins, S. R., Filho, P.B. and Brunetto, G. (2015). Accumulation and
distribution of copper and zinc in soils following the application
of pig slurry for three to thirty years in a microwatershed of
southern Brazil. Archives of Agronomy and Soil Science, 62,
593-616. https://doi.org/10.1080/03650340.2015.1074183.
Chaignon, V., Sanchez-Neira, I., Herrmann, P., Jaillard, B. and
Hinsinger, P. (2003). Copper bioavailability and extractability
as related to chemical properties of contaminated soils from
a vine-growing area. Environmental Pollution, 123, 229-238.
https://doi.org/10.1016/s0269-7491(02)00374-3.
Chaignon, V. and Hinsinger, P. A. (2003). A biotest for evaluating copper
bioavailability to plants in a contaminated soil. Journal of Environmental
Quality, 32, 824-833.https://doi.org/10.2134/jeq2003.0824.
Citeau, L., Lamy, I., Van Oort, F. and Elsass, F. (2003). Colloidal
facilitated transfer of metals in soils under different land use.
Colloids and Surfaces A: Physicochemical Engineering. Aspects,
217, 11-19. https://doi.org/10.1016/s0927-7757(02)00554-x.
Croué, J. P., Benedetti, M. F.,Violleau, D. and Leenheer, J. A. (2003).
Characterization and copper binding of humic and non humic
organic matter isolated from the South Platte River: Evidence for
the presence of nitrogenous binding site. Environmental Science
Technology, 37, 328-336. https://doi.org/10.1021/es020676p.
Santiago-Martin, A., Oort, F.V., Gonzalez, C., Quintana, J. R., Lafuente,
A. L. and Lamy, I. (2015). Improving the relationship between soil
characteristics and metal bioavailability by using reactive fractions
of soil parameters in calcareous soils. Environmental Toxicology
and Chemistry, 34, 37-44. https://doi.org/10.1002/etc.2772.
Bradl, H. B. (2004). Adsorption of heavy metal ions on soils and
soils constituents. Journal of Colloid and Interface Science, 277,
1-18. https://doi.org/10.1016/j.jcis.2004.04.005.
Empresa Brasileira de Pesquisa Agropecuária (2003). Uvas
americanas e híbridas para processamento em clima temperado;
[accessed 2016 Dec 20]. http://www.cnpuv.embrapa.br/publica/
sprod/UvaAmericanaHibridaClimaTemperado/tabclima.htm
Empresa Brasileira de Pesquisa Agropecuária (1997). Manual
de métodos de análise de solo. Rio de Janeiro: CNPS.
Fernández-Calviño, D., Pateiro-Moure, M., López-Periago, E.,
Arias-Estévez, M. and Nóvoa-Muñoz, J.C. (2008). Copper distribution
and acid-base mobilization in vineyard soils and sediments from
Galicia (NW Spain). European Journal of Soil Science, 59, 315-326.
https://doi.org/10.1111/j.1365-2389.2007.01004.x.
Fernández-Calviño, D., Soler-Rovira, P., Polo, A., Arias-Estévez,
M. and Plaza, C. (2010). Influence of humified organic matter on
copper behavior in acid polluted soils. Environmental Pollution,
158, 3634-3641. https://doi.org/10.1016/j.envpol.2010.08.005.
Fernández-Calviño, D., Pateiro-Moure, M., Nóvoa-Muñoz, J.C.,
Garrido-Rodrigues, B. and Arias-Estévez, M. Zinc distribution
and acid-base mobilization in vineyard soils and sediments.
Science of the Total Environment, 414, 470-479. https://doi. org/10.1016/j.scitotenv.2011.10.033.
Girotto, E., Ceretta, C. A., Brunetto, G., Santos, D. R., Silva,
L. S., Lourenzi, C. R., Lorensini, F., Renan Vieira, C. B. and
Schmatz, R. (2010). Acúmulo e formas de cobre e zinco no
solo após aplicações sucessivas de dejeto líquido de suínos.
Revista Brasileira de Ciência do Solo, 34, 955-965. https://doi. org/10.1590/s0100-06832010000300037.
Mackie, K.A., Müller, T., and Kandeler, E. (2012). Remediation
of copper in vineyards - A mini review. Environmental Pollution,
167, 16-26. https://doi.org/10.1016/j.envpol.2012.03.023.
Miotto, A., Ceretta, C. A., Brunetto, G., Nicoloso, F. T., Girotto, E., Farias, J. G., Tiecher, T. L., Conti, L. and Trentin, G. (2013).
Copper uptake, accumulation and physiological changes in
adult grapevines in response to excess copper in soil. Plant and
Soil, 374, 593-610. https://doi.org/10.1007/s11104-013-1886-7.
Nagajyoti, P. C., Lee, K. D. and Sreekanth, T. V. M. (2010).
Heavy metals, occurrence and toxicity for plants: a review.
Environmental Chemistry Letters, 8, 199-216. https://doi. org/10.1007/s10311-010-0297-8.
Nogueirol, R. C. N., Alleoni, L. R. F., Nachtigall, G. R. and Melo,
G. W. B. (2010). Sequential extraction and availability of copper
in Cu fungicide-amended vineyard soils from southern Brazil.
Journal of Hazardous Materials, 181, 931-937. https://doi. org/10.1016/j.jhazmat.2010.05.102.
Shaheen, S. M., Tsadilas, C. D. and Rinklebe, J. (2015).
Immobilization of soil copper using organic and inorganic
amendments. Journal Plant Nutrition Soil Science, 178,
112-117. https://doi.org/10.1002/jpln.201400400.
Schramel, O., Michalke, B. and Kettrup, A. (2000). Study of
the copper distribution in contaminated soils of hop fields
by single and sequential extraction procedures. The Science
Soil Survey Staff. Soil taxonomy (2006). A basic system of soil
classification for making and interpreting soil surveys, 2.ed.
Washington: US Government Printing Office.
Tedesco, M. J., Gianello, C., Bissani, C., Bohnen, H. and Volkweiss,
S. J. (1995). Análise de solo, plantas e outros materiais. 2. ed.
Porto Alegre: UFRGS/FA/DS.
Tessier, A., Campbell, P. G. C. and Bisson, M. (1979). Sequential
extraction procedure for the speciation of the speciation of
particulate trace metals. Analytical Chemistry, 51, 844-851.
https://doi.org/10.1021/ac50043a017.
Tiecher, T. L., Ceretta, C. A., Tiecher, T., Ferreira, P. A. A., Nicoloso,
F. T., Soriani, H. H., Rossato, L.V., Mimmo, T., Cesco, S., Lourenzi, C.
R., Giachini, A. J. and Brunetto, G. (2016). Effects of zinc addition to
a copper-contaminated vineyard soil on sorption of Zn by soil and
plant physiological responses. Ecotoxicology and Environmental
Safety, 129, 109-119. https://doi.org/10.1016/j.ecoenv.2016.03.016.
Toselli, M., Schiatti, P., Ara, D., Bertacchini, A. and Quartieri,
M. (2009). The accumulation of copper in soils of the Italian
region Emilia-Romagna. Plant, Soil and Environment, 55, 74-79.
United States Environmental Protection Agency (1996). Method
3050B. Acid digestion of sediments, sludges, and soils. [accessed
2012 April 13]. http://www.epa.gov/wastes/hazard/testmethods/
sw846/pdfs/3050b.pdf
Santos, R.D., Santos, H. G., Ker, J. C., Anjos, L. H. C. and Shimizu,
S. H. (1982). Manual de descrição e coleta de solo no campo.
2. ed. Campinas: Sociedade Brasileira de Ciência dos Solo.
Schmitt, D. E., Gatiboni, L. C., Tiecher, T., Lorensini, F., Heinzen,
J., Ambrosini. V.G., Moraes, M. P. and Brunetto, G. (2013).
Accumulation of phosphorus fractions and contamination
potential in vineyard soils in the southern region of the state of
Santa Catarina, Brazil. Revista Brasileira de Ciência do Solo, 37,