________________________________
1 Engº Agrícola, Professor Adjunto II, Instituto de Ciências Agrárias, ICA/UFMG, Montes Claros – MG.
2 Profa., Eng. Agricola, Profa. Doutora, Depto de Engenharia Agrícola - Universidade Federal de Viçosa - DEA/UFV,Viçosa - MG. 3 Prof., Engº Agrícola, Prof. Doutor, Departamento de Engenharia Agrícola, DEA/UFV, Viçosa – MG.
4 Profa., DSc, Universidade Estadual de Montes Claros, Departamento de Ciências Agrárias, Janaúba – MG.
5 Prof. Adjunto II, Faculdade de Ciências Agrárias – Depto. de Agronomia, UFVJM - Universidade Federal dos Vales do
Jequitinhonha e Mucuri, Campus JK, Diamantina – MG. Recebido pelo Conselho Editorial em: 2-3-2012 Aprovado pelo Conselho Editorial em: 9-7-2012
QUALITY IN BROILER HOUSES
IRENE MENEGALI1, ILDA F. F. TINÔCO2, SÉRGIO ZOLNIER3, CINARA DA C. S. CARVALHO4, MARIA C. DE C. GUIMARÃES5
ABSTRACT: To maintain a competitive development of the Brazilian aviculture, some measures must be taken to enable the identification and reduction of risks to the health of birds, as well as for the physical environment. Therefore, the aim of this study was to evaluate the effectiveness of three different systems of minimum ventilation (positive pressure - SVMP, negative pressure - SVMN and natural ventilation - SVMNat) in the air quality during the first 21 days of life of broiler chicks, during winter. Three points were selected along the length to verify ammonia, carbon monoxide and oxygen concentrations at 3a.m., 9a.m., 3p.m. and 9p.m., by the respiration level of birds and workers. The averages of pollutant gases did not exceed the tolerance levels for the three minimum ventilation systems evaluated, which is 20 and 10ppm for the birds level and 20 and 39ppm for the workers level, for ammonia and carbon monoxide, respectively. It was evident that the minimum ventilation systems were appropriately sized for the required minimum ambient air renovation, in respect to ventilation rates applied for the SVMN and SVMP systems, and with air velocity at levels that do not stress the chicks, including for the SVMNat. The three studied systems of minimum ventilation allowed the birds to externalize their productive performance, with values close to the ones considered satisfactory for all evaluated parameters, in accordance with the Brazilian aviculture standards.
KEYWORDS:aviculture, broiler chicks, gas concentration, air renovation.
INFLUÊNCIA DE DIFERENTES SISTEMAS DE VENTILAÇÃO MÍNIMA NA QUALIDADE DO AR DE GALPÕES PARA FRANGOS DE CORTE
RESUMO: Para a manutenção de um desenvolvimento competitivo da avicultura brasileira, demandam-se medidas que possibilitem a identificação e a redução de riscos à saúde das aves, bem como do meio físico ambiental. Sendo assim, objetivou-se com este trabalho avaliar a eficiência de três diferentes sistemas de ventilação mínima (pressão positiva - SVMP, pressão negativa - SVMN e por via natural - SVMNat), na qualidade do ar durante os primeiros 21 dias de vida de pintos de corte, na fase de inverno. Foram selecionados três pontos ao longo do comprimento para a verificação das concentrações de amônia, monóxido de carbono e oxigênio nos horários de 3; 9; 15 e 21 h, ao nível da respiração das aves e dos trabalhadores. As médias dos gases poluentes não ultrapassaram os níveis de tolerância para os três sistemas de ventilação mínima avaliados, que são de 20 e 10 ppm para o nível das aves e 20 e 39 ppm no nível dos trabalhadores, para amônia e monóxido de carbono, respectivamente. Evidenciou-se que os sistemas de ventilação mínima foram dimensionados adequadamente em termos de renovação mínima necessária do ar ambiente, em relação às taxas de ventilação aplicadas para os dois sistemas, SVMN e SVMP, e com velocidade do ar em níveis não estressores aos pintinhos, inclusive para o SVMNat. Os três sistemas de ventilação mínima estudados possibilitaram às aves externar seu desempenho produtivo, com valores próximos aos considerados satisfatórios para os parâmetros avaliados, de acordo com os padrões da avicultura brasileira.
INTRODUCTION
The minimum ventilation is defined as the minimum amount of air exchange required to maintain the environment at the poultry facility in healthy conditions, as well as the welfare and productive efficiency of the birds (TINÔCO, 2004), helping to reduce the concentration of toxic gases, such as ammonia, carbon monoxide, carbon dioxide and dust (RONCHI, 2004). These pollutants are considered harmful to health and development of broilers, especially in the first 21 days of life of these animals (VIGODERIS et al. 2010; MENEGALI et al. 2009; NÄÄS et al. 2007; MIRAGLIOTTA et al., 2006).
The combined effects of environmental variables such as temperature, humidity and air velocity, ventilation rate and concentration of particles, gases and microorganisms in the air, determine the environmental quality in poultry facilities and their influence on the quality of life of the birds (BANHAZI et al., 2008).
According to TINÔCO (2004), the options to ensure the renewal of the air in winter and in the early stages of the birds life, for the conditions of the Brazilian poultry facilities, can be positive pressure ventilation and negative pressure ventilation, both with ventilators and/or exhausts, respectively, positioned in strategic parts of the growth area, and also through natural ventilation, conceiving strategic openings in the area of growth or brooding.
Thus, the aim of this study was to evaluate the effectiveness of three different systems of minimum ventilation (positive pressure - SVMP, negative pressure - SVMN and by natural ventilation - SVMNat) to promote air quality during the first 21 days of the broiler chicks life, during the winter.
MATERIAL AND METHODS
The experiment was conducted in three similar broiler poultries of the same productive core during the winter season, belonging to an integration of commercial enterprise system, representative of largely aviculture industry of Brazil.
The three aviaries have course from East to West, with dimensions of 14m wide by 55m length, 2.90m of right foot, positioned side by side and apart approximately 8m from each other. The roof structure was composed of round wood frames, covered with clay tiles and supported on pillars with concrete with section of 0.15m by 0.15m, spaced by 4.20m. The roof covering is gabled, with 40% of inclination and eaves of 0.65m without louver. The lining is made of yellow polyethylene tarp with 2.9m from the floor. The north-south faces of the sheds have low walls with 0.30m high, also of masonry of concrete blocks, in which were affixed wire mesh screens of 3.5cm to the height of the roof and curtains of polyethylene, yellow color, with manual override and closure from bottom to top. All aviaries received new bed of coffee husk, with 5cm thick. In the initial stage, the bed management activities included the revolving of it, as required by the growth of the birds, following the recommendations of the company's routines. The amount of equipment like feeding and drinking places were consistent with the technical recommendations of the manufacturers, i.e. tubular manual feeding places in the proportion of one for every 50 birds and bell drinkers in the proportion of one for every 80 birds.
We used birds of the AVIAN lineage (males), originating from the same hatchery, with the
amount of 8.500 birds per house, totalizing the density of 11 birds/m2. The management practices of
the birds followed the guidance techniques commonly used by the company, and by the same handler identically in all houses.
The collection of experimental data was performed in the area of initial growth of broilers, located inside the poultry houses and called brooding, comprising the period from 1 to 21 days, corresponding to the period of warming in the first three weeks of birds life. On the first day of
brooding length, corresponding to the increase of over 63.21m3 of air inside the brooding every two days, thus reaching the entire length of the house at the end of 21-day-old birds.
Each shed was equipped with a type of minimum ventilation system (negative, positive and natural) in order to renew the air and promote hygienic ventilation, held especially during winter.
The minimum ventilation system by positive pressure (SVMP) consisted of an axial ventilator, activated and turned off by the use of timers (Figure 1). It was positioned in the line of the lining, with flow in the vertical direction over the deflector of 1.5m diameter. The choice of this type of ventilator was due to the fact that this is the standard ventilators used by the poultry chain in Brazil, being readily available on the world market.
FIGURE 1. Minimum ventilation system by positive pressure (ventilator). Ventilator positioned inside the installation on the lining height, with coupled deflector in order to avoid the incidence of air jet directly on the birds.
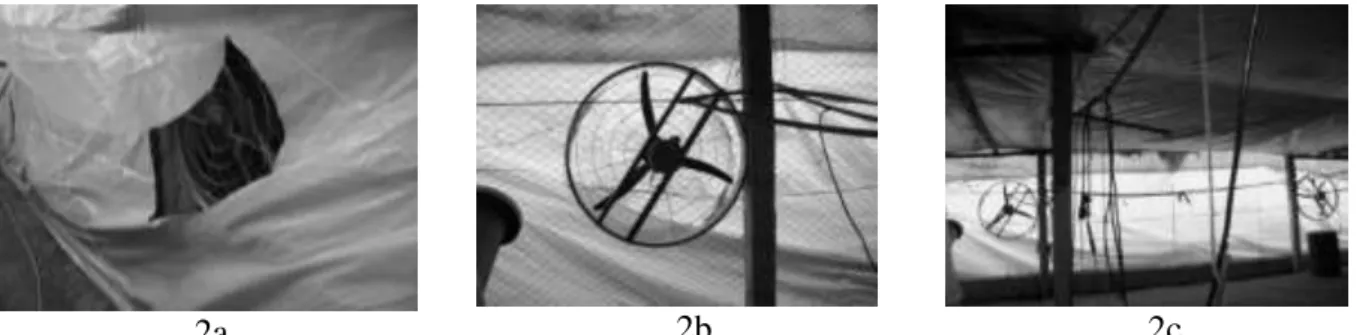
For the ventilation system by negative pressure an exhaust was used. This minimum ventilation system was positioned on the side of the shed, in the anteroom preceding the brooding environment, which was protected by side curtains, aiming to reduce the space to be heated (Figure 2).
2a 2b 2c
FIGURE 2. Minimum ventilation system by negative pressure (exhaust). 2a) View of the exhaust on the outside of the shed; 2b) View of the exhaust inside the shed; 2c) View of the exhaust located in the anteroom.
The intermittent operation of the minimum ventilation system inside the sheds followed the recommendation of levels rates for renovations of all the brooding air, programmed as suggested by CURTIS (1983) for winter conditions, using a timer on/off, which controls the time intervals determined for each week observed (Table 1). The values were given in m3 of air exchange per hour, by age and animal. The values required were set at the end of each week as the medium
working flow during each interval of 7 days, i.e., they worked with 0.23m3/hour/animal the first 7
days of lodging, and during the second week of the birds life, 0.32 m3/hour/animal, and during the
TABLE 1. Intermittent operation schedule of minimum ventilation systems for the negative pressure systems (SVMN) and positive pressure (SVMP) for the heating phase.
Weeks (Minutes)* Time on (Minutes)* Time off Number of Renovations/hour
First 1 10 6 renovations/hour
Second 1 8 7 renovations/hour
Third 1 7 8 renovations/hour
*The operating time on/off was the same for the both systems (SVMN and SVMP)
The minimum ventilation system by natural ventilation occurred through the handling of curtains, with the partial opening of the same, i.e., lowering them till a certain height (avoiding harm and/or decrease the appropriate level of internal temperature of the sheds) during the hottest hours of the day and as needed, also by the opening of the doors when workers entered during the work surveys.
Three wood heating bells were distributed in order to maintain uniformity in heating the total area of growth. The supply of bells was manual, following environmental requirements of the birds.
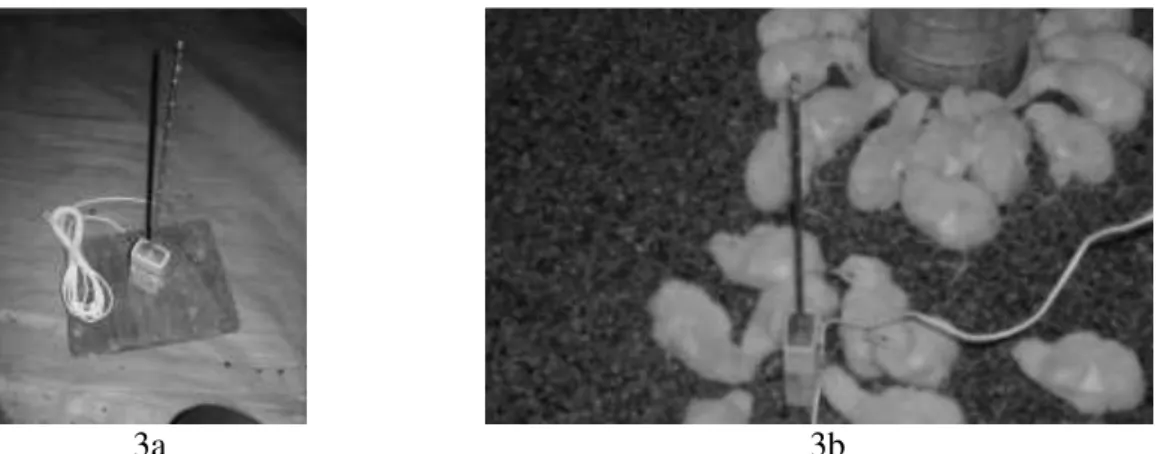
For the air velocity, we used hot wire digital anemometer instruments, ÔMEGA FMA-900-V, range of 0 to 0.51ms-1, accuracy of 2% at a temperature of 0 to 50°C (Figure 3). The output signal of the equipment is from 0 to 5V and power supply of 15-24V.
3a 3b
FIGURE 3. 3a) Hot wire digital anemometer; 3b) Positioning of the anemometer inside the installations.
For the verification of the air velocity data, it was used analog input modules, Model IP-7017. The connection from the anemometer to the module was made by twisted telephone wires FI 2 x 0.24mm2. The collected data were stored daily in text format files, using a computer program
developed in the programming language C + + Builder version 6.0 (Figure 4).
Measurements of instantaneous concentrations of ammonia, carbon monoxide and oxygen in ppm in the level of birds and workers were made. The measurements of ammonia, carbon monoxide and oxygen were performed at three points inside the brooding (same points where the thermal environment data was collected, as shown in Figure 5), of a height of 0.30m from the floor, i.e., approximately the height of bird respiration and 1.6m, average height of the workers. The data collections were performed at 3a.m., 9a.m., 3p.m. and 9p.m., in the sheds in analysis throughout the experimental period. Due to the impossibility of performing simultaneous measurement of gases in the mentioned time, we specified that the maximum interval of time between the beginning of the first and the last measurement was about 30 minutes.
FIGURE 5. Sketch of the distribution and position of the sensors for monitoring the thermal environment throughout the installations, and where the measurements of instantaneous concentrations of ammonia, carbon monoxide and oxygen in ppm, in the level of birds and workers were made. Units of measure expressed in meters.
Referring to data collect for concentrations of ammonia it was used an electrochemical principle sensor with a resolution of 0.1ppm and 1ppm accuracy that detects the instantaneous
concentration in a measurement range of 0 to 100ppm. For CO and O2, we used an electrochemical
sensor with a resolution of 1ppm and 1ppm accuracy that detects the instantaneous concentration
in a measurement range of 0 to 100ppm.
The experiment was conducted in a randomized block design (RBD) with a split-plot in time, with the plots: minimum ventilation by negative pressure (SVMN), minimum ventilation by positive pressure (SVMN), and by natural ventilation (SVMNat), and in subplots, the time (weekdays). In this analysis were considered as replicates the times at which the variables were measured. These environmental variables were subjected to analysis of variance, and the means were compared using the Tukey test adopting the 5% level of probability, by the Statistical Analysis System (SAS WINDOWS, 1989) program.
RESULTS AND DISCUSSION
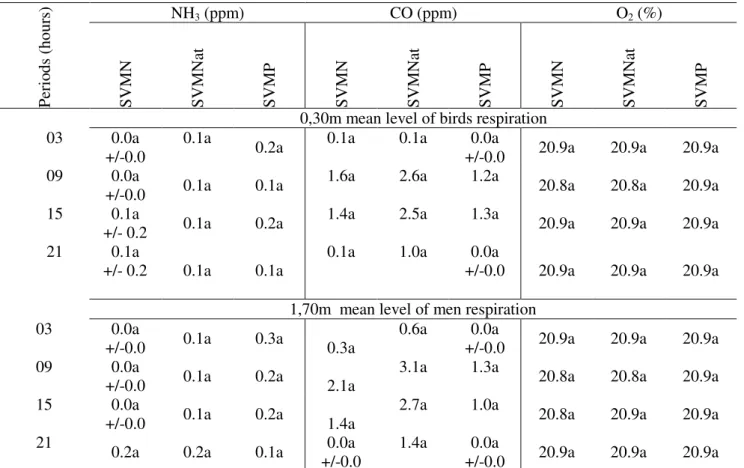
Table 2 shows the mean concentrations of ammonia, carbon monoxide and oxygen levels in the first week of life of the birds.
It appears that there was no statistical difference (P<0.05) between the different minimum ventilation systems in the first week of the birds life for variables NH3, CO and O2. Considering the
level of CO and NH3 concentrations found in the indoor environment, it can be seen from Table 2
TABLE 2. Weekly average concentrations of ammonia (NH3), carbon monoxide (CO) and levels of
oxygen (O2), daily observed in the first week of life of the birds at four different times
(3am, 9am, 3pm and 9pm), for the treatments SVMN, SVMP and SVMNat.
Pe ri ods ( ho ur
s) NH3 (ppm) CO (ppm) O2 (%)
SV MN SV MNat SV MP SV MN SV MNat SV MP SV MN SV MNat SV MP
0,30m mean level of birds respiration 03 0.0a
+/-0.0
0.1a
0.2a 0.1a 0.1a +/-0.0 0.0a 20.9a 20.9a 20.9a 09 0.0a
+/-0.0 0.1a 0.1a
1.6a 2.6a 1.2a
20.8a 20.8a 20.9a 15 0.1a
+/- 0.2 0.1a 0.2a
1.4a 2.5a 1.3a
20.9a 20.9a 20.9a 21 0.1a
+/- 0.2 0.1a 0.1a
0.1a 1.0a 0.0a
+/-0.0 20.9a 20.9a 20.9a
1,70m mean level of men respiration 03 0.0a
+/-0.0 0.1a 0.3a 0.3a
0.6a 0.0a
+/-0.0 20.9a 20.9a 20.9a 09 0.0a
+/-0.0 0.1a 0.2a 2.1a
3.1a 1.3a 20.8a 20.8a 20.9a
15 0.0a
+/-0.0 0.1a 0.2a 1.4a
2.7a 1.0a
20.8a 20.9a 20.9a 21
0.2a 0.2a 0.1a 0.0a +/-0.0
1.4a 0.0a
+/-0.0 20.9a 20.9a 20.9a
The means followed by at least one same letter in the line do not differ among each other in a level of 5% probability by the Tukey test.
With the use of minimum ventilation, the air exchanges become more appropriate and lower the particle concentrations of CO, CO2 and NH3, maintaining the concentrations of O2 stable,
thereby reducing the incidence of ascites, main respiratory disease that attacks the birds (RONCHI , 2004), and consequently decreasing the incidence of respiratory diseases to humans providing health conditions for both. The presence of O2 in the appropriate level can be considered an
indicative that the minimum ventilation was correct and indicate lower risk for the presence of nerve gases in indoor environments (CARVALHO et al. 2011).
With regard to ammonia, were found the best conditions for welfare of broilers, in conditions involving the ideal thermal environment with ambient ammonia concentrations below 5ppm (OWADA et al., 2007). However, according to these authors, values below 5ppm in the sheds are rarely found.
The fact that average concentrations of NH3 below 5ppm were found in all treatments is due
to the use of new bed, based on coffee husk.
With regard to the concentrations of CO, it was found that the highest values were found between 9a.m. and 15p.m. for the three systems of minimum ventilation. It was also observed that the SVMNat treatment presented the major averages, showing a small difference compared to the SVMN and SVMP systems with forced ventilation.
The average values of CO for the week represents no risk to the health of young birds, because we detected concentration levels below the maximum limit for continuous exposure of animals, which is 10ppm (TINÔCO, 2004; FURTADO et al., 2010; PONCIANO et al., 2011).
Table 3 represents the mean values of ammonia, carbon monoxide and oxygen levels in the second week of life of the birds, in the times of 3a.m., 9a.m., 3p.m. and 9p.m. for SVMN, SVMNat and SVMP minimum ventilation systems.
There was no statistical difference (P<0.05, Tukey test) for the second week of life of the birds for variables O2, for the observed average in level of the birds. However, for concentrations of
CO there was a statistical difference at 9p.m. in level of birds with better conditions in SVMP.
Considering the level of CO and NH3 concentration found in the indoor environment, it can
be seen from Table 3 that the levels were low, not reaching the maximum range of exposure, ensuring a good development and health of the birds.
TABLE 3. Average concentrations of ammonia (NH3), carbon monoxide (CO) and levels of oxygen
(O2), daily observed in the second week, at the average level of respiration of birds and
workers at four different times (3am, 9am, 3pm and 9pm), for the treatments SVMN, SVMNat and SVMP.
P
er
io
d
(H
our
s)
NH3 (ppm) CO (ppm) O2 (%)
SV
MN
SV
MNat
SV
MP
SV
MN
SV
MNat
SV
MP
SV
MN
SV
MNat
SV
MP
0.30m (mean level of birds respiration)
03 1.2a 1.0a 1.00a 0.1a 0.7a 0.0a 20.9a 20.9a 20.9a 09 1.4a 1.6a 0.6a 1.2a 3.8a 0.4a 20.9a 20.9a 20.9a 15 2.0a 1.2a 0.7a 1.3a 2.9a 0.8a 20.9a 20.9a 20.9a 21 1.5a 1.1a 0.8a 0.1b 3.0b 0.0a 20.9a 20.9a 20.9a
1.70m (mean level of men respiration)
03 1.4a 1.3a 1.2a 0.0a 0.3a 0.0a 20.9a 20.9a 20.9a 09 1.7a 2.0a 0.7a 1.0a 3.7a 0.6a 20.8a 20.9a 20.8a 15 2.8a 1.3ab 0.6b 1.0a 3.0a 1.0a 20.9a 20.9a 20.9a 21 1.8a 1.4a 1.0a 0.0a 1.6a 0.0a 20.8a 20.8a 20.8a
The means followed by at least one same letter in the line do not differ among each other in a level of 5% probability by the Tukey test.
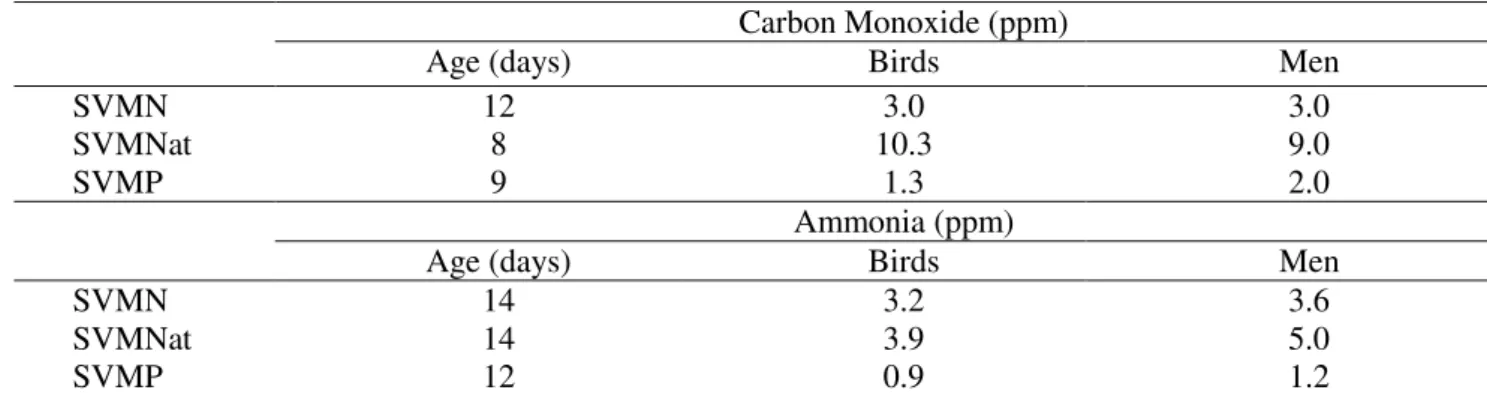
Regarding to the observed average in the second week to the concentration of ammonia gas and CO, any of the observed schedules presented danger levels of exposure to birds health on farms. In Table 4, the maximum concentrations of ammonia and CO for the three systems observed during the second week are listed.
TABLE 4. Maximum concentrations verified in the second week of life of birds for CO and NH3 in
ppm.
Carbon Monoxide (ppm)
Age (days) Birds Men
SVMN 12 3.0 3.0
SVMNat 8 10.3 9.0
SVMP 9 1.3 2.0
Ammonia (ppm)
Age (days) Birds Men
SVMN 14 3.2 3.6
SVMNat 14 3.9 5.0
When considering the isolated values without calculating the average concentration, it can be seen that the SVMNat system presented CO values that exceed the acceptable levels of 10ppm (FURTADO et al., 2010; PONCIANO et al., 2011) , whereas for concentrations of ammonia also the highest levels were observed in SVMNat system, however, with values below harmful levels. Thus, it is possible to observe the best conditions in the internal environment, aiming to reduce gas pollutants, justifying the hygienic ventilation and showing an accented efficiency in SVMP.
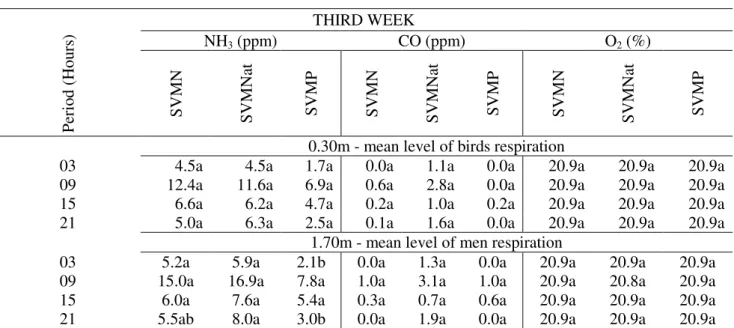
Table 5 presents the average values of concentrations of ammonia, carbon monoxide and oxygen levels in the third week of birds life, at the times of 3a.m., 9a.m., 3p.m. and 9p.m. for SVMN, SVMNat and SVMP minimum ventilation systems.
In Table 5 at 9a.m., there is a balance in the incidence of concentration levels for the mechanical ventilation systems SVMN and SVMP. The higher concentration of ammonia was observed in the SVMNat system; despite the values being within acceptable limits expected for the third week accommodation of poultry, where the internal heating was conducted more sporadically.
TABLE 5. Weekly average concentrations of ammonia (NH3), carbon monoxide (CO) and levels of
oxygen (O2), daily observed during the third week, to the average respiration level of
birds and workers, in four different times (3am, 9am, 3pm and 9pm), in the treatments SVMN, SVMNat and SVMP.
THIRD WEEK
Pe
ri
od
(
H
ou
rs
) NH3 (ppm) CO (ppm) O2 (%)
SV
MN
SV
MNat
SV
MP
SV
MN
SV
MNat
SV
MP
SV
MN
SV
MNat
SV
MP
0.30m - mean level of birds respiration
03 4.5a 4.5a 1.7a 0.0a 1.1a 0.0a 20.9a 20.9a 20.9a 09 12.4a 11.6a 6.9a 0.6a 2.8a 0.0a 20.9a 20.9a 20.9a 15 6.6a 6.2a 4.7a 0.2a 1.0a 0.2a 20.9a 20.9a 20.9a 21 5.0a 6.3a 2.5a 0.1a 1.6a 0.0a 20.9a 20.9a 20.9a
1.70m - mean level of men respiration
03 5.2a 5.9a 2.1b 0.0a 1.3a 0.0a 20.9a 20.9a 20.9a 09 15.0a 16.9a 7.8a 1.0a 3.1a 1.0a 20.9a 20.8a 20.9a 15 6.0a 7.6a 5.4a 0.3a 0.7a 0.6a 20.9a 20.9a 20.9a 21 5.5ab 8.0a 3.0b 0.0a 1.9a 0.0a 20.9a 20.9a 20.9a
The means followed by at least one same letter in the line do not differ among each other in a level of 5% probability by the Tukey test.
The maximum concentration of ammonia gas, suggested by the National Institute for Occupational Safety and Health (NIOSH, 2003), that humans can be exposed is 25ppm for exposure time of 8 hours, 35ppm for 15 minutes and 50ppm for exposure of 5 minutes.
Management activities within the installations can expose the animals to respiratory diseases especially during the winter, when the side curtains consequently remain closed for a longer period of time to keep the internal heating. Thus, we observe that minimum ventilation rates can greatly minimize the potential for gas concentrations avoiding harm to the health of birds.
It is possible to observe from Table 5, that the mechanical ventilation systems were more efficient in reducing the concentration of NH3 and CO gases, showing the beneficial effects of
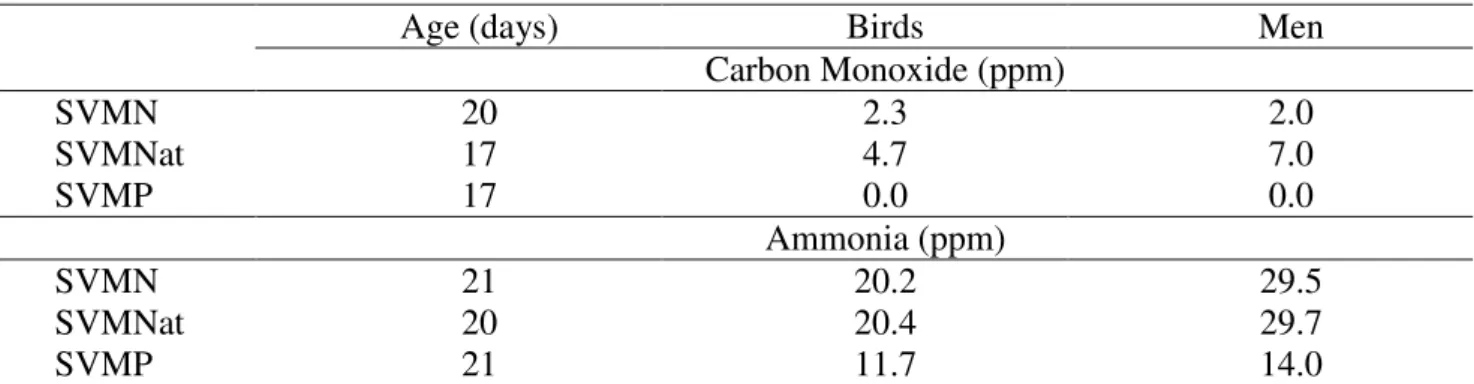
In Table 6 are the maximum concentrations of carbon monoxide and ammonia, checked inside the facility during the third week of life of the broilers.
It was checked in the results of maximum ammonia concentration, concentrations in the thresholds of acceptable levels especially in SVMN and SVMNat facilities, on different days, which may ultimately harm both human and animal health; CARVALHO et al. (2011) and FURTADO et al. (2010) recommend a maximum level of 20ppm ammonia for birds.
TABLE 6. Maximum concentrations verified in the third week of life of the birds for NH3 and CO
in ppm.
Age (days) Birds Men
Carbon Monoxide (ppm)
SVMN 20 2.3 2.0
SVMNat 17 4.7 7.0
SVMP 17 0.0 0.0
Ammonia (ppm)
SVMN 21 20.2 29.5
SVMNat 20 20.4 29.7
SVMP 21 11.7 14.0
Conditions considered worrisome for birds are verified when the levels of toxic gases in ambient air are above the maximum limits desirable to the animal health. This situation of high concentrations is common to be found when not using or do not effectively control the hygienic ventilation in the first weeks of the birds life. MENEGALI et al. (2009) and VIGODERIS et al. (2010), in researches with facilities for broilers in southern Brazil during the winter, found average concentrations of ammonia ranged between 13 and 28ppm in the third week of life of the animals. According to CARVALHO et al. (2011), concentration values of ammonia greater than 20ppm, for a long period of exposure, can cause various health problems in birds, as well as to the workers.
CONCLUSION
For the conditions under which the work was performed and based on these results, we can conclude that:
The hygienic renovation of the air was obtained with satisfactory levels in both minimum ventilation systems evaluated, SVMN and SVMP, with adequate oxygen levels within the installations, and also with concentrations of toxic gases, ammonia and carbon monoxide, with levels below the considered harmful to the health of birds, thus verifying good indoor air quality.
The concentration levels of ammonia and carbon monoxide to SVMNat, offered no health risks to the birds. However, it presented a higher level than the other minimum ventilation systems throughout the observed period.
ACKNOWLEDGMENT
To CAPES (Coordination of Improvement of Higher Education Personnel), CNPq (National Council for Scientific and Technological Development), the Foundation for Research Support of the State of Minas Gerais (FAPEMIG)) and the Federal University of Viçosa (UFV).
REFERENCES
BANHAZI, T.M.; SEEDORF, J.; LAFFRIQUE, M.; RUTLEY, D.L. Identification of the risk factors for high airborne particle concentrations in broiler buildings using statistical modeling.
CARVALHO, C. C. S. ; SOUZA, C. F. ; TINOCO, I. F. F. ; VIEIRA, M. F. A. ; MINETTE, L. J. . Segurança, saúde e ergonomia de trabalhadores em galpões de frangos de corte equipados com
diferentes sistemas de abastecimento de ração. Engenharia Agrícola, Jaboticabal, v. 31, p. 438-447,
2011.
CURTIS, S.E. Environmental management in animal agriculture. Ames: The Iowa State
University, 1983. 409p.
FURTADO, D.A.; ROCHA, H.P.; NASCIMENTO, J.W.B.; SILVA, J.H.V. Índíces de conforto
térmico e concentração de gases em galpões avícolas no semiárido paraibano. Engenharia Agrícola,
Jaboticabal, v.30, n.6, p.993-1002, nov./dez. 2010.
MENEGALI, I.; TINÔCO, I.F.F.; BAÊTA, F.C.; CECON, P.R.; GUIMARÃES, M.C.C;
CORDEIRO, M.B. Ambiente térmico e concentração de gases em instalações para frangos de corte
no período de aquecimento. Revista Brasileira de Engenharia Agrícola e Ambiental, Campina
Grande, v.13, p.984–990, 2009.
MIRAGLIOTTA, M.Y.; NÄÄS, I.A.; MANZIONE, R.L.; NASCIMENTO, F.F. Spatial analysis of stress conditions inside broiler house under tunnel ventilation. Scientia Agricola, Piracicaba, v.63,
n.5, p.426-432, September/October 2006.
NÄÄS, I.A.; MIRAGLIOTTA, M.Y.; BARACHO, M.S.; MOURA, D.J. Ambiência aérea em
alojamento de frangos de corte: poeira e gases. Engenharia Agrícola, Jaboticabal, v.27, n.2,
p.326-335, maio/ago. 2007.
NIOSH – National institute for occupational safety and health. Versão eletrônica 2003. Disponível
em: <http://cdc.gov/niosh/pel88/7664-41.html>. Acesso em: 19 jul. 2005.
OWADA, A. N.; NÄÄS, I. A.; MOURA, D. J.; BARACHO, M. S. Estimativa de bem-estar de frango de corte em função da concentração de amônia e grau de luminosidade no galpão de
produção. Engenharia Agrícola, Jaboticabal, v.27, n.3, p.611-618, 2007.
PONCIANO, P.F.; LOPES, M.A.; YANAGI JUNIOR, T.; FERRAZ, G.A.S. Análise do ambiente para frangos por meio da lógica fuzzy: uma revisão. Archivos de Zootecnia. Córdoba. Espanha. n.60, p1a13. 2011. Disponível em: <http://www.uco.es/organiza/servicios/publica/az/php/img/web/ 10_13_41_1783REVISIONAnalisePonciano.pdf<. Acesso em: 01 fev. 2012.
RONCHI, C.. Principais práticas de manejo para aves recém nascidas. Revista Aveworld, Campinas, v. 1, n. 6, p.26-30, 2004.
SAS-WINDOWS Institute. Propriety software release 6.08. Cary, 1989.
TINÔCO, I.F.F. A granja de frangos de corte. Produção de frangos de corte. Campinas: FACTA, 2004. 356p.
VIGODERIS, R.B.; CORDEIRO, M.B.; TINÔCO, I.F.F.; MENEGALI, I.; SOUZA JÚNIOR, J.P.; HOLANDA, M.C.R. Avaliação do uso de ventilação mínima em galpões avícolas e de sua
influência no desempenho de aves de corte no período de inverno. Revista Brasileira de Zootecnia,