http://www.uem.br/acta ISSN printed: 1679-9275 ISSN on-line: 1807-8621
Doi: 10.4025/actasciagron.v39i2.31065
Physiological and sensorial quality of Arabica coffee subjected to
different temperatures and drying airflows
Guilherme Euripedes Alves1*, Flávio Meira Borém1, Eder Pedroza Isquierdo2, Valdiney Cambuy Siqueira3, Marcelo Ângelo Cirillo4 and Afonso Celso Ferreira Pinto1
1
Laboratório de Processamento de Produtos Agrícolas, Departamento de Engenharia,Universidade Federal de Lavras, 37200-000, Lavras, Minas Gerais, Brazil. 2Departamento de Agronomia, Universidade do Estado de Mato Grosso, Cáceres, Mato Grosso, Brazil. 3Faculdade de Ciências Agrárias, Universidade da Grande Dourados, Dourados, Mato Grosso do Sul, Brazil. 4
Departamento de Ciências Exatas, Universidade Federal de Lavras, Lavras, Minas Gerais, Brazil. *Author for correspondence. E-mail: guiualves@gmail.com
ABSTRACT. The objective of this study was to evaluate the correlation between a group of physiological variables (electrical conductivity, potassium leaching, and germination percentage) and a group of drying kinetics variables (drying time and drying rate) in addition to verifying the relation between drying kinetics variables and coffee quality as a function of processing type, temperature, and drying airflow. Coffee drying was conducted in a fixed-layer dryer at two temperatures and two airflows. After drying, an evaluation of the physiological and sensorial quality was conducted. Based on the results obtained, the following conclusions were drawn: coffee that is processed via a dry method is more sensitive to mechanical drying with heated air than coffee processed via a wet method, resulting in poor physiological performance; airflow does not interfere with the physiological quality of pulped and natural coffees; a temperature increase from 40 to 45°C resulted in a decrease in the physiological quality only for pulped coffee; and an increase in the drying rate as a result of an increase in the drying temperature to 40°C had a negative effect on the sensorial quality of pulped coffee.
Keywords: drying kinetics, processing, drying rate.
Qualidade fisiológica e sensorial do café arábica submetido a diferentes temperaturas e
fluxos de ar de secagem
RESUMO. Este trabalho foi realizado com o objetivo de avaliar a correlação entre um grupo de variáveis fisiológicas (condutividade elétrica, lixiviação de potássio e porcentagem de germinação) e um grupo de variáveis de cinética de secagem (tempo e taxa de secagem), bem como verificar a relação entre as variáveis de cinética de secagem e a qualidade sensorial do café, em função do tipo de processamento, da temperatura e do fluxo de ar de secagem. A secagem do café foi realizada em secador de leito fixo com duas temperaturas e dois fluxos de ar. Após a secagem, foi avaliada a qualidade fisiológica e sensorial. A partir dos resultados obtidos, conclui-se que: o café processado via seca é mais sensível à secagem mecânica com ar aquecido do que o processado via úmida, apresentando pior desempenho fisiológico; o fluxo de ar não interfere na qualidade fisiológica do café despolpado e natural; a elevação da temperatura de 40 para 45°C resultou em queda da qualidade fisiológica apenas para o café despolpado e a elevação da taxa de secagem, por meio da elevação do fluxo de ar de secagem, para a temperatura de 40°C teve efeito negativo na qualidade sensorial do café despolpado.
Palavras-chave: cinética de secagem, processamento, taxa de secagem.
Introduction
Coffee quality depends on many factors, which range from species choice and crop variety to the method of preparation of coffee for consumption. Among these factors, processing, drying, storage, milling, and transportation are fundamental for obtaining and maintaining a differentiated final product.
Of all the post-harvest stages, drying is the most relevant from an energy consumption and a processing cost formation perspective, as well as
from a quality preservation point of view (Borém, 2008). If the drying is not conducted correctly, it will impair the quality due to undesirable physical, chemical, and sensorial alterations, causing degradation of chemical components that may come in contact with hydrolytic and oxidative enzymes, thereby affecting the characteristic color, flavor, and aroma of the beverage (Borém, 2008; Bytof et al., 2007; Marques, Borém, Pereira, & Biaggioni, 2008).
which is determined by the flavor and aroma that are formed from chemicals components present in the raw beans during roasting (Borém, Coradi, Saath, & Oliveira, 2008a; Farah, Monteiro, Calado, Franca, & Trugo, 2006).
Potassium leaching and electrical conductivity tests have frequently been used in studies as consistent indicators of the integrity of cell membranes (Angélico et al., 2011; Borém, Coradi, Saath, & Oliveira, 2008b; Coradi, Borém, Saath, & Marques, 2007; Isquierdo et al., 2011; Isquierdo, Borém, Oliveira, Siqueira, & Alves, 2012; Marques et al., 2008; Nobre, Borém, Isquierdo, Pereira, & Oliveira, 2011; Reinato, Borém, Cirillo, & Oliveira, 2012; Ribeiro et al., 2011; Saath, Biaggioni, Borém, Broetto, & Fortunato, 2012; Santos, Chalfoun, & Pimenta, 2009). Beans with poorly structured membranes leach a greater quantity of solutes when immersed in water (Prete & Abrahão, 1995). Many studies have demonstrated that beans of lower quality show higher levels of potassium leaching and electrical conductivity (Borém et al., 2008b; Marques et al., 2008; Santos et al., 2009).
Despite the technological evolution of the Brazilian coffee sector in recent years, drying technologies have not evolved sufficiently to contend with the flow of coffee coming from mechanical harvests. Hence, the drying infrastructure is frequently inadequate to receive the volume of coffee picked daily. Given this scenario, the solution used by some coffee growers who dry beans on patios is to spread out the coffee in thicker layers than is recommended. As for mechanical drying, the use of drying temperatures higher than the limit tolerated by coffee has been observed with the objective of accelerating the process and increasing the drying capacity. However, these practices could compromise the quality of the coffee due to fermentation on the patio and thermal damage in the mechanical dryers.
Available coffee drying technologies only allow an increase in the drying rate via an increase in temperature or airflow. Nevertheless, coffee mass temperatures higher than 40°C cause thermal damage that depreciates its quality (Borém et al., 2013; Isquierdo et al., 2013; Oliveira et al., 2013). The use of airflows significantly higher than those commercially used is an alternative for increasing the drying rate without exceeding the maximum temperature threshold tolerated by coffee. However, little is known about the effect of these flows on coffee quality and drying kinetics.
Therefore, the objective of the present study was to evaluate the correlation between a group of physiological variables (electrical conductivity,
potassium leaching, and germination percentage) and a group of drying kinetics variables (drying time and percentage) in addition to verifying the relation between drying kinetics variables and coffee quality as a function of the processing type, temperature, and drying airflow.
Material and methods
Coffee harvesting and processing
Manually harvested ripe coffee fruits (Coffea arabica L. cv. Bourbon Amarelo) were used for this experiment. After harvesting, the fruits were separated in water by density differences, and those with a lower specific mass (dry, underdeveloped, damaged by coffee berry borers, and malformed coffee fruits) were removed. A subsequent manual selection was conducted to remove any remaining immature or overripe fruits. Mature, selected fruits were then divided into two groups: one group was taken directly to the dryers, representing “natural” coffee (dry processing), whereas the other group was pulped and placed in water tanks at room temperature for fermentation for 20 hours. Following fermentation, the coffee was washed in running water until the remaining mucilage was fully removed. The resulting parchment coffee was then taken to the dryer, representing pulped coffee (wet processing). All harvesting and processing procedures were conducted according to Borém (2008).
Drying system
The drying system consisted of three fixed-layer dryers (Figure 1). In these dryers, the drying airflow and the temperature (T) were precisely electronically controlled.
Figure 1. Dryers used for coffee drying.
The drying air speed was monitored using a blade anemometer that was constantly regulated and maintained between 0.4 and 1.6 m s-1, corresponding
to flow rates of 24 and 96 m3 min.-1 m-2, respectively.
These flow rates were chosen based on preliminary tests. An airflow of 24 m3min.-1m-2 is the
rate most commonly used by producers. Preliminary tests showed no differences in drying time for either natural or pulped coffees when flow rates of 96 and 132 m3 min.-1 m-2 were used. Therefore, the lowest
flow that provided the lowest drying time was chosen.
Two air drying temperatures were used (40 and 45°C). These temperatures were monitored through the use of mercury thermometers placed in the coffee mass.
Experimental design
The experimental design was a fully randomized 2 x 2 x 2 factorial scheme using two processing types (natural and pulped), two drying temperatures (40 and 45°C), and two drying airflows (Table 1). Three replicates were conducted for each treatment.
Table 1. Processing type (natural and pulped), temperature, and drying airflow.
Processing Temperature (°C) Flow (m3
min. -1
m-2
)
Natural
40 24
96
45 24
96
Pulped
40 24
96
45 24
96
Description of the drying process
The mean coffee moisture content at the onset of drying was 2.18 kg of water kg-1 of dry matter on
dry base (d.b.) and 0.87 kg of water kg-1 of dry
matter (d.b.) for natural and pulped coffees, respectively. The coffee was dried continuously until it reached 0.145 ± 0.005 (d.b.) in the fruit and 0.125 ± 0.005 (d.b.) in the parchment coffee, which corresponded to a 0.125 ± 0.005 kg kg-1 (d.b.)
moisture content for the milled coffee. The trays holding the samples were removed from the dryer and weighed each hour on an analytical scale with a resolution of 0.01 g until the desired moisture level was reached. Each time the trays were weighed, their positions in the dryers were rotated to minimize possible positional differences in temperature and airflow.
The moisture content of the coffee fruit and parchment coffee, both at the beginning and the end of drying, were determined using the standard oven method of 105 ± 3°C for 24 hours based on the
Regras para Análise de Sementes (Brasil, 2009). The moisture content of the raw coffee beans was determined using the ISO 6673 (2003) standard method. Knowing the initial fruit and parchment coffee mass and the moisture content and using an analytical scale with a resolution of 0.01 g, the drying was monitored using the gravimetric method (mass loss) until the coffee reached the desired moisture content, based on the following equation:
( )
i i t
t
Wm Tm Tm
MC
Mms
(1)
where:
MCt:moisture content at time t (kg of water kg-1
dry matter (d.b.));
Wmi: initial water mass (kg);
Tmi: initial total mass (kg);
Tmt: total mass at time t (kg);
Mms: dry matter mass (kg).
The product drying rate was determined to evaluate the speed of water evaporation based on the following equation:
. MCprev MCcurr
Dry Rate
t
(2)
where:
Dry.Rate: drying rate (g of water kg-1 dry matter
h-1);
MCprev: moisture content at the previous time (g
of water kg-1 dry matter(d.b.));
MCcurr: current moisture content (g of water kg-1
dry matter(d.b.));
∆t: time interval between weights (h).
Sample storage and milling
After drying, the samples were packaged in single layer kraft brown paper bags, which were placed in clear polyethylene plastic bags. The samples were then stored in a climate-controlled room at 10°C and 60% relative humidity for a period of 30 days.
Sensorial analysis
The sensorial analysis was conducted by three SCAA (Specialty Coffee American Association) certified cupping judges.
The SCAA sensorial analysis protocol, based on the specialty coffee sensorial evaluation methodology proposed by Lingle (2011), was used.
Physiological analyses
Germination test
The germination test was conducted with four subsamples of 50 seeds distributed in germination paper that was dampened with a quantity of water equal to two and a half times the mass of the dry substrate and germinated at 30ºC. Evaluations were conducted 30 days after sowing based on the Regras para Análise de Sementes (Brasil, 2009), and the results were expressed as a percentage of seeds sown.
Electrical conductivity
The electrical conductivity of raw beans was determined using the proposed methodology of Krzyzanowski, França Neto, and Henning (1991). Two replicates of 50 beans of each sample were accurately weighed to the nearest 0.001 g and immersed in 75 mL of distilled water in 200 mL plastic cups. These replicates were subsequently placed in BOD refrigerators with forced ventilation and maintained at 25°C for five hours; the electrical conductivity reading of the soaking water was conducted with a BEL W12D conductivity microprocessor. The electrical conductivity was calculated from these readings using equation 3, and the result was expressed in
μS cm-1 g-1 of beans.
Re ( / )
( ) ading S cm EC
Weigh g
(3)
Potassium leaching
The leaching of potassium ions was measured on raw beans using the methodology of Prete and Abrahão (1995). After determining the electrical conductivity, the solutions were analyzed to determine the quantity of potassium that had been leached. This analysis was conducted using a flame photometer (Digimed NK-2002). The quantity of leached potassium was determined using equation 4, and the result was expressed in ppm.
Reading Dilution 1.56 LK
Weigh g
(4)
Statistical analysis
The results of the physiological analyses and coffee drying rates and times were subjected to a canonical correlation analysis using the statistical software R (Team, 2014). The sensorial analysis was related to drying kinetics variables using correlation matrices in R (Team, 2014).
Results and discussion
Table 2 shows the mean time elapsed for the coffee to reach a mid-dry (MD) and a completely dry state, as well as the mean drying rate. The moisture content at the onset of drying, at mid-dry and at the end of drying are also presented as a function of the processing type, temperature, and drying airflow.
The mid-dry state had a moisture content of 0.50 ± 0.005 and 0.33 ± 0.005 kg of water kg-1 dry matter
(d.b.) for natural and pulped coffees, respectively. When completely dry, the moisture content of the natural coffee was 0.145 ± 0.005 kg of water kg-1 dry
matter (d.b.), and the moisture content of the parchment coffee was 0.125 ± 0.005 kg of water kg-1
dry matter (d.b.).
Table 2. Mean time and drying rates for mid-dry (MD) and complete drying (End), and initial moisture content and moisture content at mid-dry and complete drying as a function of processing, (natural and pulped), temperature, and drying airflow.
Processing Temperature
(°C)
Airflow
(m3 min-1 m-2)
Drying time (h) Moisture content
(d.b.)
Drying rate
(g kg-1 h-1)
MD End Initial MD End MD Mean
Natural
40 24 28.25 87.65 2.21 0.50 0.145 72.9 37.3
96 25.55 82.63 2.18 0.50 0.145 79.5 39.3
45 24 20.58 56.18 2.19 0.50 0.145 96.9 46.1
96 16.68 49.81 2.14 0.50 0.145 117.9 51.4
Pulped
40 24 9.46 18.75 0.86 0.33 0.125 56.4 42.4
96 7.09 14.70 0.85 0.33 0.125 73.8 49.8
45 24 5.15 10.60 0.89 0.33 0.125 109.5 72.4
At an airflow of 24 m3min.-1m-2, the increase in
temperature (from 40 to 45°C) resulted in a decreased drying time of 36% (87.65 to 56.18 hours) and 43% (18.75 to 10.60 hours) for the natural and pulped coffees, respectively (Table 2). When the airflow was increased from 24 to 96 m3 min.-1 m-2
during the natural coffee drying, the drying time decreased by 6% (87.65 to 82.63 hours) and 11% (56.18 to 49.81 hours) at 40 and 45°C, respectively. The same increase in airflow for pulped coffee resulted in a decrease of 22% (18.75 to 14.70 hours) and 12% (10.60 to 9.32 hours) at 40 and 45°C, respectively.
The increase in air temperature results in a greater difference between the steam pressure of the drying air and the product, which makes water removal easier and quicker (Siqueira, Resende, & Chaves, 2012). In addition, there are other reported causes for the reduction in drying time associated with a temperature increase. The increase in temperature decreases water viscosity, which directly influences the fluid runoff. The decrease in viscosity facilitates the diffusion of water molecules through the product, in addition to increasing the kinetic energy of the water molecules, which also contributes to an increase in the drying rate (Corrêa, Oliveira, Botelho, Goneli, & Carvalho, 2010).
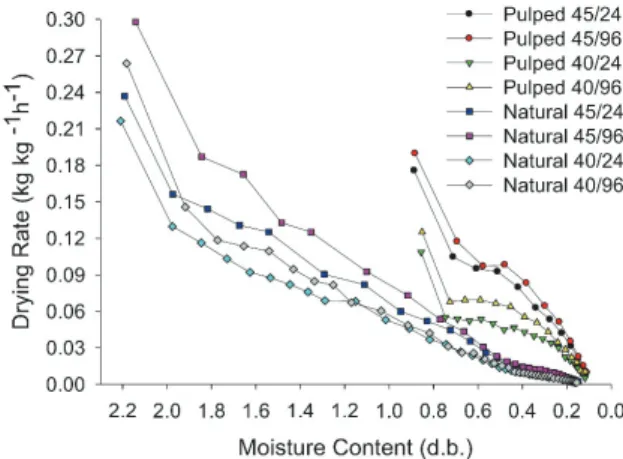
Figure 2 shows the drying rates as a function of the moisture content in the fruits of natural and parchment (pulped) coffees subjected to complete drying in a mechanical dryer.
Figure 2. Drying rate as a function of mean moisture content of the coffee.
For the same moisture content, pulped coffee showed a faster drying rate than natural coffee. Additionally, for a given moisture content and processing type, the higher temperature resulted in a faster drying rate. Faster drying rates were observed at the beginning of drying, and as drying progressed, the differences in drying rates between natural and
parchment coffee decreased considerably. The effect of airflow for the same processing type and temperature was more evident at the beginning of drying. Over the course of the drying process, coffee water removal becomes more difficult due to the strong adsorptive forces between the water and the other constituents of the bean. Thus, the drying rates for the two airflows and the two temperatures tend to converge at the end of the process for the same processing type. These results are consistent with the literature describing the general theory of drying agricultural products (Borém, 2008; Brooke, Bakker-Arkema, & Hall, 1992; Pabis, Jayas, & Cenkowski, 1998; Silva, 2008).
The phenomenon of water migration in the interior of the bean is not entirely understood. Nonetheless, numerous thermal and physical mechanisms have been proposed to describe the transport of water in hygroscopic porous capillary products (Brooke et al., 1992). However, recent theories suggest that at a particular stage of the drying, water movement is largely determined by liquid diffusion (Borém, Marques, & Alves, 2008). Liquid diffusion should be facilitated by both a temperature increase and the removal of physical barriers, as occurs as a result of the coffee pulping process in comparison to the drying of natural coffee. The airflow effect on the drying rate is more evident when the product still has high moisture content, which is also consistent with general drying theory.
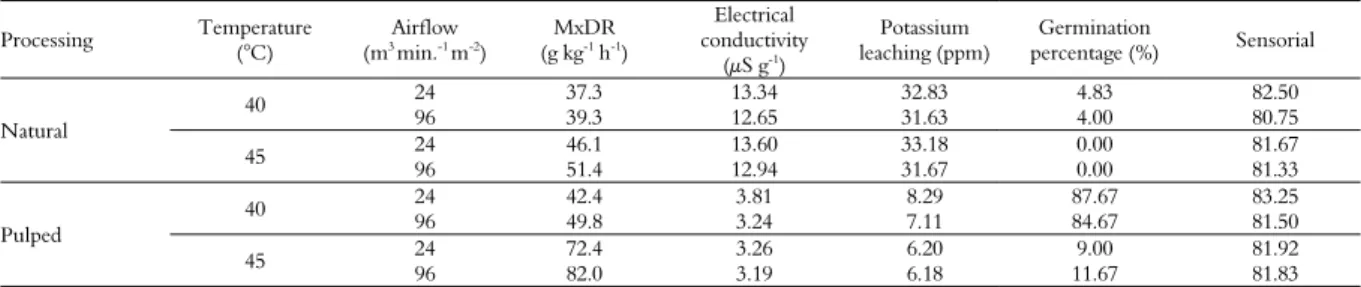
Table 3 shows the mean values for electrical conductivity, potassium leaching, and germination as well as for the sensorial analysis and the mean drying rate as a function of the experimental variables.
The canonical correlation analysis was applied with the objective of finding linear combinations that would preserve the relations between the physiological variables (electrical conductivity, potassium leaching, and germination percentage) and the drying kinetics variables (drying time and rates for mid-dry and complete drying).
The results of the Bartlett test are presented in Table 4 to validate the analysis and to justify the choice of these paired physiological and kinetics variables.
The results (Table 4) show that there is a strong correlation (ρ < 0.05) between the drying kinetics variables and the physiological variables represented by the first pair of canonical variables (U1 and V1)
Table 3. Mean drying rate (MxDR), electrical conductivity, potassium leaching, germination percentage, and sensorial analysis as a function of processing (natural and pulped), temperature, and drying airflow.
Processing Temperature
(°C)
Airflow
(m3
min.-1
m-2
)
MxDR
(g kg-1
h-1
)
Electrical conductivity
(μS g-1)
Potassium leaching (ppm)
Germination
percentage (%) Sensorial
Natural
40 24 37.3 13.34 32.83 4.83 82.50
96 39.3 12.65 31.63 4.00 80.75
45 24 46.1 13.60 33.18 0.00 81.67
96 51.4 12.94 31.67 0.00 81.33
Pulped
40 24 42.4 3.81 8.29 87.67 83.25
96 49.8 3.24 7.11 84.67 81.50
45 24 72.4 3.26 6.20 9.00 81.92
96 82.0 3.19 6.18 11.67 81.83
Table 4. Bartlett test verifying the correlation between the physiological and drying kinetics variables.
Pairs of canonical variables Canonical correlation ρ Chi-square statistics p-value
1 0.9965 65.057 < 2.2.10-16
2 0.9561 17.302 < 2.69.10-9
3 0.4756 - -
1 0.0057 % 0.15741 0.0051
U Germ EC KL (5)
1 0.0336 0.2119 16.841 28.849
V TpT TpMD TxT TxMD (6)
where:
% Germ: germination percentage (%); EC: electrical conductivity (μS g-1);
KL: potassium leaching (ppm); TpT: total drying time (h);
TpMD: drying time to mid-dry (h);
TxT: mean drying rate at the end of drying (g of water kg of dry matter-1 h-1);
TxMD: mean drying rate at mid-dry (g of water kg of dry matter-1 h-1).
The correlation of the original variables in each group with the canonical variables U1 and V1
obtained from equations 5 and 6 are described in Tables 5 and 6.
Table 5. Correlations of physiological variables with canonical variables.
Pairs of canonical variables
Variables U1 U2 U3
%Germ -0.745 -0.666 0.024
EC 0.986 -0.161 0.008
KL 0.983 -0.180 -0.029
% Germ = germination percentage, EC = electrical conductivity, KL = potassium leaching, U1 = first pair of canonical variables, U2 = second pair of canonical variables,
U3 = third pair of canonical variables.
Based on the results presented in Table 5, the first canonical variable (U1) showed a high
correlation with electrical conductivity (EC) and potassium leaching (KL) (0.986 and 0.983, respectively). Therefore, U1 is designated as EC/KL.
In contrast, the variables that were highly correlated with the first canonical variable V1 (Table
6, kinetics variables) were the total drying time (TpT) and the drying time to the mid-dry stage (TpMD) with correlations of 0.894 and 0.891, respectively. The canonical variable V1 was therefore
designated as TpT/TpMD.
Table 6. Correlations of kinetics variables with canonical variables.
Pairs of canonical variables
Variables V1 V2 V3
TpT 0.894 -0.232 -0.268
TpMD 0.891 -0.293 -0.185
TxT -0.493 0.847 0.122
TxMD 0.116 0.841 0.164
TpT = total drying time, TpMD = drying time to mid-dry, TxT = mean drying rate at the end of drying, TxMD = mean drying rate at mid-dry.
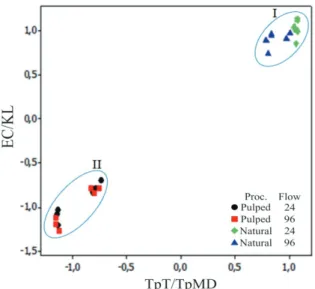
Figures 3 and 4 show the results as a function of processing type, temperature, and drying airflow.
Figure 3 shows that it was possible to discriminate two groups (I and II) as a function of the processing type. Group I comprises the natural coffees and group II comprises the pulped coffees. These groupings reinforce the results presented in Tables 2 and 3, in which natural coffees showed longer drying times, higher electrical conductivity, and greater potassium leaching. Based on these results, it may be concluded that natural coffees are more physiologically sensitive to the effects of drying. One possible explanation for this phenomenon is that coffees that are processed via a dry method (natural) are exposed to drying air for longer periods, which exposes the endosperm and the embryo to more severe thermal damage, contributing to a greater loss of integrity of cell membranes (Saath et al., 2012; Taveira, Rosa, Borém, Giomo, & Saath, 2012).
With regard to the effect of different drying airflows (24 and 96 m3 min.-1 m-2) on the same
Figure 3. Scores of canonical variables identified by processing type and drying airflow.
Figure 4. Scores of canonical variables identified by processing type and drying air temperature.
Figure 4 shows the separation of pulped coffees into two new groups, II and III. This discrimination is due to differential responses of the physiological variables (EC and KL) and the drying times (TpT and TpMD) of pulped coffee when subjected to drying at 40 and 45°C. The clustering with these two groups demonstrates that regardless of the airflow used, pulped coffees that are dried at 45°C
show higher electrical conductivity and potassium leaching combined with a lower drying time compared with pulped coffee that is dried at 40°C (Table 2 and 3).
Therefore, regardless of the airflow, the temperature increase (from 40 to 45°C) reduces the drying time of pulped coffee but has a negative effect on the physiological quality. For natural coffees, it was not possible to identify differences in either the physiological quality (electrical conductivity and potassium leaching) or the drying times (to the mid-dry or completely dry stages) for the temperatures and drying airflows used.
The relation between drying kinetics variables and coffee sensorial quality for the two flows studied (24 and 96 m3 min.-1 m-2) was analyzed via the
estimation of correlation matrix coefficients as a function of processing type (natural and pulped) and drying air temperature (40 and 45°C). The results are shown in Table 7.
Table 7 shows the correlation coefficients that measure the degree of correlation between two variables. These might assume values between -1 and 1. If the coefficient is close to 1, there is a high positive correlation between the two variables; i.e., if one increases the other also increases. If the value is close to zero, it indicates a weak correlation. Nevertheless, if the value is close to -1 it means that the variables have a high negative correlation; i.e., one increases and the other one decreases.
Therefore, no correlations were found between drying kinetics variables and sensorial quality (Table 7) within each air temperature used for drying natural coffee (40 and 45°C); i.e., differences in drying time and drying rate as a function of drying airflow (24 or 96 m3 min.-1 m-2) do not interfere
with the sensorial quality of natural coffee when this coffee is dried at 40 or 45°C. These results are consistent with the results of Isquierdo et al. (2013) in a study on the effect of drying rate as a function of drying air with different relative humidities; that study found that for natural coffees that are dried at 40 and 45°C, the increase in drying rate caused by a reduction in the relative humidity of drying air did not influence the sensorial quality. However, these researchers did not study the effect of drying rate for coffees processed via the wet method.
Table 7. Correlation coefficients between the sensorial analysis and drying kinetics variables (drying times and drying rates at mid-dry and at the end of drying) for 24 and 96 m3min.-1m-2 flows as a function of processing type (natural and pulped) and drying air
temperature.
Processing Temperature
(°C)
Drying time Drying rate
Final Mid-dry Final Mid-dry
Sensorial Analysis
Natural 40 0.278 0.453 -0.412 -0.448
45 0.274 0.263 -0.146 -0.330
Pulped 40 0.834 0.815 -0.835 -0.795
In the present study, the drying rate influenced the sensorial quality of pulped coffees; however, this effect depends on the drying air temperature.
The results for pulped coffees that were dried at 45°C were similar to those observed for natural coffees; i.e., there was no effect of drying rate on the coffee’s sensorial quality. At this temperature, the decrease in quality occurs as a function of thermal damage, which makes the effect of drying rate less evident.
For pulped coffees that were dried at 40°C, a highly positive correlation was found between the drying time and the sensorial score, and a highly negative correlation was found between the drying rate and the sensorial score. Therefore, the increase in the drying airflow from 24 to 96 m3 min.-1 m-2
negatively impacted the sensorial quality of pulped coffees that were dried at 40°C.
Conclusion
Under the conditions that this study was conducted, the following conclusions were drawn:
coffee processed via a dry method is more sensitive to mechanical drying with heated air than coffee processed via a wet method, resulting in poorer physiological performance;
airflow does not interfere with the physiological quality of natural and pulped coffees;
a temperature increase from 40 to 45°C results in a decrease in physiological quality for pulped coffee;
at 40°C, the increase in the drying rate resultin from an increase in the drying airflow has a negative correlation with the sensorial quality of pulped coffee.
References
Angélico, C. L., Pimenta, C. J., Chalfoun, S. M., Chagas, S. J. D. R., Pererira, M. C., & Chalfoun, Y. (2011). Diferentes estágios de maturação e tempo de ensacamento sobre a qualidade do café. Coffee Science,
6(1), 8-19.
Borém, F. M. (2008). Pós-colheita do café. Lavras, MG: UFLA.
Borém, F. M., Coradi, P. C., Saath, R., & Oliveira, J. A. (2008a). Qualidade do café natural e despolpado após secagem em terreiro e com altas temperaturas. Ciência e Agrotecnologia, 32(5), 1609-1615.
Borém, F. M., Coradi, P. C., Saath, R., & Oliveira, J. A. (2008b). Qualidade do café natural e despolpado após secagem em terreiro e com altas temperaturas. Ciência e Agrotecnologia, 32(5), 1609-1615.
Borém, F. M., Marques, E. R., & Alves, E. (2008). Ultrastructural analysis of drying damage in
parchment Arabica coffee endosperm cells. Biosystems Engineering, 99(1), 62-66.
Borém, F. M., Oliveira, P. D. de, Isquierdo, E. P., Giomo, G. da S., Saath, R., & Cardoso, R. A. (2013). Microscopia eletrônica de varredura de grãos de café submetidos a diferentes formas de processamento e secagem. Coffee Science, 8(2), 227-237.
Brasil. Ministério da Agricultura, Pecuária e Abastecimento. (2009). Regras para análise de sementes. Brasília: Mapa/ACS.
Brooke, D. B., Bakker-Arkema, F. W., & Hall, C. W. (1992). Drying and storage of grains and oilseeds. New York, NY: Van Nostrand Reinold.
Bytof, G., Knopp, S.-E., Kramer, D., Breitenstein, B., Bergervoet, J. H. W., Groot, S. P. C., & Selmar, D. (2007). Transient occurrence of seed germination processes during coffee post-harvest treatment. Annals of Botany, 100(1), 61-66.
Coradi, P. C., Borém, F. M., Saath, R., & Marques, E. R. (2007). Efect of drying and storage conditions on the quality of natural and washed coffee. Coffee Science,
2(1), 38-47.
Corrêa, P. C., Oliveira, G. H. H., Botelho, F. M., Goneli, A. L. D., & Carvalho, F. M. (2010). Modelagem matemática e determinação das propriedades termodinâmicas do café (Coffea arabica L.) durante o processo de secagem. Revista Ceres, 57(5), 595-601. Farah, A., Monteiro, M. C., Calado, V., Franca, A. S., &
Trugo, L. C. (2006). Correlation between cup quality and chemical attributes of Brazilian coffee. Food Chemistry, 98(2), 373-380.
ISO 6673. (2003). Green coffee: determination of loss in mass at 105oC. Geneva, GE: International Organization
Standardization.
Isquierdo, E. P., Borém, F. M., Andrade, E. T., Corrêa, J. L. G., Oliveira, P. D., & Alves, G. E. (2013). Drying kinetics and quality of natural coffee. Transactions of the ASABE, 56(3), 1003-1010.
Isquierdo, E. P., Borém, F. M., Cirillo, M. Â., Oliveira, P. D., Cardoso, R. A., & Fortunato, V. A. (2011). Qualidade do café cereja desmucilado submentido ao parcelamento da secagem. Coffee Science, 6(1), 83-90. Isquierdo, E. P., Borém, F. M., Oliveira, P. D., Siqueira,
V. C., & Alves, G. E. (2012). Quality of natural coffee subjected to different rest periods during the drying process. Ciência e Agrotecnologia, 36(4), 439-445. Krzyzanowski, F. C., França Neto, J. B., & Henning, A. A.
(1991). Relato dos testes de vigor disponíveis para as grandes culturas. Informativo ABRATES, 1(2), p. 15-50. Lingle, T. R. (2011). The coffee cupper´s handbook: systematic guide to the sensory evaluation of coffee´s flavor (4th ed.). Long Beach, CA: Specialty Coffee Association of America.
arabica L.) submetido a diferente períodos e temperaturas de secagem. Ciência e Agrotecnologia, 32(5), 1557-1562.
Nobre, G. W., Borém, F. M., Isquierdo, E. P., Pereira, R. G. F. A., & Oliveira, P. D. (2011). Composição química de frutos imaturos de café arábica (Coffea arabica L.) processados por via seca e via úmida. Coffee Science, 6(2), 107-113.
Oliveira, P. D., Borém, F. M., Isquierdo, E. P., Giomo, G. S., Lima, R. R., & Cardoso, R. A. (2013). Aspectos fisiológicos de grãos de café, processados e secados de diferentes métodos, associados à qualidade sensorial.
Coffee Science, 8(2), 211-220.
Pabis, S., Jayas, D. S., & Cenkowski, S. (1998). Grain drying: theory and practice. New York, NY: Jonh Wiley & Sons, Inc.
Prete, C. E. C., & Abrahão, J. T. M. (1995). Condutividade elétrica dos exsudatos de grãos de café (Coffea arabica L.). I. Desenvolvimento da metodologia.
Semina: Ciências Agrárias, 16(1), 17-21.
Reinato, C. H. R., Borém, F. M., Cirillo, M. Â., & Oliveira, E. C. (2012). Qualidade do café secado em terreiros com diferentes pavimentações e espessuras de camada. Coffee Science, 7(3), 223-237.
Ribeiro, F. C., Borém, F. M., Giomo, G. S., De Lima, R. R., Malta, M. R., & Figueiredo, L. P. (2011). Storage of green coffee in hermetic packaging injected with CO2. Journal of Stored Products Research, 47(4), 341-348.
Saath, R., Biaggioni, M. A. M., Borém, F. M., Broetto, F., & Fortunato, V. A. (2012). Alterações na composição química e sensorial de café (Coffea arabica L.) nos
processos pós-colheita. Revista Energia na Agricultura,
27(2), 96-112.
Santos, M. A., Chalfoun, S. M., & Pimenta, J. C. (2009). Influência do processamento por via úmida e tipos de secagem sobre a composição , físico química e química do café (Coffea arabica L.). Ciência e Agrotecnologia, 33(1), 213-218.
Silva, J. S. (2008). Secagem e armazenamento de produtos agrícolas (2nd ed.). Viçosa, MG: Editora Aprenda Fácil. Siqueira, V. C., Resende, O., & Chaves, T. H. (2012).
Drying kinetics of jatropha seeds. Revista Ceres, 59(2), 171-177.
Taveira, J. H. D. S., Rosa, S. D. V. F., Borém, F. M., Giomo, G. S., & Saath, R. (2012). Perfis proteicos e desempenho fisiológico de sementes de café submetidas a diferentes métodos de processamento e secagem. Pesquisa Agropecuária Brasileira, 47(10), 1511-1517.
Team, R. C. (2014). A language and environment for statistical computing. Vienna, Austria: R Foundation for Statistical Computing. Retrieved on June 7, 2014 from http://www.r-project.org/
Received on February 23, 2016. Accepted on May 9, 2016
License information: This is an open-access article distributed under the terms of the Creative Commons Attribution License, which permits unrestricted use, distribution, and reproduction in any medium, provided the original work is properly cited.