Genetic progress and potential of common bean families obtained by
recurrent selection
Anatércia Ferreira Alves1*, José Ângelo Nogueira de Menezes Júnior2, Vanessa Maria Pereira Silva Menezes1, José Eustáquio de Souza Carneiro1, Pedro Crescêncio Souza Carneiro1 and Andrea Ferreira Alves3
Received 28 January 2014 Accepted 12 August 2015
Abstract – The objective of this study was to estimate the genetic gain of two recurrent selection cycles in common bean breeding and identify families with the potential to generate superior lines. The base population, cycle zero (C0), was obtained by combining 20 carioca bean parents, populations with favorable phenotypes for several agronomically important traits. The parents were recombined in a circulant diallel scheme, in which each parent participated in two crosses, generating 20 populations. From these populations, families were derived and evaluated for three seasons in the generations F2:3, F2:4 and F2:5. The same procedures of recombination and evaluation in C0 were performed in cycle one (CI). The genetic gain for yield, estimated from the simultaneous evaluation of the 40 best families of each cycle, was 8.6%. Families with potential to generate superior lines to cultivar Pérola were identified, especially among the CI families.
Key words: Phaseolus vulgaris, genetic gain, common bean breeding.
Crop Breeding and Applied Biotechnology 15: 218-226, 2015 Brazilian Society of Plant Breeding. Printed in Brazil
ARTICLE
http://dx.doi.org/10.1590/1984-70332015v15n4a38
1 Universidade Federal de Viçosa, Departamento de Fitotecnia, Av. P.H. Rolfs, s/n, 36.571-900, Viçosa, MG, Brazil. *E-mail: [email protected] 2 Empresa Brasileira de Pesquisa Agropecuária. Embrapa Agrossilvipastoril, 78.550970, Sinop, MT, Brazil
3 Universidade Federal do Ceará, Departamento de Fitotecnia, Av. Mister Hull, s/n, Campus do Pici, 60.455-900, Fortaleza, CE, Brazil
INTRODUCTION
In Brazil, different types of common bean are grown, and the groups with carioca, black, red, purple, pinkish, and Manteigão grain are the best known. Regionally, the population has a preference for one or the other of these types. However, the common bean type with the greatest acreage and highest consumption in Brazil is the carioca bean (beige with light brown stripes), which is why the main bean breeding programs in Brazil have focused on breeding this grain type.
In breeding programs, several strategies can be applied and produce satisfactory results. Of these, hybridization has become a routine practice in modern breeding programs and the main source of new common bean lines (Couto et al. 2008, Rocha et al. 2012, Menezes Júnior et al. 2013).
The great difficulty in plant breeding is to find two parents
that combine all phenotypes of interest in a single plant. Thus, the alternative would be multiple crosses. However, there are restrictions to the use of this strategy (Carneiro et al. 2002), since the greater the number of parents involved in obtaining the segregating population, the greater is the
number of necessary cycles of crosses, and the greater must be the size of this population.
Therefore, it is not always possible to associate the phenotypes of interest at the desired intensity in a single plant, to solve all problems at once. This shows that breeding should be carried out in stages. In this case, an alternative would be recurrent selection, i.e., successive cycles of selection and intercrossing of the best plants or the best families (Geraldi 1997).
The efficiency of recurrent selection in breeding autogamous plants, especially for common bean, was demonstrated for several traits (Sing et al. 1999, Garcia et al. 2003, Menezes Júnior et al. 2008, Arantes et al. 2010).
Silva et al. (2010) confirmed the efficiency of this strategy
in breeding of common bean with carioca grain. The authors observed an increase in yield and improved grain appearance, with variability in the population, even after eight selection cycles.
terms of the selection unit, the number of parents, the way the intercrosses are preformed, evaluation method of the obtained populations and the method of estimating genetic gain. The periodic estimation of genetic gain is essential for decision-making with regard to selection strategies used
and possible alternatives to increase selection efficiency.
In autogamous plants, the mean of a population derived
from intercrossing will change after each selfing, due to the
presence of dominance. Thus, the procedures commonly used to compare selection cycles are assessments of families or lines of the different cycles, which can be done using standard controls (Arantes et al. 2010) or the simultaneous assessment of the best families or lines of each cycle (Ramalho et al. 2005, Menezes Júnior et al. 2013).
The objectives of this study were to estimate the genetic gain of two recurrent selection cycles in breeding of common bean with carioca grain and identify families with superior capacity to breed superior lines.
MATERIAL AND METHODS
The experiments were conducted at the Experimental Station of Coimbra, of the Department of Plant Science, of the Federal University of Viçosa (UFV), in the municipality of Coimbra (lat 20° 50’ 30” S, long 42° 48’ 30” W and alt 720 m asl), in the dry season and winter of 2007, 2008, 2010, and 2011, and in the rainy season of 2011. Fertilization and
cultivation were carried out as officially recommended for
common bean in the region.
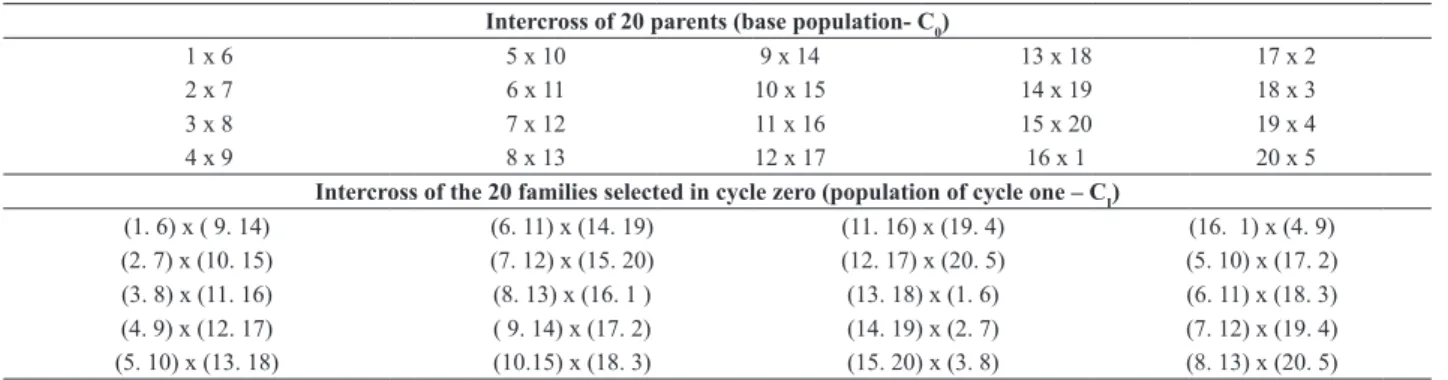
The base population, cycle zero (C0) was obtained by combining 20 parents with carioca grain in a circulant diallel scheme, with each parent participating in two crosses (Table 1). Thus, 20 populations were generated from simple crosses. The population of cycle one (CI) was obtained by recombining the best 20 families of C0 (Table 1) in the same mating scheme, resulting in 20 new populations. From the populations of both cycles, families were derived and
evaluated for three seasons in different generations (F2:3, F2:4 and F2:5).
From each F2 population in C0 and CI, 19 families were derived and evaluated in the winter of 2007 (C0) and winter of 2010 (CI). Each experiment consisted of 400 treatments and 380 F2:3 families and 20 controls, represented by commercial cultivars, elite lines and some of the parents used in the composition of the base population. A lattice square design of 20 x 20, with two replications and plots of two 1-m rows was used. The traits yield and grain appearance, rust severity, and plant architecture were evaluated.
Of the 380 F2:3 families of each cycle, the best 160 were selected, based on yield and grain appearance. In the following generation (F2:4), dry season of 2008 (C0) and dry season of 2011 (CI), the 160 selected families along with nine controls (BRSMG Pioneiro, Ouro Negro, BRSMG Talismã, Pérola, Requinte, BRSMG Majestoso, VC6, BRSMG Madrepérola, and Horizonte) were evaluated in a randomized lattice square (13 x 13) three times, on plots of two 2-m rows. In these seasons, yield and grain appearance, plant architecture and angular leaf spot severity were evaluated. Using the 169 common treatments of the two generations (F2:3 and F2:4), a combined analysis of these generations was carried out for each cycle (C0 and CI). The best 40 families of each cycle were selected and stored in a refrigerator to estimate the genetic gain later.
The severity of rust and angular leaf spot, plant architecture and grain appearance were evaluated on scales. Rust severity was evaluated on a 1-6 scale (Stavely et al. 1983), where 1 indicated no visible pustules (immune) and 6, severe disease symptoms, resulting in premature leaf fall. For angular leaf spot, disease severity was assessed by a 1-9 scale, proposed by Van Schoonhoven and Pastor-Corrales (1987), where grade 1 represented plants without disease symptoms and 9, severe disease symptoms, resulting in premature leaf drop. For plant architecture, we used a 1 - 5
Table 1. Mating scheme to establish cycle zero (C0) and cycle one (CI)
Intercross of 20 parents (base population- C0)
1 x 6 5 x 10 9 x 14 13 x 18 17 x 2
2 x 7 6 x 11 10 x 15 14 x 19 18 x 3
3 x 8 7 x 12 11 x 16 15 x 20 19 x 4
4 x 9 8 x 13 12 x 17 16 x 1 20 x 5
Intercross of the 20 families selected in cycle zero (population of cycle one – CI)
(1. 6) x ( 9. 14) (6. 11) x (14. 19) (11. 16) x (19. 4) (16. 1) x (4. 9)
(2. 7) x (10. 15) (7. 12) x (15. 20) (12. 17) x (20. 5) (5. 10) x (17. 2)
(3. 8) x (11. 16) (8. 13) x (16. 1 ) (13. 18) x (1. 6) (6. 11) x (18. 3)
(4. 9) x (12. 17) ( 9. 14) x (17. 2) (14. 19) x (2. 7) (7. 12) x (19. 4)
scale similar to that proposed by Collicchio et al. (1997), where 1 are completely erect plants and 5, prostrate plants. For grain appearance we also used a 1-5 scale, proposed by Ramalho et al. (1998), where grade 1 is assigned to the typical carioca grain pattern.
In every generation, the data were analyzed separately,
considering the effects of treatments and the mean as fixed,
according to the model Yijl = m + ti + bj + Pl(j) + eijl, where: Yijl is the observed value in the plot under treatment i, l in block l within the replication j; m is the overall mean of the experiment; ti effect of treatment i, where (i = 1,2,..., n); bj effect of replication j, where j = 1 and 2 in F2:3 and j = 1, 2 and 3 in the other generations; Pl(j) the effect of block l within replication j , where l = 1, 2 3,...n; eijl the experimental error associated with observation Yijl, assuming that the errors are independent and normally distributed with zero
mean and variance σ2.
The model adopted in the combined analysis was Yijk = m + ti + bj(k) + ak + (ta)jk + eijk, where: Yij is the observed value in the plot receiving treatment i in replication j in generation k; m is the overall mean of the experiment; ti the effect of treatment i, where (i = 1,2,...,n); bj(k) effect of replication j within generating k, where j = 1, 2 and 3; ak the effect of generation k, where k = 1, 2; (ta)ikthe interaction effect between treatment i and generation k; eijk the mean error associated with observation Yijk, assuming that the errors are independent and normally distributed, with zero
mean and variance σ2.
The genetic gain was estimated by comparing the 40 best families obtained in each cycle (C0 and CI) simultaneously. The experiments were conducted in the winter and rainy season of 2011, in a randomized block design with three replications and plots with two 2–m rows. The same controls were used as in F2:4. The following traits were evaluated in both seasons: grain yield, plant architecture and severity of angular leaf spot and rust, whereas grain appearance was assessed in the winter only. The genetic gain (GG) was estimated from the following expression:
PG (%)(%) 100
0 0
x X
X X
C C CI
−
= ,
where: XC1 is the mean of the 40 families of cycle one (CI) and XC0 is the mean of the 40 families of cycle zero (C0).
RESULTS AND DISCUSSION
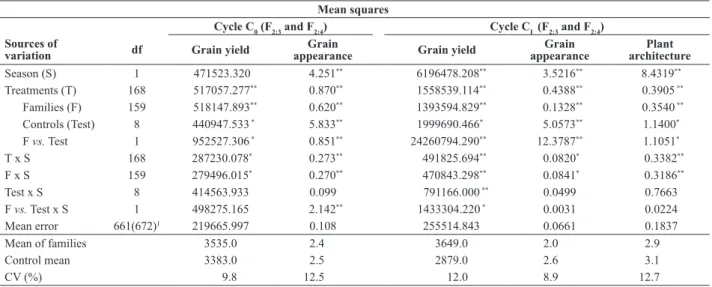
The summary of the combined variance analysis of the assessment of the 160 common families in F2:3 and F2:4 of C0 and CI is represented in Table 2. There was a
significant effect for the family source of variation (F)
in both cycles, indicating variability in the population for grain yield, plant architecture and grain appearance. The family means for yield, grain appearance and plant architecture were higher than those of the controls. The
family x season interaction was significant in both cycles,
indicating inconsistency in family performance in the test
environments. This significant family x season interaction
in common bean was frequently observed elsewhere
Table 2. Summary of the combined analyses of variance of grain yield (kg ha-1) and grain appearance, based on the evaluation of the F
2:3 andF2:4
families of C0, winter 2007 and dry season 2008, and of grain yield (kg ha
-1), grain appearance and plant architecture, based on the evaluation of the
F2:3 andF2:4 families of CI, winter 2010 and dry season 2011
Mean squares
Cycle C0 (F2:3 and F2:4) Cycle CI (F2:3 and F2:4)
Sources of
variation df Grain yield
Grain
appearance Grain yield
Grain appearance
Plant architecture
Season (S) 1 471523.320 4.251** 6196478.208** 3.5216** 8.4319**
Treatments (T) 168 517057.277** 0.870** 1558539.114** 0.4388** 0.3905 **
Families (F) 159 518147.893** 0.620** 1393594.829** 0.1328** 0.3540 **
Controls (Test) 8 440947.533 * 5.833** 1999690.466* 5.0573** 1.1400*
F vs. Test 1 952527.306 * 0.851** 24260794.290** 12.3787** 1.1051*
T x S 168 287230.078* 0.273** 491825.694** 0.0820* 0.3382**
F x S 159 279496.015* 0.270** 470843.298** 0.0841* 0.3186**
Test x S 8 414563.933 0.099 791166.000 ** 0.0499 0.7663
F vs. Test x S 1 498275.165 2.142** 1433304.220 * 0.0031 0.0224
Mean error 661(672)1 219665.997 0.108 255514.843 0.0661 0.1837
Mean of families 3535.0 2.4.... 3649.0 2.0... 2.9...
Control mean 3383.0 2.5.... 2879.0 2.6... 3.1...
CV (%) 9.8 12.5... 12.0 8.9... 12.7...
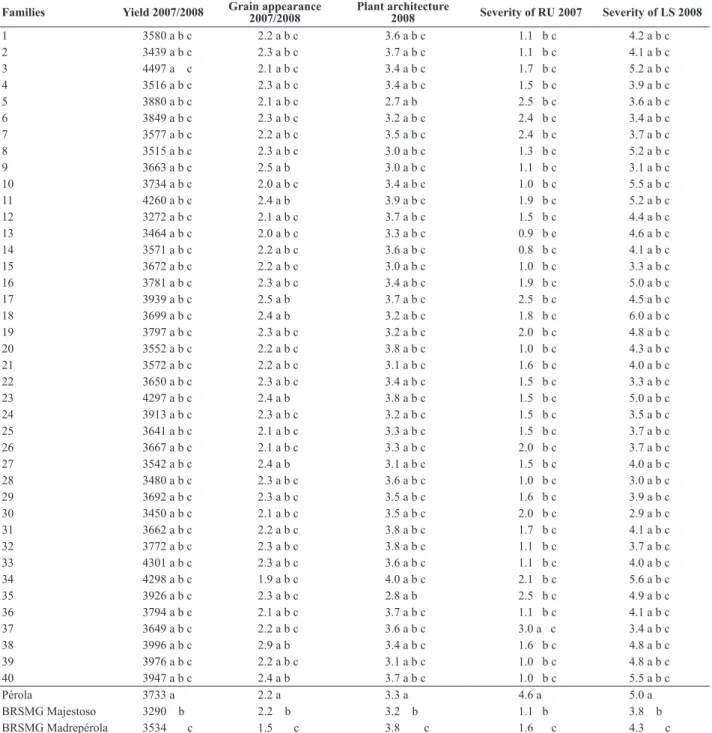
(Arantes et al. 2010, Menezes Júnior et al. 2013). The mean yield, grain appearance, plant architecture, and severity of rust and angular leaf spot of the 40 best families of each cycle, selected based on the results of yield
and grain appearance of the combined analysis of F2:3 and F2:4 generations, are listed in Tables 3 and 4. The C0 families had a similar performance to cultivar Pérola for yield, grain appearance, plant architecture, and angular leaf spot severity.
Table 3. Means of grain yield (kg ha-1), grain appearance, plant architecture and rust severity (RU) and of angular leaf spot (LS) das 40 best families
inC0, evaluated in the generations F2:3 andF2:4, winter 2007 and dry season in 2008
Families Yield 2007/2008 Grain appearance 2007/2008 Plant architecture 2008 Severity of RU 2007 Severity of LS 2008
1 3580 a b c 2.2 a b c 3.6 a b c 1.1 b c 4.2 a b c
2 3439 a b c 2.3 a b c 3.7 a b c 1.1 b c 4.1 a b c
3 4497 a c 2.1 a b c 3.4 a b c 1.7 b c 5.2 a b c
4 3516 a b c 2.3 a b c 3.4 a b c 1.5 b c 3.9 a b c
5 3880 a b c 2.1 a b c 2.7 a b 2.5 b c 3.6 a b c
6 3849 a b c 2.3 a b c 3.2 a b c 2.4 b c 3.4 a b c
7 3577 a b c 2.2 a b c 3.5 a b c 2.4 b c 3.7 a b c
8 3515 a b c 2.3 a b c 3.0 a b c 1.3 b c 5.2 a b c
9 3663 a b c 2.5 a b 3.0 a b c 1.1 b c 3.1 a b c
10 3734 a b c 2.0 a b c 3.4 a b c 1.0 b c 5.5 a b c
11 4260 a b c 2.4 a b 3.9 a b c 1.9 b c 5.2 a b c
12 3272 a b c 2.1 a b c 3.7 a b c 1.5 b c 4.4 a b c
13 3464 a b c 2.0 a b c 3.3 a b c 0.9 b c 4.6 a b c
14 3571 a b c 2.2 a b c 3.6 a b c 0.8 b c 4.1 a b c
15 3672 a b c 2.2 a b c 3.0 a b c 1.0 b c 3.3 a b c
16 3781 a b c 2.3 a b c 3.4 a b c 1.9 b c 5.0 a b c
17 3939 a b c 2.5 a b 3.7 a b c 2.5 b c 4.5 a b c
18 3699 a b c 2.4 a b 3.2 a b c 1.8 b c 6.0 a b c
19 3797 a b c 2.3 a b c 3.2 a b c 2.0 b c 4.8 a b c
20 3552 a b c 2.2 a b c 3.8 a b c 1.0 b c 4.3 a b c
21 3572 a b c 2.2 a b c 3.1 a b c 1.6 b c 4.0 a b c
22 3650 a b c 2.3 a b c 3.4 a b c 1.5 b c 3.3 a b c
23 4297 a b c 2.4 a b 3.8 a b c 1.5 b c 5.0 a b c
24 3913 a b c 2.3 a b c 3.2 a b c 1.5 b c 3.5 a b c
25 3641 a b c 2.1 a b c 3.3 a b c 1.5 b c 3.7 a b c
26 3667 a b c 2.1 a b c 3.3 a b c 2.0 b c 3.7 a b c
27 3542 a b c 2.4 a b 3.1 a b c 1.5 b c 4.0 a b c
28 3480 a b c 2.3 a b c 3.6 a b c 1.0 b c 3.0 a b c
29 3692 a b c 2.3 a b c 3.5 a b c 1.6 b c 3.9 a b c
30 3450 a b c 2.1 a b c 3.5 a b c 2.0 b c 2.9 a b c
31 3662 a b c 2.2 a b c 3.8 a b c 1.7 b c 4.1 a b c
32 3772 a b c 2.3 a b c 3.8 a b c 1.1 b c 3.7 a b c
33 4301 a b c 2.3 a b c 3.6 a b c 1.1 b c 4.0 a b c
34 4298 a b c 1.9 a b c 4.0 a b c 2.1 b c 5.6 a b c
35 3926 a b c 2.3 a b c 2.8 a b 2.5 b c 4.9 a b c
36 3794 a b c 2.1 a b c 3.7 a b c 1.1 b c 4.1 a b c
37 3649 a b c 2.2 a b c 3.6 a b c 3.0 a c 3.4 a b c
38 3996 a b c 2.9 a b 3.4 a b c 1.6 b c 4.8 a b c
39 3976 a b c 2.2 a b c 3.1 a b c 1.0 b c 4.8 a b c
40 3947 a b c 2.4 a b 3.7 a b c 1.0 b c 5.5 a b c
Pérola 3733 a 2.2 a 3.3 a 4.6 a 5.0 a
BRSMG Majestoso 3290 b 2.2 b 3.2 b 1.1 b 3.8 b BRSMG Madrepérola 3534 c 1.5 c 3.8 c 1.6 c 4.3 c
For rust severity, 39 families (97.5%) performed better than cultivar Pérola, indicating a satisfactory resistance level in the population (Table 3).
In CI, nine families exceeded the yield of cultivar
Pérola, and all were similar in grain appearance and plant architecture (Table 4). For rust severity, 20 families (50%) were superior to cultivar Pérola, indicating higher rust incidence in the CI than in the C0 population. However, in general, all families had satisfactory levels of rust resistance.
Table 4. Means of grain yield (kg ha-1), grain appearance, plant architecture and rust severity, of the 40 best families, evaluated in the generations F
2:3
andF2:4 inCI, in the winter of 2010 and 2011
Families Grain yield Grain appearance Plant architecture Rust severity *
1 4810 c 2.3 a b 3.0 a b c 3.1 a b c
2 5050 2.0 a b c 2.9 a b c 2.3 b c
3 4832 c 2.0 a b c 3.1 a b c 2.0 b c
4 4568 c 2.2 a b 3.0 a b c 3.1 a b c
5 4568 c 2.1 a b 3.1 a b c 3.1 a b c
6 4318 a c 1.7 a c 3.0 a b c 0.9 b c
7 4172 a c 1.7 a c 3.4 a b c 4.1 a b c
8 4603 c 2.2 a b 2.7 a b c 1.8 b c
9 4238 a c 2.0 a b c 3.0 a b c 2.8 a b c
10 4595 c 1.8 a c 3.1 a b c 3.1 a b c
11 4206 a c 2.2 a b 2.6 a b c 2.4 b c
12 4303 a c 1.9 a c 2.8 a b c 1.7 b c
13 4290 a c 2.0 a b c 2.9 a b c 1.8 b c
14 4331 a c 2.0 a b c 2.9 a b c 3.0 a b c
15 4452 a c 2.0 a b c 2.9 a b c 4.3 a c
16 4632 c 2.2 a b 3.1 a b c 4.0 a b c
17 4572 c 2.3 a b 3.0 a b c 1.9 b c
18 4024 a b c 2.1 a b 2.7 a b c 3.1 a b c
19 4120 a c 2.1 a b 2.8 a b c 1.4 b c
20 3961 a b c 2.1 a b 2.4 a b c 2.1 b c
21 4119 a c 2.1 a b 2.7 a b c 0.7 b c
22 4377 a c 2.0 a b c 3.0 a b c 1.0 b c
23 3969 a b c 2.0 a b c 2.7 a b c 3.4 a b c
24 3900 a b c 2.2 a b 2.5 a b c 3.4 a b c
25 4118 a b c 1.6 a c 3.3 a b c 2.7 a b c
26 4237 a c 2.1 a b 2.9 a b c 3.5 a b c
27 4032 a b c 2.0 a b c 3.2 a b c 1.7 b c
28 4180 a c 2.0 a b c 3.0 a b c 2.0 b c
29 4185 a c 2.1 a b 3.0 a b c 3.5 a b c
30 3997 a b c 2.2 a b 2.5 a b c 1.3 b c
31 4063 a b c 2.2 a b 2.4 a b c 1.9 b c
32 4046 a b c 1.7 a c 3.4 a b c 4.3 a c
33 4006 a b c 2.0 a b c 2.7 a b c 1.0 b c
34 4116 a b c 1.9 a c 2.9 a b c 4.2 a c
35 4028 a b c 2.2 a b 2.7 a b c 2.2 b c
36 4376 a c 2.1 a b 2.8 a b c 3.2 a b c
37 4145 a c 2.0 a b c 2.3 a b c 4.1 a b c
38 3912 a b c 2.0 a b c 2.7 a b c 2.0 b c
39 3744 a b c 1.9 a c 2.7 a b c 3.6 a b c
40 4021 a b c 2.0 a b c 2.4 a b 0.9 b c
Pérola 3210 a 2.0 a 3.2 a 5.4 a
BRSMG Majestoso 2793 b 2.5 b 3.0 b 1.3 b BRSMG Madrepérola 3666 c 1.5 c 3.7 c 2.9 c
Since the evaluations were carried out in different years, different races of the highly variable pathogen may have occurred (Souza et al. 2005). Cultivar Pérola, the most widely grown in Brazil, is a reference for yield and grain appearance, demonstrating the promising potential of families to breed lines with carioca grain.
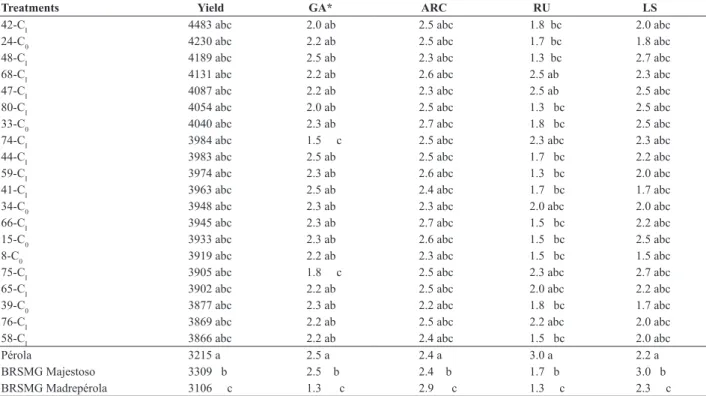
Table 5 is a summary of the combined variance analysis regarding the simultaneous evaluation of the 40 best families of each cycle in the winter and rainy season of
2011. The families differed significantly for all traits. The
C0 families also differed significantly for the characteristics. For the CI families, there was no significant difference in plant architecture and rust severity. The family x season
interaction was significant for severity of angular leaf spot
and rust. For grain yield and plant architecture, the family
x season interaction was not significant, indicating that for
these traits, the performance of the families was consistent in the different environments.
The CI families had higher mean grain yield than the C0
families (Table 5). The significant effect in the comparison
of FC0 with FC1 indicated genetic gain for grain yield. The means of the 20 highest-yielding families of the simultaneous evaluation of C0 and CI cycles, of grain yield, grain appearance, plant architecture and severity of rust and
angular leaf spot are presented in Table 6. The performance of these families was similar to that of the controls Pérola, BRSMG Majestoso and BRSMG Madrepérola in grain yield, plant architecture and resistance to angular leaf spot. In terms of grain appearance, two families were superior to cultivar Pérola, both in CI.
The genetic gain for grain yield was 9% and 8% in the winter and rainy season 2011, respectively (Table 7). In the mean of the two seasons, the genetic gain was 8.6%, which is equivalent to 293 kg ha-1. Genetic gain estimates of recurrent selection in common bean for grain yield from 3.3 to 55% are reported in the literature (Ranalli 1996, Singh et al. 1999, Ramalho et al. 2005, Menezes Júnior et al. 2008, Silva et al. 2010). Ramalho et al. (2005) evaluated the genetic gain in four recurrent selection cycles in breeding of carioca bean in grain yield and appearance. To this end, they evaluated
the five best lines of each cycle in two seasons (winter and
rainy). The yield gains were 7.2% in winter and 4.3% in the rainy season.
In this study, although there were no gains for grain appearance and rust resistance, the grades in all families selected in C0 and CI were less than or equal to 2.5, however promising from the point of view of grain appearance and rust resistance. This indicates that the population has a
Table 5. Summary of the combined analyses of variance of grain yield (kg ha-1), plant architecture and severity of angular leaf spot (LS) and rust (RU),
based on the evaluation of the best F2:6 families of C0 and CI evaluated simultaneously in the winter and rainy seasons of 2011
Mean squares
Source of variation df Grain yield Plant architecture Severity of LS Severity of RU
Harvest (S) 1 315717875.400 ** 4.6817** 883.8371** 128.5468**
Treatments (T) 88 1105559.131** 0.1745* 3.3492** 1.2555**
Families (F) 79 950537.015 ** 0.1542** 3.3163** 1.1768**
Families C0 (FC0) 39 1052000.002 ** 0.2426** 3.8252** 1.4598** Families CI (F CI) 39 608848.790 ** 0.0694 2.6598** 0.9231
FC0 vs. F CI 1 10319321.286 ** 0.0130 9.0750** 0.0333
Control (Test) 8 2175360.106 * 0.2916** 3.6711* 2.0741*
F vs. Test 1 4793878.241 * 0.8408** 3.3684** 0.9238*
T x S 88 427336.000 * 0.1031 1.9015** 0.3764
F x S 79 411476.864 0.0748 1.7594** 0.3071*
FC0 x S 39 411994.613 0.0658 1.7056** 0.3124
FCI x S 39 426098.285 0.0849 1.6837** 0.3204
FC0 vs. FCI x S 1 178950.730 0.0328 6.8125 0.4208
Test x S 8 261383.248 0.2060* 2.5602* 1.1019*
F vs. Test x S 1 62691465.350** 7.7965** 135.2571** 77.4101**
Mean error 352 324249.126 0.0996 0.4262 0.2275
Family mean C0 3404.0 2.5 2.4 1.8
Family mean CI 3697.0 2.5 2.6 1.8
Control mean 3236.0 2.6 2.8 2.0
CV (%) 16.2 12.5 25.9 25.9
satisfactory level of rust resistance associated with good grain appearance; however, it is important to continue assessing the disease severity in future cycles, because the resistance of the population might be broken by new races of the pathogen. The genetic gain for rust resistance in common bean with
recurrent selection was confirmed (Menezes Junior et al. 2013). Therefore, recurrent selection is an efficient breeding
strategy, in case the population resistance is broken, since
new sources of disease resistance can be inserted during the phases of recombination.
For angular leaf spot, the disease severity increased 14.3% more in the CI than the C0 families during the rainy season. Nevertheless, the mean disease severity in the two
cycles allowed the classification as moderately resistant.
It is worth remembering that the higher the severity grade, the more susceptible is the genotype. Arantes et al. (2010)
Table 6. Means of grain yield (kg ha-1) and grain appearance (GA), plant architecture (ARC) and rust severity (RU) and of angular leaf spot (LS) of
the 20 best F2:6 families of C0 and CI, evaluated simultaneously in the winter and rainy seasons of 2011
Treatments Yield GA* ARC RU LS
42-CI 4483 abc 2.0 ab 2.5 abc 1.8 bc 2.0 abc
24-C0 4230 abc 2.2 ab 2.5 abc 1.7 bc 1.8 abc
48-CI 4189 abc 2.5 ab 2.3 abc 1.3 bc 2.7 abc
68-CI 4131 abc 2.2 ab 2.6 abc 2.5 ab 2.3 abc
47-CI 4087 abc 2.2 ab 2.3 abc 2.5 ab 2.5 abc
80-CI 4054 abc 2.0 ab 2.5 abc 1.3 bc 2.5 abc
33-C0 4040 abc 2.3 ab 2.7 abc 1.8 bc 2.5 abc
74-CI 3984 abc 1.5 c 2.5 abc 2.3 abc 2.3 abc
44-CI 3983 abc 2.5 ab 2.5 abc 1.7 bc 2.2 abc
59-CI 3974 abc 2.3 ab 2.6 abc 1.3 bc 2.0 abc
41-CI 3963 abc 2.5 ab 2.4 abc 1.7 bc 1.7 abc
34-C0 3948 abc 2.3 ab 2.3 abc 2.0 abc 2.0 abc
66-CI 3945 abc 2.3 ab 2.7 abc 1.5 bc 2.2 abc
15-C0 3933 abc 2.3 ab 2.6 abc 1.5 bc 2.5 abc
8-C0 3919 abc 2.2 ab 2.3 abc 1.5 bc 1.5 abc
75-CI 3905 abc 1.8 c 2.5 abc 2.3 abc 2.7 abc
65-CI 3902 abc 2.2 ab 2.5 abc 2.0 abc 2.2 abc
39-C0 3877 abc 2.3 ab 2.2 abc 1.8 bc 1.7 abc
76-CI 3869 abc 2.2 ab 2.5 abc 2.2 abc 2.0 abc
58-CI 3866 abc 2.2 ab 2.4 abc 1.5 bc 2.0 abc
Pérola 3215 a 2.5 a 2.4 a 3.0 a 2.2 a
BRSMG Majestoso 3309 b 2.5 b 2.4 b 1.7 b 3.0 b BRSMG Madrepérola 3106 c 1.3 c 2.9 c 1.3 c 2.3 c
* Means based on only one season (winter 2011). Means followed by the letters a. b and c in a column did not differ, respectively, from the controls Pérola. BRSMG Majes-toso. and BRSMG Madrepérola, by the Dunnett test at 5% probability.
Table 7. Means of grain yield (kg/ha). plant architecture. grain appearance and rust severity (RU) and of angular leaf spot (LS). in the
simultane-ous evaluation of the families in C0 and CI and estimates of genetic gain (GG). based on the separate analyses (winter and rainy seasons 2011) and combined analysis
Grain yield Plant architecture Grain appearance Severity of RU Severity of LS
Winter season 2011
C0 4157 2.4 2.2 2.3 1.3
CI 4532 2.4 2.2 2.3 1.3
GG(%) 9.0 0 0 0 0
Rainy season 2011
C0 2651 2.6 - 1.3 3.5
CI 2862 2.6 - 1.3 4.0
GG(%) 8.0 0 - 0 14.3
Combined
C0 3404 2.5 - 1.8 2.4
CI 3697 2.5 - 1.8 2.6
evaluated the genetic gain for resistance to angular leaf spot in common bean and found indirect gain for grain yield and grain type after eight selection cycles (2.3% for yield and 2.5% for grain appearance).
In view of the absence of gain for resistance to angular leaf spot, some alternatives are possible for the following selection cycle. One possibility is to increase the selection pressure for disease resistance or another to include new lines as resistance source in the recombination phase, to increase the population variability. The possibility of introducing new parents during the recombination phases is one of the advantages of recurrent selection (Geraldi 1997, Ramalho et al. 2001), making the process much more dynamic. This strategy was successfully applied (Ramalho et al. 2005, Menezes Júnior et al. 2013).
Genetic gain in common bean breeding for disease resistance was also reported in some studies (Parrella et al. 2008, Arantes et al. 2010). Parrela et al. (2008) were successful in breeding families that combine anthracnose resistance, high yield, erect plants and good bean appearance.
Considering the four families with pyramided resistance to anthracnose, the indirect gains for yield, plant architecture and grain appearance were, respectively, 3.33%, 4.14% and 0.31%.
Recurrent selection was efficient in carioca bean breeding,
since a genetic gain in grain yield of 8.6% was observed after two selection cycles. In addition, families with the potential to generate superior lines to Pérola, BRSMG
Majestoso and BRSMG Madrepérola were identified. The
presence of variability in the population, for all traits, shows the possibility of successful selection in the subsequent cycles and that the program of recurrent selection ought to be continued.
ACKNOWLEDGEMENTS
The authors thank the Brazilian Council for Scientific
and Technological Development (CNPq), Coordination for the Improvement of Higher Education Personnel (CAPES) and Fundação de Amparo à Pesquisa do Estado de Minas Gerais – FAPEMIG for the support of this research
REFERENCES
Arantes LO, Abreu AFB and Ramalho MAP (2010) Eight cycles of recurrent selection for resistance to angular leaf spot in common bean.
Crop Breeding and Applied Biotechnology 10: 232-237.
Carneiro JES, Ramalho MAP, Abreu AFB and Gonçalves FMA (2002) Breeding potential of single, double and multiple crosses in common bean. Crop Breeding and Applied Biotechnology 2: 515-524.
Collicchio E, Ramalho MAP and Abreu AFB (1997) Associação entre o porte da planta do feijoeiro e o tamanho dos grãos. Pesquisa
Agropecuária Brasileira 32: 297-304.
Couto MA, Santos JB and Ferreira JL (2008) Melhoramento do feijoeiro comum com grão tipo carioca, visando resistência à antracnose e à mancha-angular. Ciência e Agrotecnologia 32: 1643-1648.
Cruz CD (2013) GENES - a software package for analysis in experimental
statistics and quantitative genetics. Acta Scientiarum35: 271-276.
Garcia RE, Robinson RA, Aguilar JAP, Sandoval SS and Guzman RP (2003) Recurrent selection for quantitative resistance to soil borne diseases in beans in the Mixteca region, México. Euphytica 130: 241-247.
Geraldi IO (1997) Selección recurrente en el mejoramiento de plantas. In Guimarães EP (ed) Selección recurrente en arroz. CIAT, Cali, p. 3-11.
Menezes Júnior JAN, Ramalho MAP and Abreu AFB (2008) Seleção recorrente para três caracteres do feijoeiro. Bragantia 67: 833-838.
Menezes Júnior JAN, Rezende Júnior LS, Rocha GS, Silva VMP, Pereira, AC, Carneiro PCS, Peternelli LA and Carneiro JES (2013) Two cycles of recurrent selection in red bean breeding. Crop Breeding
and Applied Biotechnology 13: 41-48.
Progresso genético e potencial de famílias de feijão carioca obtidas por meio de
seleção recorrente
Resumo – O objetivo deste trabalho foi estimar o progresso genético de dois ciclos de seleção recorrente no melhoramento de feijão carioca e identificar famílias com potencial para gerar linhagens superiores. A população base, ciclo zero (C0), foi obtida pela com-binação de 20 genitores de grãos tipo carioca, portadores de fenótipos favoráveis para vários caracteres de interesse agronômico. Os genitores foram recombinados em esquema de dialelo circulante, com cada genitor participando de dois cruzamentos, gerando 20 populações. Dessas populações, foram derivadas as famílias e avaliadas por três safras, nas gerações F2:3, F2:4 e F2:5. Os mesmos procedimentos de recombinação e avaliação do C0 foram realizados no ciclo um (CI). O progresso genético para produtividade, estimado com base na avaliação simultânea das 40 melhores famílias de cada ciclo, foi de 8,6%. Foram identificadas famílias com potencial para gerar linhagens superiores à cultivar Pérola, especialmente entre as famílias do CI.
Parrela NNLD, Santos JB and Parrella RAC (2008) Seleção de famílias com resistência à antracnose, produtividade e tipo de grão carioca.
Ciência e agrotecnologia 32: 1503-1509.
Ramalho MAP, Pirola LH and Abreu AFB (1998) Alternativas na seleção de plantas de feijoeiro com porte ereto e grão tipo carioca. Pesquisa
Agropecuária Brasileira 33: 1989-1994.
Ramalho MAP, Abreu AFB and Santos JB (2001) Melhoramento de espécies autógamas. In Nass L L, Valois ACC, Melo IS and Valadares-Inglis M C (eds) Recursos genéticos e melhoramento de plantas. Fundação MT, Rondonópolis, p. 201-230.
Ramalho MAP, Abreu AFB and Santos JB (2005) Genetic progress after four cycles of recurrent selection for yield and grain traits in common bean. Euphytica 144: 23-29.
Ranalli P (1996) Phenotypic recurrent selection in common bean (Phaseolus vulgaris L.) based on performance of S2 progenies.
Euphytica 87: 127-132.
Rocha GS, Pereira LPL, Carneiro, PCS, Paula Júnior, TJ and Carneiro
JES (2012) Common bean breeding for resistance to anthracnose and angular leaf spot assisted by SCAR molecular markers. Crop
Breeding and Applied Biotechnology 12: 34-42.
Silva GS, Ramalho MAP, Abreu AFB and Nunes JAR (2010) Estimation of genetic progress after eight cycles of recurrent selection for common bean yield. Crop Breeding and Applied Biotecnology 10: 351-356.
Singh SP, Terán H, Muñoz CG and Takegami JC (1999) Two cycles of recurrent selection for seed yield in common bean. Crop Science 39: 391-397.
Souza TLO, Alzate-Marin AL, Moreira MA and Barros EG (2005) Análise comparativa da variabilidade patogênica de Uromyces appendiculatus em algumas regiões brasileiras. Fitopatologia Brasileira 30: 143-149.
Stavely JR, Freytag GF, Steadman JR and Schwartz HF (1983) The Bean rust workshop. Anual Report of the Bean Improvement
Cooperative 26: 4-6.
Van Schoonhoven A and Pastor-Corrales MA (1987) Standard system