2018 | Lavras | Editora UFLA | www.editora.ufla.br | www.scielo.br/cagro
All the contents of this journal, except where otherwise noted, is licensed under a Creative Commons Attribution License attribuition-type BY. http://dx.doi.org/10.1590/1413-70542018422016817
Genetic progress in popcorn recurrent selection by
a multivariate mixed-model approach
Progresso genético na seleção recorrente em milho pipoca via abordagem de modelos mistos multivariado
Hugo Junqueira Ematné1*, José Airton Rodrigues Nunes1, João Cândido de Souza1, Patrício Ricardo Muñoz2
1Universidade Federal de Lavras/UFLA, Departamento de Biologia/DBI, Lavras, MG, Brasil 2University of Florida, Horticultural Science Department, Gainesville, Florida, USA *Corresponding author: [email protected]
Received in June 18, 2017 and approved in January 31, 2018
ABSTRACT
Recurrent selection is a viable alternative for popcorn breeding. However, frequent verification of progress attained is required. The aim of this study was to estimate the genetic progress attained for popping expansion (PE) and grain yield (GY) after four cycles of recurrent selection and to compare this progress with the expected progress estimated at the end of each cycle while considering the genetic relationships between the progenies via univariate and multivariate mixed-model approaches. To estimate the genetic parameters and gains from indirect selection, cycles 1, 2, 3, and 4 of a UFLA population were used. To estimate the genetic gains achieved, the following cycles were used: UFLA (original) and cycles 0, 1, 2, 3, and 4, evaluated in three environments. The multivariate approach provided more accurate estimates than did the univariate approach. There was genetic gain for PE in the recurrent selection program. In contrast, gain was not observed for GY using the different estimation strategies.
Index terms: Plant breeding; grain yield; popping expansion.
RESUMO
A seleção recorrente é uma alternativa viável para o melhoramento da cultura do milho pipoca, todavia faz-se necessário verificar frequentemente o progresso obtido. O objetivo do presente trabalho foi estimar o progresso genético realizado para capacidade de expansão (PE) e rendimento de grãos (GY) após quatro ciclos de seleção recorrente e comparar com o progresso esperado, estimado ao final de cada ciclo, levando em consideração o relacionamento genético entre as progênies, via abordagem de modelos mistos univariada e multivariada. Na estimação dos parâmetros genéticos e ganhos com a seleção por via indireta, utilizou-se os ciclos 1, 2, 3 e 4 da população UFLA. Na estimação dos ganhos realizados, foram usados os seguintes ciclos: UFLA (original), e os ciclos 0, 1, 2, 3 e 4, avaliados em três ambientes. A abordagem multivariada proporcionou estimativas mais acuradas em relação à univariada. Houve ganho genético para PE no programa de seleção recorrente. Contrariamente, não foi observado ganho para GY usando as diferentes estratégias de estimação.
Termos para indexação: Melhoramento de plantas; rendimento de grão; capacidade de expansão.
INTRODUCTION
In popcorn breeding, two traits are extremely important: grain yield (GY) and popping expansion (PE). Due to the complex genetic architecture of these traits and
combined with the considerable influence of environmental factors, the use of recurrent selection has proven to be an effective strategy for improving populations and leads to a relatively high chance of selecting genotypically superior individuals (Freitas et al., 2013; Rodovalho et al., 2014;
Freitas et al., 2014; Pena et al., 2016).
The popcorn breeding program has been conducted
by Universidade Federal de Lavras (UFLA) since 2006 based on a local population (UFLA population). This
population is characterized as segregating for grain type
and is broadly adapted to local growing conditions;
however, this population presents low PE values. As a
strategy, the breeding program has used intra-population recurrent selection (IRS), prioritizing the PE trait during
the first selections and considering GY during the second cycle via tandem selection. In an IRS program, the goal is to increase the mean value per se over the selection cycles
via the generation of a promising recombination of genes related to the target traits of the breeding activity. Since this strategy involves a long-term breeding program, it is
necessary to periodically measure the genetic progress
obtained to evaluate the efficiency of the techniques
Ciência e Agrotecnologia, 42(2):159-167, Mar/Apr. 2018
In relation to genetic progress, we must distinguish
between expected progress based on the coefficient of
heritability and on the selection differential in contrast with the progress obtained in relation to the genetic
gain achieved, after having passed through the recurrent selection cycles (Falconer; Mackay, 1996). Traditionally, estimates of these genetic parameters have been obtained using a fixed-model approach via the least squares method (LSM). This approach continues to offer great assistance
to breeding programs, especially in annual crops, owing to the less imbalance of phenotypic data (Piepho et al.,
2008). However, when there is an extensive imbalance
in the data and/or complex pedigree information among
genotypes, the LSM presents some limitations. In these
cases, the use of a more robust procedure is needed, such as a mixed-model approach (Resende, 2007).
The REML/BLUP (restricted maximum likelihood/ best linear unbiased predictor) procedure can adequately
address unbalanced data and includes information on genetic relationships within a model, leading to more
accurate estimates and predictions (Henderson, 1974). Another important question is whether to carry out
selection considering two or more traits simultaneously. In
this case, the univariate REML/BLUP procedure does not
allow exploitation of genetic and phenotypic correlations that may exist and may generate bias in the estimates.
To solve this problem, Henderson and Quaas (1976) introduced a multivariate mixed-model analysis, which
has been used for some time in animal breeding (Meyer;
Thompson, 1986; Waldman; Ericsson, 2006). However,
in annual crops such as maize, studies using this approach are still rare (Kurosawa et al., 2017; Balestre et al., 2012; Viana et al., 2010; Piepho et al., 2008).
The aim of this study was to estimate the genetic progress undertaken for PE and GY after four recurrent selection cycles and to compare the progress with the gain expected from selection at the end of each cycle, taking the genetic relationship between the progenies into consideration
via univariate and multivariate mixed-model approaches.
MATERIAL AND METHODS
Description of the recurrent selection program
The popcorn breeding program began in the
2005/2006 cropping season with the multiplication of the UFLA population and subsequent selection of 400 plants to obtain the UFLA population (base population). With
this population, recurrent breeding procedures began with selection and recombination, producing cycles 0_1, 1, 2,
3, and 4 as described below.
The UFLA 0_1 cycle consisted of 40 half-sib progenies obtained by evaluation for the PE trait among the 400 half-sib progenies of the UFLA 0 population and by selection of the 40 best ones. The UFLA 1 (cycle 1) cycle consisted of 536 half-sib progenies obtained from the recombination of the 40 best half-sib progenies for the PE trait of the UFLA 0_1 population, and the UFLA 2 (cycle 2) cycle consisted of 394 half-sib progenies obtained from the recombination of the 42 best half-sib progenies for the PE trait of the UFLA 1 population. The UFLA 3 (cycle 3) cycle consisted of 560 half-sib progenies obtained from the recombination of the 42 best half-sib progenies for the PE and GY traits of the UFLA 2 population, and the UFLA 4 (cycle 4) consisted of 650 half-sib progenies obtained from the recombination of the 24 best half-sib progenies for the PE and GY traits of the UFLA 3 population. At the end of each recombination cycle, equal seed samples of all the plants were taken and stored to represent their respective cycles.
The progenies selected at the end of the evaluations within a cycle were recombined according to the modified
Irish method (establishing the recombination lot in a completely randomized block design with three replications)
to obtain the next generation. All the evaluations for PE and
GY were carried out for all the plants of the recombination
lot, respecting their respective progenies. The recombination lots were established on the UFLA experimental farm in the
municipality of Ijaci, MG, during the 2007/2008, 2008/2009 and 2009/2010 cropping seasons.
Estimation of the indirect progress of recurrent selection by the uni- and multivariate mixed-models approaches
In the present study, UFLA 1, UFLA 2, UFLA 3, and UFLA 4 populations were used. The traits evaluated were PE and GY. The PE values were obtained by the ratio between the volume of expanded popcorn and the weight
of the grains (ml g-1). For each progeny, a ten-gram grain sample was evaluated in an 800 W microwave oven for 150 seconds, according to the modified method described
by Matta and Viana (2003). The expanded popcorn was measured in a 1000 ml graduated cylinder. The GY trait
was obtained individually by weighing a certain volume of
grain per plant on a precision scale. Recombination among
selected progenies was performed in the field (isolated in time) according to the modified Irish method at the UFLA
experimental farm in the municipality of Ijaci, MG. The
recombination involved a randomized block design (RBD)
REML/BLUP analyses:
The individual model adopted for the univariate
analysis was similar to that presented by Mrode and
Thompson (2005) and is given in Equation 1 as:
2
1 12
2
12 2
G a a
a a
A
,
σ
e12 is the additivecovariance between traits 1 and 2,σ
e12 is the residual covariance between traits 1 and 2, and ⊗ is the Kronecker product.
The individual univariate and multivariate models involving all the generations (combined analysis) were given by the models described in Equations 1 and 5, respectively. However, in this case, the
β
vector refers to the fixed effects of the blocks added to the overall mean and of the environment/cycle effects.The REML method was applied to estimate the covariance components and their significance was verified by REML-likelihood ratio test (REML-LRT) at the 5% probability level. The heritabilities at the individual level were obtained by Equation 6 and their
standard errors were obtained according to Gilmour et al. (2009).
,
yXZae (1)
where y is the vector of the individual phenotypic data; β is the
vector of the fixed effects of the blocks added to the overall mean value; a is the vector of the individual additive genetic effects (a ~ NMV (0, G), with G = Aa2); X and Z are the incidence matrices of the fixed and random effects, respectively; and e is the residual vector (e ~ NMV (0, R), with R = I 2
e ).
For the previously described mixed model (Equation 1), “A” refers to the matrix of the additive
genetic relationship (the kinship coefficients were
computed as two times the Malecot’s coefficient), 0 refers to the null vector, I refers to the identity matrix, 2
a
is theadditive variance, and 2 e
is the residual variance.The matrices of the system of Henderson’s
mixed model equations can be given in Equation 2 as
(Mrode;Thompson, 2005):
1
1 1 1
1 1 1 1
' '
. '
ˆ
ˆ
X R X X R Z X R y
Z R X Z R Z G Z R y
a
(2)
The individual multivariate model adopted was
similar to that presented by Mrode and Thompson (2005, p.
85), which can be given as follow for traits 1 (grain yield) and 2 (popping expansion) in Equations 3 and 4, respectively:
1 1 1 1 1 1,
y X Z a e
2 2 2 2 2 2.
y X Z a e
(3)
(4)
In matrix terms, models showed in Equations 3 and 4 can be expanded to Equation 5:
1 1 1 1 1 1
2 2 2 2 2 2
0 0
.
0 0
y X Z a e
y X Z a e
The matrices of the system of multivariate mixed model equations are similar to the univariate approach (Equation 2);
1 2 ˆ ˆ ˆ
, 1
2
ˆ
ˆ
ˆ
a
a
a
, 2 1 12 2 12 2 e e e eR I
, (5) 2 2 2 2 .ˆ ˆ ˆ a a e h
2 ˆ 1 aa a PEV r (6)The predictive accuracy was obtained by Equation 7,
as follows:
(7)
where PEV is the prediction error variance (Mrode;
Thompson, 2005).
The expected genetic gains were obtained from
BLUP values associated with genetic effects by generation
and all generations for PE and GY using the two
approaches (the uni- and multivariate ones).
All analyses were performed using the software ASReml 3.0 (Gilmour; Gogel; Cullis, 2009).
Estimation of the genetic progress of recurrent selection by the least squares method
The populations UFLA 0, UFLA 0_1, UFLA 1, UFLA 2, UFLA 3, and UFLA 4 as well as two commercial controls (IAC 112 and IAC 125) were used to conduct this experiment. These cycles, represented by an equal mixture of seeds from all the plants, were evaluated in three environments: Environment 1, the UFLA experimental
farm in the municipality of Ijaci, MG, in the 2010/2011
Ciência e Agrotecnologia, 42(2):159-167, Mar/Apr. 2018
of Lavras, MG, in the 2010/2011 cropping season; and Environment 3, the experimental field of the Department of Biology of the UFLA in the municipality of Lavras,
MG, in the 2008/2009 cropping season.
In all the environments, a randomized block experimental design was used consisting of 7, 4, and 11 replications in environments 1, 2, and 3, respectively. The plots consisted of two 3-m rows at a spacing of 0.6 m, with five plants m-1. The traits evaluated per plot in the three environments were as follows: GY (in tons per hectare),
which was obtained from grain weight per plot followed
by subsequent transformation to tons per hectare and corrected both for ideal stand per plot by the covariance method (Vencovsky; Cruz, 1991) and for a standard
moisture of 13%; PE (in ml g-1), which was obtained by the ratio between the volume of expanded popcorn and grain
weight. In each plot, three samples of 30 g of grain were
evaluated in an 800 W microwave oven for three minutes (180 seconds) according to the modified model described
by Matta and Viana (2001). The PE was measured in a 1000 ml graduated cylinder.
For the traits evaluated, the basic assumptions for carrying out the analysis of variance (ANOVA) were first verified. Upon meeting these requirements, individual ANOVAs were carried out with additional controls, considering the mean value per plot (Cruz, 2006; Ramalho; Ferreira; Oliveira, 2005). To carry out combined ANOVAs with additional controls, each trait was examined by the Hartley test to verify if the residual mean squares over the environments were homogeneous (Cruz, 2006; Ramalho; Ferreira; Oliveira, 2005). For the estimation of genetic gain
attained in the selection cycles, we used the estimates of the population mean in each cycle for the PE and
GY traits and applied the least squares method. For carrying out the analyses, SAS® (SAS Institute, 2002) statistical software was used.
RESULTS AND DISCUSSION
Estimate of genetic parameters and progress per selection cycle
In the cycles evaluated (Tables 1 and 2), genetic variability (P<0.05) is observed from the results of the uni- and multivariate approaches. This variability is
indispensable for the success of a recurrent selection
program as generations advance.
The estimates of the additive genetic ( 2 a ) and residual ( 2
e
) variances between the univariate and
multivariate analyses were similar (Tables 1 and 2); the multivariate approach was slightly superior than the univariate approach (greater estimates of 2
a
and lower 2 e ), except for PE in cycle 3.
Experimental precision was verified by the estimates of the predictive accuracy, which allows us
to compare the approaches to identify which approach
provides more accurate estimates. The multivariate
approach in general exhibited greater precision (greater
predictive accuracy) in all the cycles, except for PE during cycle 3 and in the combined analysis. However,
this lower precision in the combined analysis is due to the
four cycles considered in the univariate analysis (C1, C2, C3, and C4), whereas multivariate analysis considers only three (C2, C3, and C4), which are the cycles in which PE and GY are evaluated (Tables 1 and 2). When we analyze only the three cycles (C2, C3, and C4) by the univariate
approach, which is the more correct comparison, the
results of the multivariate analysis were 1% better (data not shown). The multivariate analysis revealed estimates of predictive accuracy that were 58% and 1.5% better than those from the univariate analysis during cycle 2 for PE and GY, respectively; 26.6% better estimates during cycle 3 for GY, 7% and 4.5% better estimates during cycle 4 for PE and GY, respectively; and 18.3% better means
of the cycles for GY (combined analysis), indicating
that, in these cases, the multivariate analysis surpassed the univariate analysis, despite being penalized by one
less cycle. The estimates of heritabilities between the two analyses were similar, with distortion only in cycle 3 for
PE, in which the univariate analysis proved to be more advantageous. The estimates of heritability for PE were
of medium to high magnitude, oscillating from 0.25 to
0.82 from the univariate approach and from 0.26 to 0.62 from the multivariate approach. For GY, the estimates
were of low to medium magnitude, ranging from 0.19 to
0.42 and 0.19 to 0.43 from the univariate and multivariate approaches, respectively.
As the selections made at the beginning of the
program prioritized the PE trait apart from the GY trait, gains for the two traits simultaneously will depend on
the genetic relationship between them. Consequently,
the estimates of genetic correlation (rg) will show how related the traits are. The estimates of rg were obtained
by the multivariate approach (Table 2), which indicated a negative association only during cycle 4. The overall
mean of the cycles (combined analysis), which corrects the effects of the cycle and enables a mean estimate of the genetic correlation to be obtained, was rg= 0.11; as such,
163
Ciência e Agrotecnologia, 42(2):159-167, Mar/Apr. 2018
UFLA C2 UFLA C3 UFLA C4 All cycles
Parameters PE GY PE GY PE GY PE GY
Additive genetic variance 6.46* 320.53* 46.42* 76.35* 10.02* 172.04* 21.60* 182.18* Residual variance 18.51 430.12 28.52 312.98 29.44 244.23 27.35 303.54
Heritability 0.26±0.15 0.43±0.17 0.62±0.17 0.19±0.14 0.25±0.12 0.41±0.15 0.44±0.08 0.37±0.07
Accuracy 0.87 0.68 0.79 0.633 0.61 0.711 0.63 0.71
Genetic correlation 0.05 0.29 -0.336 0.11
Residual correlation 0.37 0.20 0.295 0.15
Mean 22.49(0.48) 73.60(3.01) 25.20(1.07) 59.18(2.53) 24.47(0.54) 57.37(2.01) - -Mean (adj) 21.66(1.11) 71.14(3.36) 23.25(0.88) 56.23(2.73) 21.22(0.86) 53.75(2.65) - -Table 2: Estimates of genetic parameters for the traits of popping expansion (PE) and grain yield (GY) in the UFLA population during cycles 2, 3, and 4 by a multivariate approach (including the kinship information).
* Significant and ns not significant by the REML-LRT test, with a distribution of
20.05;1 3.84
x .
Table 1: Estimates of genetic parameters for the traits of popping expansion (PE) and grain yield (GY) in the UFLA population during cycles 1, 2, 3, and 4 by a univariate approach (including kinship information).
* Significant and ns not significant by the REML-LRT test, with a distribution of
20.05;1 3.84
x .
UFLA C1 UFLA C2 UFLA C3 UFLA C4 All cycles
Parameters PE GY PE GY PE GY PE GY PE GY
Additive genetic
variance 12.18* - 6.35* 317.2* 64.57* 74.76* 9.90* 170.95* 20.27* 181.05* Residual variance 14.53 - 18.61 432.97 13.32 314.20 29.54 245.11 23.42 308.51
Heritability 0.45±0.16 - 0.25±0.15 0.42±0.17 0.82±0.21 0.19±0.14 0.25±0.11 0.41±0.15 0.46±0.07 0.37±0.07 Accuracy 0.70 - 0.55 0.67 0.89 0.50 0.57 0.68 0.72 0.60
-Ciência e Agrotecnologia, 42(2):159-167, Mar/Apr. 2018
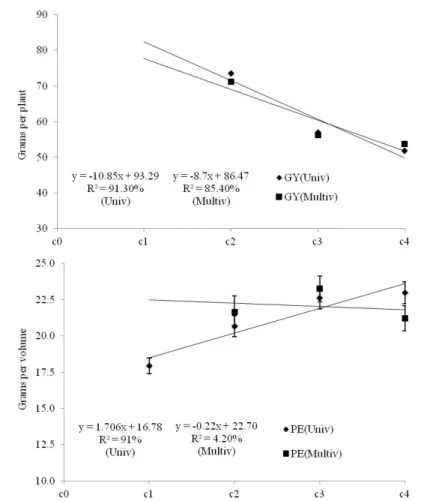
The gains estimated from selection were obtained using regression analysis, with the phenotypic mean
values adjusted per cycle in the combined analysis for both approaches. From the univariate approach, the gains were 2.3%7 and -3.7% for PE and GY, respectively, per selection cycle, and from the multivariate approach, the gains were -0.33% and -3.74% for PE and GY, respectively.
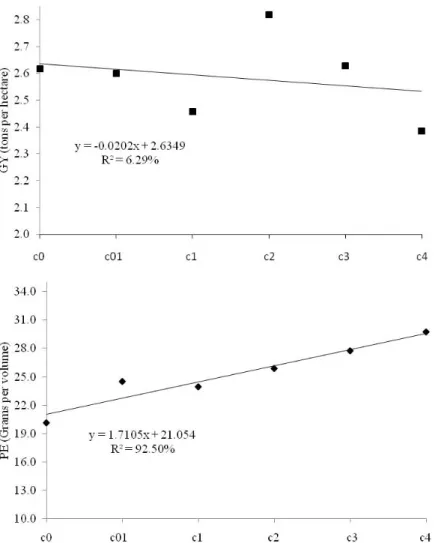
Direct gain from selection (least squares method)
From the ANOVA (data not shown), significant variation was observed between the selection cycles (P<0.01) for the PE trait; no variation in the cycle × environment interaction was observed. For GY, significant differences were not observed. Figure 1 represents the evaluation of all the selection cycles undertaken across the three environments using the mean values adjusted by the combined analysis for
PE and GY. An increase of 1.4% was observed for PE, and a stable response was observed for GY (Figure 1).
Discussion
In the approaches evaluated, the accuracies were in the range of 55% to 89% from the univariate analysis and from 61% to 87% from the multivariate analysis, which indicates moderate to high precision (Resende; Duarte, 2007). Predictive accuracy increases to the extent that the absolute deviations between the parametric genetic values and the predicted genetic values are lower, that is, the lower the prediction error variance (PEV) is, the more accurate the estimator
(Resende; Duarte, 2007). In this study, with few exceptions,
the multivariate approach provided more accurate estimates. According to Piepho et al. (2008), the application of the multivariate BLUP method has advantages over the univariate
method when the traits involved in the analysis exhibit high genetic correlation. Nevertheless, some authors have reported that the increase in precision obtained using the multivariate BLUP method is proportional to the absolute difference between the genetic and environmental correlations of the traits (Schaeffer, 1984; Thompson; Meyer, 1986; Resende, 2007). Additionally, Bauer and Léon (2008) similarly confirmed via
simulations for two traits with different heritabilities (0.3 and
0.7) and via scenarios of genetic and residual correlations that multivariate analysis exhibited lower prediction error and that the superiority of multivariate analysis in relation to univariate analysis is more expressive when the traits are negatively correlated. In this context, the multivariate method
for the estimation of genetic parameters in popcorn would be
preferred because of the existence of negative correlations between PE and GY (frequently reported in the literature), to
a greater or lesser degree of association, and by the difference
in heritability between the two traits (Vieira et al., 2016; Freitas et al., 2014). This phenomenon occurs because the multivariate model specifically considers the environmental and genetic covariances that exist between the traits, minimizing biases that can occur in individual analyses, especially from sequential
selection (Resende, 2007).
The estimates of heritability between the two
approaches were very similar in this study, although the multivariate approach provided errors that were less than or at least equal to those provided by the univariate approach.
Regarding the analysis of all the cycles (combined analysis),
the multivariate approach provided better estimates and
smaller errors. Viana et al. (2010), working with selection cycles in popcorn for PE and GY, also recommended
the multivariate approach, although they did not report superiority of the multivariate approach in relation to the univariate (individual model) approach. The authors further
discussed that the heritabilities between the two traits both
were similar and showed favorable correlations, and for this reason, the multivariate approached lacked superiority.
In relation to genetic gains per cycle, there was a gain
for PE from the univariate approach (Figure 2), whereas for GY, gain was observed in a negative sense from both approaches. This finding was expected because selection of the cycles gave priority to PE in the recombination unit,
considering GY as only part of the second cycle. Selection was made for grain weight per plant within the highest-yielding families in tandem, which, in a certain way, is
subject to great environmental influence.
The estimated genetic gains slightly distorted the gains attained when we analyzed the cycles in the same
experiment (Figure 2). For PE, the univariate approach overestimated the gains while the multivariate approach
underestimated them when we compare those gains with the
gains achieved; nevertheless, the multivariate analysis was penalized in cycle 1, since this analysis did not have involve
that cycle. For GY, both approaches indicated a reduction,
whereas evaluation of the gains achieved in the field indicated stability as generations advanced. A question that remains is how much the genotype × environment interaction interferes
with the estimates of genetic progress because, when we
estimate the progress in an indirect manner, the environmental
effect is confounded in the cycle, and when we analyze the
progress achieved after all the cycles in some environments,
the interaction can mask the results. Following this line of reasoning, Faria et al. (2013) estimated the genetic progress
after 22 years of common bean breeding via the EMBRAPA ARROZ E FEIJÃO program for traits in 20 environments. Those authors reported that the genotype × environment
interaction was high, which interferes with the estimation of genetic progress.
Researchers at Universidade Estadual do Norte Fluminense Darcy Ribeiro have been developing a
recurrent selection program for some time, prioritizing
the PE and GY traits; this program is now in its seventh cycle. As the generations advance, some strategies were
adopted in the program, such as mass selection in cycle 0; S1 families in cycle 2; half-sib families in cycle 3; and
full-sib families in cycles 1, 4, 5, and 6. The program
has been using the index of Mulamba and Mock (1978)
as a selection strategy. However, during selection in the
sixth cycle, Freitas et al. (2013) compared some selection strategies, concluding that the Mulamba and Mock (1978)
index is the most adequate; however, the greatest gains were estimated by the univariate REML/BLUP method. Freitas et al. (2014) then evaluated all the cycles from 0 to 6 and estimated both the genetic parameters of the sixth cycle and the progress from selection for the seventh cycle, obtaining expressive gains for PE and GY.
In summary, greater attention should be given to
the GY trait in future cycles together with PE, that is, other breeding strategies should be adopted for the popcorn
breeding program of the UFLA, which considers the GY and
PE traits simultaneously. This recommendation is because phenotypic selection for PE in the recombination unit is
effective at increasing PE but not effective at increasing GY if we consider the gains both achieved and estimated via univariate analyses. An alternative would be to make use of indices obtained by multivariate approaches, which allow
possible existing genetic corrections with more accurate
Ciência e Agrotecnologia, 42(2):159-167, Mar/Apr. 2018
CONCLUSIONS
The multivariate mixed-model approach is preferred to the univariate one because the former is more informative and accurate for the estimation of
both genetic parameters and selection gains in popcorn crops with respect to PE and GY traits. Genetic gain for PE occurred as a result of our popcorn recurrent selection program. This gain, by contrast, was not
observed for GY using different estimation strategies. Both evaluation and selection for the PE and GY traits in the recombination unit are effective at increasing PE but are not effective at increasing GY.
REFERENCES
BALESTRE, M. et al. Applications of multi-trait selection in common bean using real and simulated experiments. Euphytica, 189(2):225-238, 2012.
BAUER, A. M.; LÉON, J. Multiple-trait breeding values for parental selection in self-pollinating crops. Theoretical and Applied Genetics, 116(2):235-242, 2008.
BRESEGHELLO, F. et al. Results of 25 years of upland rice breeding in Brazil. Crop Science, 51(3):914-923, 2011.
CRUZ, C. D. Programa Genes: Análise multivariada e simulação. Viçosa, MG: UFV, 2006. 175p.
FARIA, L. C. et al. Genetic progress during 22 years of improvement of carioca-type common bean in Brazil. Field Crops Research, 142:68-743, 2013.
FREITAS, I. L. J. et al. Ganho genético avaliado com índices de seleção e com REML/Blup em milho-pipoca. Pesquisa Agropecuária Brasileira, 48(11):1464-1471, 2013.
FREITAS, I. L. J. et al. Genetic gains in the UENF-14 popcorn population with recurrent selection. Genetics and Molecular Research, 13(1):518-527, 2014.
GILMOUR, A. et al. ASReml user guide, release 3.0. Hemel Hempstead: VSN International, 2009. 320p.
HENDERSON, C. R. General flexibility of linear model techniques for sire evaluation. Journal of Dairy Science, 57:963-972, 1974.
HENDERSON, C. R.; QUAAS, R. L. Multiple trait evaluation using relatives’ records. Journal of Animal Science, 43:1188-1197, 1976.
KUROSAWA, R. N. F. et al., Multivariate approach in popcorn genotypes using the Ward MLM strategy: Morpho-agronomic analysis and incidence of Fusarium spp. Genetics and Molecular Research, 16(1)1-12, 2017.
MATTA, F. P.; VIANA, J. M. S. Eficiências relativas de seleção entre e dentro de famílias de meios-irmãos em população de milho-pipoca. Ciência e Agrotecnologia, 27(3):548-556, 2003.
MEYER, K.; THOMPSON, R. Sequential estimation of genetic and phenotypic parameters in multitrait mixed model analysis. Journal of Dairy Science, 69(10):2696-2703, 1986.
MRODE, R. A.; THOMPSON, R. Linear models for the
prediction of animal breeding values. Wallingford: CABI, 2005. 344p.
MULAMBA, N. N.; MOCK, J. J. Improvement of yield potential of the Eto Blanco maize (Zea mays L.) population by breeding for plant traits. Egyptian Journal of Genetics and Cytology, 7:40-51, 1978.
PENA, G. F. et al. Comparação de testadores na seleção de famílias S3 obtidas da variedade UENF-14 de milho-pipoca. Bragantia, 75(2):135-144, 2016.
PIEPHO, H. P. et al. BLUP for phenotypic selection in plant breeding and variety testing. Euphytica, 161(1/2):209-228, 2008.
RAMALHO, M. A. P.; FERREIRA, D. F.; OLIVEIRA, A. C. Experimentação em genética e melhoramento de plantas. Lavras: UFLA, 2005. 322p.
RESENDE, M. D. V. Matemática e estatística na análise de experimentos e no melhoramento genético. Colombo: EMBRAPA Florestas, 2007. 362p.
RESENDE, M. D. V. de; DUARTE, J. B. Precisão e controle de qualidade em experimentos de avaliação de cultivares. Pesquisa Agropecuária Tropical, 37(3):182-194, 2007.
RODOVALHO, M. et al. Genetic evaluation of popcorn families using a Bayesian approach via the independence chain algorithm. Crop Breeding and Applied Biotechnology, 14:261-265, 2014.
SCHAEFFER, L. R. Sire and cow evaluation under multiple traits model. Journal of Dairy Science, 67(7):1567-1580, 1984.
SOARES, A. A.; RAMALHO, M. A. P.; SOUSA, A. F. de. Estimativa do progresso genético obtido pelo programa de melhoramento de arroz irrigado da EPAMIG, na época de oitenta. Pesquisa Agropecuária Brasileira, 29:97-104, 1994.
STATISTICAL ANALYSIS SYSTEM INSTITUTE. SAS/STAT user’s
guide. Version 9. Cary, Software, 2002.
THOMPSON, R.; MEYER, K. A review of theoretical aspects in the estimation of breeding values for multi-trait selection. Livestock Production Science, 15(4):299-313, 1986.
VENCOVSKY, R.; CRUZ, C. D. Comparação de métodos de correção do rendimento de parcelas com estandes variados: I. Dados simulados. Pesquisa Agropecuária Brasileira, 26(8):647-657, 1991.
VIANA, J. M. S. et al. Multi-trait BLUP in half-sib selection of annual crops. Plant Breeding, 129(6):599-604, 2010.
VIEIRA, R. A. et al. Selection index based on the relative importance of traits and possibilities in breeding popcorn. Genetics and Molecular Research, 15(2), 2016.