(Annals of the Brazilian Academy of Sciences)
Printed version ISSN 0001-3765 / Online version ISSN 1678-2690 www.scielo.br/aabc
Structure of potamoplankton along a gradient of preservation of riparian vegetation in subtropical streams
DENISE PERESIN1, LEZILDA C. TORGAN2, UWE H. SCHULZ1 and LUCIANE O. CROSSETTI3
1Programa de Pós-Graduação em Biologia, Universidade do Vale do Rio dos Sinos,
Av. Unisinos, 950, Cristo Rei, 93022-000 São Leopoldo, RS, Brasil
2Fundação Zoobotânica do Rio Grande do Sul, Rua Dr. Salvador França, 1427, Caixa Postal 1188,
Jardim Botânico, 90690-000 Porto Alegre, RS, Brasil
3Departamento de Ecologia, Universidade Federal do Rio Grande do Sul, Caixa Postal 15007,
Agronomia, 91501-970 Porto Alegre, RS, Brasil
Manuscript received on August 19, 2013; accepted for publication on January 3, 2014
ABSTRACT
Water quality in lotic and lentic systems is greatly influenced by the land use in the adjacent areas. This study was conducted in order to assess whether different degrees of preservation of riparian forest (from well preserved with 30m wide up to degraded with < 5 m wide) influence potamoplankton community structure. The study was conducted in three streams in the upper region of the Rio dos Sinos basin, at four sampling sites, with different width of the forest. Samplings were gathered for abiotic and biological analysis in winter (August 2010) and summer (January/February 2011). The analysis of environmental and biotic variables indicated that seasonality was the main determinant of biomass patterns, regardless of the width of riparian vegetation. The potamoplankton community of the studied streams responded to environmental conditions, although lack of significant difference among the different degrees of riparian vegetation preservation has been observed. Increasing trends on biomass, richness and diversity of species, and higher concentrations of total phosphorus and nitrogen in the non-preserved areas might indicate that the different gradients of preservation of riparian vegetation are related with the water quality in subtropical streams and consequently with the potamoplankton structure.
Key words: riparian forest, water quality, stream, bioindicator.
Correspondence to: Luciane Oliveira Crossetti E-mail: [email protected]
INTRODUCTION
The degradation of riparian vegetation causes serious impacts to aquatic ecosystems worldwide. Areas of riparian forests are important for the retention of nutrients and sediments (Lowrance et al. 1997, Storey and Cowley 1997, Sabater et al. 2003,
Naiman et al. 2005, Dosskey et al. 2011). The efficiency of these areas in the control of nitrogen
(N) and phosphorous (P), as well as chemical
contaminants, is strongly influenced by its width (Borin et al. 2004, Gorsevski et al. 2008, Newbold et
al. 2010). Alterations of the structure and dynamics of aquatic communities are the consequences.
Several studies have reported on the influence of riparian vegetation on the water
quality and on the response of the phytoplankton
on the community of diatoms in tropical and temperate rivers (Vázquez et al. 2011, Gabel et al. 2012) has been observed, and an increase in the proportion of N and P when compared to silicate (Si), may result in a decline of diatoms (Conley and Malone 1992, Cugier et al 2005). Moreover, changes in the nutrient loadings caused by deforestation of up to 50% of riparian forests may enhance eutrophication and probably increase the frequency of algal blooms (Perry et al. 1999).
Historically, the phytoplankton from lotic
ecosystems have received less attention in limnological studies (Rodrigues et al. 2007). In Brazil, most of them refer to the taxonomical (Oliveira and Castro 1993, Bittencourt-Oliveira 1993a, b, Mendes-Câmara et al. 2002, Soares et al. 2007) and to the ecological approaches, focusing on diversity (Bittencourt-Oliveira 2002, Borges et al. 2003), structure and the dynamics of
phytoplankton (Train and Rodrigues 1998, Silva et
al. 2001, Soares et al. 2007). Nevertheless, studies addressing the relations between the preservation of the riparian vegetation and its consequences
on the potamoplankton structure are incipient in
Brazilian limnology.
In this context, the aim of this study was to
evaluate the structure of potamoplankton along a
gradient of preservation of riparian vegetation in subtropical streams. Hypothetically, in the stream stretches with preserved riparian vegetation, lower
potamoplankton biomass is expected, as well as
lower richness and species diversity owing to the lower concentration of nutrients and water transparency. These conditions are possible due to the ability of riparian vegetation of retaining nutrients and sediments, and to provide shading.
Unlike, areas with little or no riparian vegetation might present greater potamoplankton biomass,
richness and diversity of species, due to the higher concentration of nutrients, turbidity and lightness in the water.
MATERIALS AND METHODS
STUDIED AREA, DELIMITATION AND SAMPLING FREQUENCY
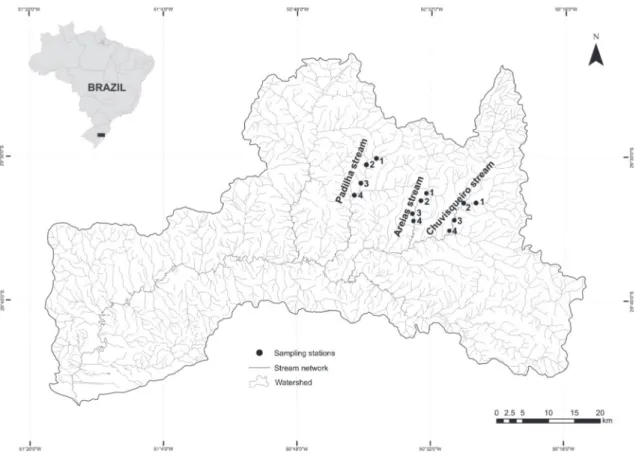
Samples were collected in three streams in the upper reaches of the Sinos River basin, located in the eastern portion of the State of Rio Grande do Sul. In the region higher altitudes are observed, human occupation is less intense and the land use is extensive agriculture.
The evaluated streams were: (i) Padilha stream (29°32'11.94 "S, 50°39'50.07" W), located in the municipality of Taquara, (ii) Areias stream (29°35'09.56 "S, 50°33'32.59 "W), located in the municipality of Rolante, (iii) Chuvisqueiro stream (29 ° 36'11 .66" S, 50°28'55 .89 "W), located between the towns of Riozinho and Rolante (Figure 1). In each of the streams, samples were performed at four sites with different widths of riparian vegetation. The sites were numbered in upstream – downstream direction based on the following gradient: site 1 (P1) well preserved riparian vegetation, more than 30 m wide; site 2 (P2) riparian vegetation partially conserved, width between 15 and 30 m; site 3 (P3) riparian vegetation poorly conserved, width between 5 and 15 m; site 4 (P4) degraded riparian vegetation, width < 5 m. The land uses in the adjacent areas of the sample sites were predominantly extensive agriculture and pastures. The distance between the sample sites was of at
least 1 km.
According to the Strahler method (1957), the
sampled points were classified as stream orders 3 and
order 4. Samples were collected in winter (August 2010) and summer (January / February 2011).
ABIOTIC ANALYSIS
In situ, the following set of variables were measured with a multi water quality probe (Horiba U53): pH, dissolved oxygen (DO), water temperature (Temp H2O), conductivity (Cond), redox potential
with an electronic flow meter (Flo-Mate 2000, Marsh_McBirney) equipment. The stream width was also registered at each sampled point. Water samples were collected for analysis, in laboratory, of orthophosphate (SRP), total phosphorus (TP), total nitrogen (TN), organic nitrogen (ON), ammonia (N-NH3-), nitrite (N-NO2-) (APHA 2005)
and nitrate (N-NO3-) (Method of salicylate). In the
summer period, analyses of organic phosphorus (OP), chlorophyll a (Cloa) and silica (Si) (APHA 2005) were included. The total phosphorus and nitrogen load, considering the flow (Bain and Stevenson, 1999), was estimated in the first
week of July 2012. The load was calculated
by the “average sample load” model (Li et al. 2003): L= K (C * Q), where L = load, K = time interval (in this case, one day), C = concentration and Q = discharge.
The average temperature and precipitation data for the months of August 2010 and February 2011 were obtained from Fundação Estadual de Pesquisa Agropecuária – FEPAGRO (FEPAGRO 2010, 2011). The data correspond to the station located in Campo Bom, which is the nearest to the sampling sites.
BIOLOGICAL ANALYSIS
The samples used to determine the phytoplankton floristic composition, were collected with a plankton net and fixed with aqueous formalin 3-5%. The identification of diatoms was performed after the clarification of the collected material as described by
the Müller-Melches and Ferrando (1956) technique, without the addition of sulfuric acid. The permanent slides were mounted using Naphrax®. Diatoms were identified using specialized literature.
Samples for quantitative analysis of
phyto-plankton were collected in the subsurface water
(± 10 cm surface). The samples were fixed
with acetic Lugol’s solution 1%. Phytoplankton
quantification followed Utermöhl (1958) and sedimentation time was set according to Lund et al. (1958), who defined 4 hours for each centimeter of chamber height. The organisms density (individuals.mL-1) was calculated
according to Ros (1979). The biovolume (mm³. mL-¹) of each species was calculated based on
the geometry form that best approximated to the cell shape, isolated or combined, according to Hillebrand et al. (1999). Descriptive species were considered those that contributed most to the total biomass (> 1%) in each sampled point. The richness (number of taxa) and diversity index (H') (Shannon and Weaver 1963) were also calculated using Past – statistical software (Hammer et al. 2001).
DATA ANALYSIS
The data were analyzed through descriptive statistics. In order to compare the biological and abiotic parameters from different sampled points, the Analysis of Variance (ANOVA "one way") was performed, using the statistical software SYSTAT 12 for Windows, version 12 (SYSTAT Software 2007). The streams were treated as replicas (n = 3). A Detrended Correspondence Analysis (DCA) was performed to indicate the need to use a unimodal method or linear ordering. From its results (length of gradient: 5.0), the Canonical Correspondence Analysis (CCA) was performed to verify the relationships between
descriptive species and key environmental
variables in the studied areas. Therefore, the biological and abiotic variables were transformed (ranging and log x + 1, respectively), avoiding colinearity. The PC-ORD statistical software, version 5.15 (McCune and Mefford 2006) was used to perform these analyses.
RESULTS
ABIOTIC VARIABLES
Considering the variation of the physic-chemical data in different gradients of riparian forest preservation, an increasing trend in water temperature, conduc-tivity, turbidity and TSD (Table I) was observed, from P1 (most preserved) to P4 (less preserved). On the other hand, DO concentrations tended to
decrease from P1 to P4, although not significantly
(p = 0.215 in winter and p = 0.243 in summer). Water temperature and N-NO2- had higher values
in summer, while the DO and TP had higher concentrations in winter (Table I). There was an
increase in the TP concentrations, from three to five
times in winter, when compared to summer. Water
velocity showed a significant difference between
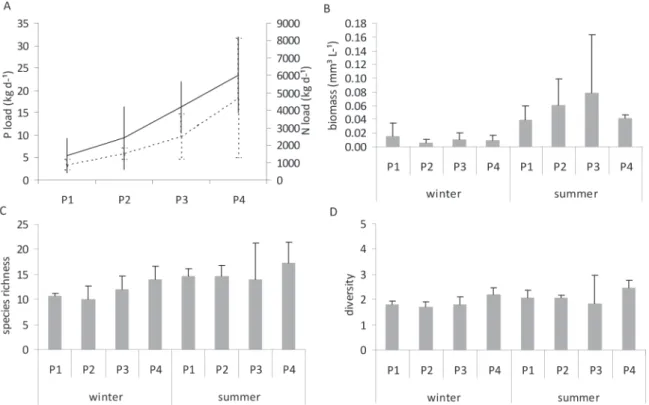
the sampled points in winter (F = 10.780, p =0.030), being higher in the most preserved point (P1). The values of total nitrogen and total phosphorus loads
were significantly higher in points less preserved (F
= 4.56, p =0.038; F = 5.33, p =0.026), being P1 and P4 statistically different for both nutrients (p =0.036 and 0.020, respectively) (Figure 2A).
BIOLOGICAL RESPONSES
A total of 151 taxa were identified, distributed in
10 taxonomic classes. Bacillariophyceae had the
highest taxa number (29% of all identified taxa),
followed by Chlorophyceae (26%), Euglenophyceae (12%) and Cyanobacteria (10%).
The potamoplankton biomass was higher at
all sites in summer (Table I, Figure 2B) and the highest mean value (0.08 mm3 L-1) was found at P3. However, regardless of the season, there were no
significant differences in biomass in relation to the
Season Winter Summer
Areas 1 2 3 4 1 2 3 4
Total precipitation (mm.month-1)
53.6 154.4
Average air temperature (°C. month-1)
16.3 26.8
Water temperature (°C)
10.0 - 12.2 (11.2; ± 1.2)
11.0 - 12.6 (11.9; ± 0.8)
11.4 - 12.8 (12.0; ± 0.7)
12.0 - 13.3 (12.7; ± 0.7)
21.6 - 24.2 (22.8; ± 1.3)
22.8 - 24.4 (23.8; ± 0.9)
22.2 - 24.5 (23.6; ± 1.3)
22.9 - 24.6 (23.8; ± 0.9)
DO (mg.L-1) 12.7 - 15.1 (14.1; ± 1.2)
12.2 - 14.7 (13.7; ± 1.3)
12.1 - 15.4 (13.8; ± 1.6)
12.0 - 13.5 (12.8; ± 0.8)
7.7 - 9.3 (8.7; ± 0.9)
7.3 - 8.1 (7.7; ± 0.4)
7.5 - 7.6 (7.5; ± 0.0)
7.2 - 8.6 (7.8; ± 0.7)
Conductivity (ms.cm-1)
0.036 - 0.046 (0.040; ± 0.006)
0.037 - 0.052 (0.043; ± 0.008)
0.039 - 0.057 (0.045; ± 0.010)
0.044 - 0.061 (0.053; ± 0.009)
0.040 - 0.048 (0.044; ± 0.004)
0.040 - 0.053 (0.047; ± 0.007)
0.044 - 0.057 (0.049; ±0.007)
0.045 - 0.065 (0.053; ± 0.011)
TDS (g.L-1)
0.023 - 0.030 (0.026; ± 0.004)
0.024 - 0.034 (0.028; ± 0.006)
0.025 - 0.037 (0.029; ± 0.007)
0.029 - 0.040 (0.035; ± 0.006)
0.026 - 0.031 (0.028; ± 0.003)
0.026 - 0.035 (0.031; ± 0.005)
0.029 - 0.037 (0.032; ± 0.005)
0.030 - 0.042 (0.034; ± 0.007)
pH 7.1 - 8.4
(7.5; ± 0.7)
7.2 - 7.5 (7.3; ± 0.2)
7.2 - 7.6 (7.4; ± 0.2)
7.2 - 7.5 (7.4; ± 0.2)
7.1 - 7.2 (7.2; ± 0.1)
7.0 - 7.6 (7.3; ± 0.3)
7.0 - 7.7 (7.3; ± 0.3)
7.1 - 7.6 (7.3; ± 0.3) Turbidity
(NTU)
2.4 - 10.1 (6.6; ± 3.9)
3.0 - 8.0 (4.7; ± 2.8)
3.0 - 8.0 (4.7; ± 2.8)
4.0 - 11.3 (7.7; ± 3.7)
0.3 - 12.2 (5.9; ± 6.0)
1.3 - 12.4 (6.1; ± 5.7)
0.4 - 14.5 (6.3; ± 7.3)
0.5 - 14.3 (6.3; ± 7.2) Stream
width (m)
0.26 - 0.38 (0.32; ± 0.06)
0.30 - 0.40 (0.34; ± 0.05)
0.16 - 0.22 (0.19; ± 0.03)
0.17 - 0.22 (0.20; ± 0.03)
0.22 - 0.35 (0.31; ± 0.08)
0.18 - 0.41 (0.26; ± 0.13)
0.07 - 0.42 (0.28; ± 0.18)
0.26 - 0.38 (0.30; ± 0.07) SRP
(µg.L-1)
9 - 80 (39; ± 37)
3 - 80 (34; ± 40)
4 - 40 (25; ± 19)
12 - 50 (31; ± 19)
20 - 60 (37; ± 21)
30 - 30 (30; ± 0)
30 - 60 (43; ± 15)
20 - 40 (30; ± 10) TP
(µg.L-1)
110 – 190 (147; ± 40)
100 - 180 (140; ± 40)
130 - 200 (173; ± 38)
110 - 190 (140; ± 44)
27 - 37 (33; ± 6)
23 - 38 (31; ± 8)
34 - 66 (45; ± 18)
23 - 33 (27; ± 5)
N-NO3
-(µg.L-1)
450 - 560 (503; ± 55)
400 - 750 (527; ± 194)
350 – 820 (513; ± 266)
370 – 520 (420; ± 87)
200 – 540 (326.7; ± 185.8)
200 - 560 (320.0; ± 207.8)
200 – 900 (443.3; ± 395.8)
200 - 220 (206.7; ± 11.5) N-NO2
-(ug.L-1)
1.2 - 2.3 (1.7; ± 0.6)
0.3 - 3.4 (2.0; ± 1.6)
0.1 - 2.5 (1.2; ± 1.2)
2.2 - 3.4 (2.7; ± 0.6)
10 – 13 (11; ± 2)
10 – 12 (11; ± 1)
10 - 10 (10; ± 0)
10 – 14 (11; ± 2) N-NH3
-(µg.L-1)
90 - 110 (103; ± 12)
80 - 140 (107; ± 31)
80 - 220 (147; ± 70)
70 - 150 (120; ± 44)
230 - 420 (320; ± 95)
300 - 1.420 (763; ± 584)
420 - 1.460 (793; ± 579)
190 - 1.570 (740; ± 731)
TN (µg.L-1) 380 - 450
(403; ± 40)
120 - 650 (443; ± 284)
430 -660 (563; ± 119)
140 - 770 (547; ± 353)
610 - 2,210 (1,170; ± 902)
690 - 4,260 (1,897; ± 2,047)
780 - 1.610 (1,067; ± 471)
600 - 2.340 (1,213; ± 977)
DIN (µg.L-1) 562 - 671 (608; ± 56)
500 -833 (635; ± 175)
430 -1,041 (661; ± 332)
512 - 593 (543; ± 44)
440 - 863 (658; ± 212)
780 - 1,992 (1,094; 789)
660 - 2,370 (1,247; ± 973)
400 - 1,804 (958; ± 745)
Si (mg.L-1) - - - - 4.83 - 7.24
(6.2; ± 1.2)
6.43 - 8.29 (7.2; ± 1.0)
6.71 - 9.32 (7.8; ± 1.4)
6.80 - 8.57 (7.5; ± 0.9)
Biomass (mm3.L-1)
0.001 - 0.038 (0.015; ± 0.020)
0.001 - 0.011 (0.006; ± 0.005)
0.003 - 0.022 (0.011; ± 0.010)
0.001 - 0.017 (0.009; ± 0.008)
0.026 - 0.063 (0.039; ± 0.021)
0.038 - 0.105 (0.060; ± 0.038)
0.030 - 0.117 (0.079; ± 0.084)
0.036 - 0.047 (0.041; ± 0.006)
Chlorophyll-a - - - - 0.50 - 0.50
(0.5; ± 0.0)
0.50 - 1.03 (0.8; ± 0.3)
0.59-1.32 (1.0; ± 0.4)
0.50 -1.13 (0.7; ± 0.4) Water
velocity
0.22 - 0.35 (0.31; ± 0.06)
0.18 - 0.41 (0.26; ± 0.11)
0.07 - 0.42 (0.28; ± 0.15)
0.26 - 0.38 (0.30; ± 0.06)
0.26 - 0.38 (0.32; ± 0.05)
0.30 - 0.40 (0.34; ± 0.04)
0.16 - 0.22 (0.19; ± 0.02)
0.17 - 0.22 (0.20; ± 0.02)
TABLE I
Minimum, maximum, average and standard deviation of abiotic variables for each sampling
Figure 2 - Phosphorus (P load, kg.d-1) and nitrogen loads (N load,kg.d-1) (A), biomass (mm³.L-1) (B), species richness
(number of individuals) (C) and diversity (mg.ind-1) (D) estimated for each sampled point (P1 = most preserved;
P4 = less preserved).
The richness and diversity (Figures 2C and 2D) varied depending on the gradient of riparian forest preservation, regardless of the season of the year,
although not significantly (p > 0.05). P4 showed the
highest richness and diversity of species in winter (14 species and 2.2 bits mg-1, respectively) and in summer (17 species and 2.5 bits mg-1).
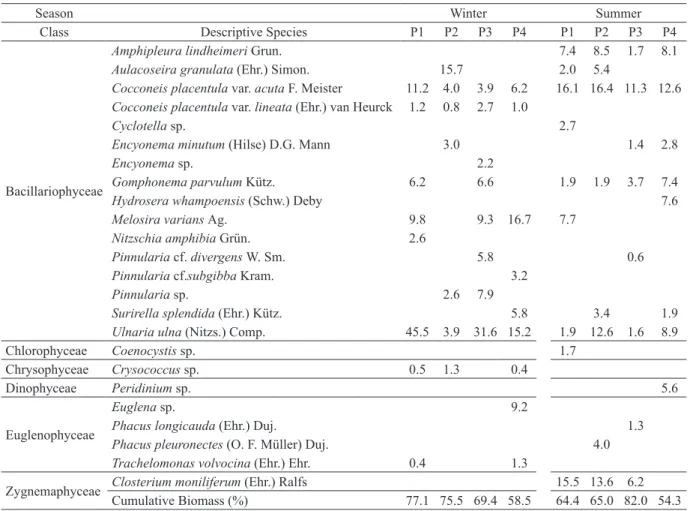
A total of 24 descriptive species were
identified (Table II). No relationship was observed
between the biomass of descriptive species and the gradient of riparian forest preservation. Comparing the two seasons analyzed (Table II), a replacement of the most descriptive species was observed in each one of the analyzed sites. Some species as
Cocconeis placentula var. acuta F. Meister and
Ulnaria ulna (Nitzs.) Comp. occurred in both summer and winter, while the species Amphipleura lindheimeri Grun., Gomphonema parvulum Kütz. and Closterium moniliferum (Ehr.) Ralfs showed preference for summer.
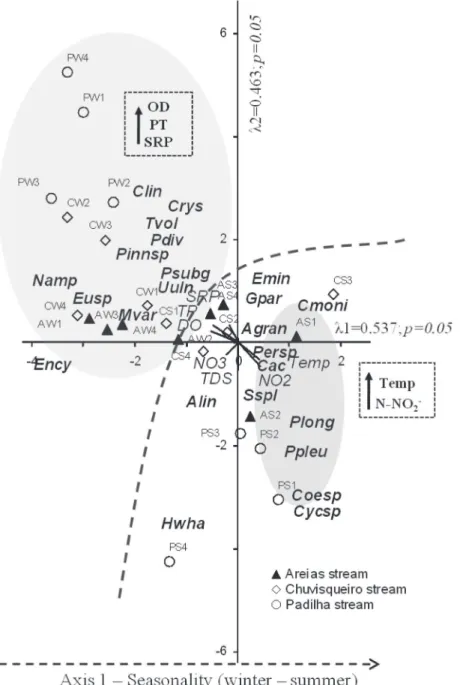
INTEGRATED ANALYSIS
The CCA was performed using the seven major environmental variables and descriptive species biomass (Figure 3). The eigen values for axis 1 and 2 were 0.537 and 0.463. The Pearson correla-tions between species-environment (0.960 and
0.914) showed significant relationship between
environmental variables and species distribution for the sampled points. The Monte Carlo test used
to assess the significance of the first canonical axes
showed that the ordination of axes 1 and 2 was
statistically significant (p <0.05) and indicated that
ordination did not occur at random.
The "intra-set" correlations showed that the DO (-0.768) and PT (-0.701) were the most important variables in the axis 1, whereas in relation to the second axis, TDS (-0.724) was the most important variable.
Season Winter Summer
Class Descriptive Species P1 P2 P3 P4 P1 P2 P3 P4
Bacillariophyceae
Amphipleura lindheimeri Grun. 7.4 8.5 1.7 8.1
Aulacoseira granulata (Ehr.) Simon. 15.7 2.0 5.4
Cocconeis placentula var. acuta F. Meister 11.2 4.0 3.9 6.2 16.1 16.4 11.3 12.6
Cocconeis placentula var. lineata (Ehr.) van Heurck 1.2 0.8 2.7 1.0
Cyclotella sp. 2.7
Encyonema minutum (Hilse) D.G. Mann 3.0 1.4 2.8
Encyonema sp. 2.2
Gomphonema parvulum Kütz. 6.2 6.6 1.9 1.9 3.7 7.4
Hydrosera whampoensis (Schw.) Deby 7.6
Melosira varians Ag. 9.8 9.3 16.7 7.7
Nitzschia amphibia Grün. 2.6
Pinnularia cf. divergens W. Sm. 5.8 0.6
Pinnularia cf.subgibba Kram. 3.2
Pinnularia sp. 2.6 7.9
Surirella splendida (Ehr.) Kütz. 5.8 3.4 1.9
Ulnaria ulna (Nitzs.) Comp. 45.5 3.9 31.6 15.2 1.9 12.6 1.6 8.9
Chlorophyceae Coenocystis sp. 1.7
Chrysophyceae Crysococcus sp. 0.5 1.3 0.4
Dinophyceae Peridinium sp. 5.6
Euglenophyceae
Euglena sp. 9.2
Phacus longicauda (Ehr.) Duj. 1.3
Phacus pleuronectes (O. F. Müller) Duj. 4.0
Trachelomonas volvocina (Ehr.) Ehr. 0.4 1.3
Zygnemaphyceae Closterium moniliferum (Ehr.) Ralfs 15.5 13.6 6.2
Cumulative Biomass (%) 77.1 75.5 69.4 58.5 64.4 65.0 82.0 54.3
TABLE II
Relative biomass of descriptive species in sampling points (P1 = most preserved; P4 = less preserved), in winter and summer.
with the highest concentrations of N-NO2- and
temperature. The species grouped on this side of the axis included: Cocconeis placentula var.
acuta (r = 0.812), Closterium moniliferum (0.473),
Gomphonema parvulum (0.437), Surirella splendida
(Ehr.) Kütz. (0.224), Aulacoseira granulata (Ehr.) Simon.(0.176), Encyonema minutum (Hilse) D. G. Mann (0.145) and Peridinium sp. (0.089). On the negative side of axis 1, the winter sampling points related with the higher DO, TP and SRP were associated. On this side of the axis, the species
Trachelomonas volvocina (Ehr.) Ehr. (0.621),
Chrysococcus sp. (0.581), Cocconeis placentula
var. lineata (Ehr.) van Heurck (0.465), Pinnularia
sp. 1 (0.320), Pinnularia cf. subgibba Kram. (0.320),
Melosira varians Ag. (0.226), Nitzschia amphibia
Grün. (-0.208), Euglena sp. (-0.161), Pinnularia
cf. divergens W. Sm. (-0.061) and Ulnaria ulna
(0.016) were grouped. Regarding axis 2 ordination, sampling units were arranged to the positive side of the axis, related to the higher concentrations of SRP (0.459). On the negative side of this axis, sampling units were disposed related to the higher values of TDS, N-NO3- and N-NO
2
-, associated with
the species of Amphipleura lindheimeri (-0.461),
Surirella splendida (-0.476), Phacus pleuronectes
(O. F. Müller) Duj. (-0.254) and P. longicauda
(Ehr.) Duj. (-0.226), among others.
Regarding the preservation of the riparian
Figure 3 - Ordination by CCA (axis 1 and 2) of the sampled areas in terms of environmental and biological variables (species - biomass (mm3.L-1). A = Areias stream, C = Chuvisqueiro stream, P = Padilha stream , W = winter, S = summer; 1, 2, 3, 4 = sampled areas. Alin= Amphipleura lindhiemeri; Agran = Aulacoseira granulata; Cmoni = Closterium moniliferum; Cac = Cocconeis placentula var. acuta; Clin = Cocconeis placentula var. lineata; Coesp = Coenocytis sp.; Crys = Crysococcus sp.; Cycsp = Cyclotella sp.; Emin = Encyonema minutum; Ency = Encyonema
sp. 1; Eusp. = Euglena sp.; Gpar = Gomphonema parvulum; Hwha = Hydrosera whampoensis; Mvar = Melosira varians; Namp = Nitzschia amphibia; Persp = Peridinium sp.; Plong = Phacus longicauda; Ppleu= Phacus pleuronectes; Pdiv = Pinnularia cf. divergens; Psub = Pinnularia cf.
DISCUSSION
The results showed increasing trends in the amounts of biomass, richness and diversity
of potamoplankton species, from the most
preserved points to the less preserved points of riparian vegetation. The integrated analysis of environmental variables and descriptive species in the studied points indicated that the gradient of riparian forest preservation was not a structuring
factor of the potamoplankton community. The
data showed that seasonality (winter and summer) was the main determinant of biomass patterns and presence or absence of species.
Many studies in stream ecosystems have showed seasonality as the main variable correlated with higher values of algal biomass, chlorophyll-a
and species richness (Rodrigues et al. 2007, Borges and Train 2009, Rossetti et al. 2009, Tavernini et al. 2011). In the present study, the higher rainfall recorded during the summer might be the explanation for the higher biomass and diversity observed in the studied streams. Apparently, the
higher precipitation did not influence the water
speed and, instead, might have contributed to the
input of nutrient, especially nitrogen, benefiting
algae development. Furthermore, the higher
temperature at this station may have influenced the development of potamoplankton. Other conditions for the development of phytoplankton in the
summer have been reported, such as increased temperature and luminosity (Salmaso and Zignin 2010). In general, the low values of algal biomass recorded in the studied streams are in agreement with the mean values observed in other stream ecosystems (Soares et al. 2007, Borges and Train 2009, Kireta et al. 2012).
That riparian vegetation present the ability to retain sediments, reduce nutrient and agrochemical loads, is well documented in the literature (eg, Lowrance et al. 1997, Storey and Cowley 1997, Sabater et al. 2003, Naiman et al. 2005, Borin et
al. 2004, Gorsevski et al. 2008), it was expected
that variations in the concentrations of physical-chemical parameters along the preservation riparian gradient would be clearly observed. Opposite to that, few variables showed clear patterns, among which stands out the highest concentration of total dissolved solids, temperature and electrical conductivity in points with less vegetation preserved. Similar condition was obtained by other authors (Johnson et al. 1997, Carpenter and Waite 2000, Vázquez et al. 2011). Regardless of this fact, the highest values of total nitrogen and total phosphorus loads contrary to the
riparian vegetation gradient showed the significant
impact of the vegetation absence on water quality. According to Reynolds and Davies (2001), the removal of riparian forests and their replacement by agricultural areas may increase the export of
P up to 100 kg PT km-2 year-1 for water bodies. Considering the responses of potamoplankton
community in the studied areas, the three major
taxonomic classes identified (Bacillariophyceae,
Chlorophyceae and Cyanobacteria) followed the results found in other temperate and tropical stream
ecosystems (Padisák et al. 1991, O’Farrel et al. 2002,
Soares et al. 2007, Rodrigues et al. 2009, Tavernini et al. 2011, Wu et al. 2012). According to Descy et al. (2012), most taxons of Bacillariophyceae
are not truly planktonic, but benthic taxons in
suspension, as observed in the present study
(Table II) Although found in the plankton in the
studied streams, Cocconeis placentula var. acuta,
Amphipleura lindheimeri, Gomphonema parvulum,
Melosira varians, Encyonema and Ulnaria ulna
are examples of species commonly found in the benthos. The most representative of these taxons in terms of biomass may be related to the presence of riparian vegetation and the high rainfall in the summer. Rainfall removes the benthic forms from sediment to the water more easily.
Although biomass, richness and diversity
clear answers regarding the gradient of riparian preservation in the present study, some descriptive
species identified are commonly related with
nutri-tionally enriched environments. This is the case of
Nitzschia amphibia, Melosira varians and Ulnaria ulna that are usually cited as species tolerant to eutrophication (Carpenter and Waite 2000). Similarly, Gomphonema parvulum already had its best development associated with nutrient-rich waters, especially in waters that contain domestic or
agricultural wastewater (Patrick and Reimer 1975). In Brazil, this species was identified in the Pomba
River (Paraná) (Soares et al. 2007) being associated
with high levels of flow, temperature and alkalinity
found in the rainy season. According to the
classification performed by the Software Omnidia
(The Diatoms Software) (Lecointe et al. 1993),
Aulacoseira granulata, Cocconeis placentula
var. lineata, Nitzschia amphibia are classified as
indicator species of eutrophic environments, while
Surirella splendida meso-eutrophic environments and Ulnaria ulna are indifferent to environment trophic status. Closterium moniliferum is regarded as a typical specie of river (Descy et al. 2012) and has also been associated to stream ecosystems near pastures (Vázquez et al. 2011). The descriptive species of group Euglenophyceae (Euglena sp.,
Phacus pleuronectes e P. longicauda) are generally found in ecosystems with high organic pollution (Safonova and Shaulo 2009, Reynolds et al. 2002).
Data analyses of the biomass, richness and diversity proved to be consistent with the River Continuum Concept (RCC) proposed by Vannotte et al. (1980), even in a small sampling scale and partially attended patterns of vegetation and increasing width of the stream. The central proposal of the RCC is that from the headwaters to downstream, variables in a lotic system exhibit a continuous gradient of
conditions, including width, depth, speed, flow,
temperature and entropy gain. The theory also describes the structure and function of the aquatic communities along the river course, suggesting
that the distribution of species follow the abiotic gradients, mainly due to the processing of organic matter and by different trophic standards along the longitudinal gradient. So, the greatest contribution of
planktonic species occurs in areas with less influence
of riparian vegetation (less preserved). In the present
study, these trends were recorded by phytoplankton,
biomass, richness and diversity data, although not
statistically significant. It is possible that the lack of significance of these results was due to the width
of the riparian vegetation that may not have been
sufficiently disparate to provide significant results,
between the sampled areas. In literature data, a difference of 25 m in the width of riparian vegetation (between the most preserved and less preserved
point), would be sufficient to obtain meaningful
responses for the nutrients retention (Borin et al. 2004, Mayer et al. 2005), although some reviews have recommended that vegetation protected areas must be between 7 and 100m, being determined based on the levels of nitrogen removal that are expected (Mayer et al. 2005).
The trends observed in this study demonstrate the importance of riparian forests in the dynamics and biological structure in lotic environments. While some scientists state that efforts aimed at maintaining or restoring the water quality by the management agencies should be directed
primarily to define the width of buffer zones of
riparian forest (Johnson et al. 1997), there are
others that re-think strategies directed to the phytoplankton bloom control in upstream areas
(Hutchins et al. 2010). Anway, the interaction of longitudinal, vertical and side vectors on streams
might influence their physical structure (Poole
2002), and these interactions will certainly result in different responses from biological communities, as observed in the studied streams.
In short, better water quality has been identified
in areas of preserved riparian forest, as evidenced by
lower nutrient concentrations. The potamoplankton
richness and diversity did not vary significantly
along the gradient preservation of riparian forest. However, the composition of descriptive species indicated possible contamination by organic matter and high nutritional contents in the studied streams,
demonstrating the influence of riparian vegetation
on the maintenance and quality preservation of subtropical stream ecosystems.
ACKNOWLEDGMENTS
The authors thank PETROBRAS AMBIENTAL
for funding the research; the PROSUP/CAPES for granting the master’s scholarship; Environmental Engineer Taison Anderson Bortolin by producing the
Watershed Map and all who assisted in field work.
RESUMO
A qualidade das águas em sistemas lóticos ou lênticos sofre grande influência das atividades que são realizadas em suas margens. O presente estudo foi desenvolvido com vistas a avaliar se áreas com diferentes graus de preservação da mata ripária (de muito preservada, com 30m de largura, à degradada, com menos de 5m de largura) influenciam na estrutura da comunidade potamoplanctônica. O estudo foi desenvolvido em três arroios do trecho superior da Bacia Hidrográfica do Rio dos Sinos, em quatro áreas sob a influência de diferentes larguras da mata ciliar. Amostras foram coletadas para análises bióticas e abióticas no inverno (agosto/2010) e verão (janeiro/fevereiro/2011). As análises das variáveis ambientais e bióticas indicaram que a sazonalidade é a principal determinante dos padrões de biomassa, independente da largura da vegetação riparia. A comunidade potamoplanctônica estudada respondeu às condições ambientais, embora não tenham sido observadas diferenças significativas entre as áreas com diferentes graus de preservação de vegetação riparia. Tendências ao aumento da biomassa, riqueza e diversidade de espécies, e maiores concentrações de fósforo e nitrogênio total nas áreas não preservadas podem indicar que os diferentes gradientes de preservação da mata ciliar estão relacionados com a
qualidade da água em arroios subtropicais e, portanto, com a estrutura do potamoplâncton.
Palavras-chave: vegetação ripária, qualidade da água, arroios, bioindicadores.
REFERENCES
AMERICAN PUBLIC HEALTH ASSOCIATION - APHA. 2005. Standard Methods for the examination of water and wastewater. 21st ed. Maryland: APHA, 1368p
BAIN MB AND STEVENSON NJ. 1999. Aquatic habitat assessment: common methods. Betes da Maryland: AFS books, 224 p.
BITTENCOURT-OLIVEIRA MC. 1993a. Ficoflórula do rio Tibagi, estado do Paraná, Brasil.: I. Desmídeas, filamentosas e gêneros Gonatozygon, Penium, Pleurotaenium e
Tetmemorus (Zygnemaphyceae). Semina Ciênc Biol Saúde 14: 61-73.
BITTENCOURT-OLIVEIRA MC. 1993b. Ficoflórula do rio Tibagi, estado do Paraná, Brasil.: III. Actinotaenium, Cosmarium
e Staurodesmus (Zygnemaphyceae). Semina Ciênc Biol Saúde 14: 86-95.
BITTENCOURT-OLIVEIRA MC. 2002. A comunidade fitoplanc-tônica do rio Tibagi: uma abordagem preliminar de sua diversidade. In: MEDRI ME ET AL. (Eds), A bacia do Rio Tibagi, Londrina: FUEL, p. 373-402.
BITTENCOURT-OLIVEIRA MC AND CASTRO AAJ. 1993. Ficoflórula do rio Tibagi, estado do Paraná, Brasil.: III. Gênero Closterium (Zygnemaphyceae). Semina Ciênc Biol Saúde 14: 74-85.
BORGES PAF, RODRIGUES LC, PAGIORO TA AND TRAIN S. 2003. Spatial variation of phytoplankton and some abiotic variables in the PirapóRiver -PR (Brazil) in August 1999: a preliminary study. Acta Sci Biol Sci 25: 1-8.
BORGES PAF AND TRAIN S. 2009. Phytoplankton diversity in
the Upper Paraná River flood plain during two years of drought (2000 and 2001). Braz J Biol 69: 637-647. BORIN M, BIGON E, ZANIN G AND FAVA L. 2004. Performance
of a narrow buffer strip in abating agricultural pollutants in the shallow subsurface water flux. Environ Pollut 131: 313-321.
CARPENTER KD AND WAITE IR. 2000. Relations of habitat-specific algal assemblages to land use and water chemistry in the Willamette Basin, Oregon. Environ Monit Assess 64: 247-257.
CONLEY DJ AND MALONE TC. 1992. Annual cycle of dissolved silicate in Chesapeake Bay: implications for the production and fate of phytoplankton biomass. Mar Ecol-Prog Ser 81: 121-128.
CUGIER P, BILLEN G, GUILLAUD JF, GARNIER J AND MÉNESGUEN A. 2005. Modelling the eutrophication of the Seine Bight (France) under historical, present and future riverine nutrient loading. J Hydrol 304: 381-396.
DESCY JP, LEITAO M, EVERBECQ E, SMITZ JS AND DELIÈGE JF. 2012. Phytoplankton of the River Loire, France: a biodiversity
DOSSKEY MG, HELMERS MJ AND EISENHAUER DE. 2011. A design aid for sizing filter strips using buffer area ratio. J Soil Water Conserv 66: 29-39.
DUDGEON D. 2008. Tropical Stream Ecology, San Diego: Elsevier, 370 p.
FEPAGRO - FUNDAÇÃO ESTADUAL DE PESQUISA AGROPECUÁRIA. 2010. Centro de Meteorologia Aplicada. Boletim Meteorológico do Estado do Rio Grande do Sul. Agosto/2010. Disponível em: <http://www.cnpt.embrapa. br/pesquisa/agromet/pdf/Boletim_2010_08.pdf>.Acesso em: 31 jan 2013.
FEPAGRO - FUNDAÇÃO ESTADUAL DE PESQUISA AGROPECUÁRIA. 2011. Centro de Meteorologia Aplicada. Boletim Meteorológico do Estado do Rio Grande do Sul. Fevereiro/2011. Disponível em: <http://www.cnpt. embrapa.br/pesquisa/agromet/pdf/Boletim_2011_02. pdf>. Acesso em: 31 jan 2013.
GABEL KW, WEHR JD AND TRUHN KM. 2012. Assessment of the effectiveness of best management practices for streams draining agricultural land scapes using diatoms and macroinvertebrates. Hydrobiologia 680: 247-264. GORSEVSKI PV, BOLL J, GOMEZDELCAMPO E AND BROOKS ES.
2008. Dynamic riparian buffer widths from potential non-point source pollution areas in forested watersheds. Forest Ecol Manag 256: 664-673.
HAMMER O, HARPER DAT AND RYAN PD. 2001. PAST: Paleontological statistics software package for education and data analysis. Palaeontologia Electronica 4: 1-9. HILLEBRAND H, DÜRSELEN C-D, KIRSCHTEL D, POLLINGHER U
AND ZOHARY T. 1999. Biovolume calculation for pelagic and benthic microalgae. J Phycol 35: 408-424.
HUTCHINS MG, JOHNSON AC, DEFLANDRE-VLANDAS A, COMBER S, POSEN P AND BOORMAN D. 2010. Which offers more scope to suppress river phytoplankton blooms: Reducing nutrient pollution or riparian shading? Sci Total Environ 408: 5065-5077.
KIRETA AR, REAVIE ED, SGRO GV, ANGRADI TR, BOLGRIEN DW, HILL BH, JICHA TM. 2012. Planktonic and periphytic diatoms as indicators of stress on great rivers of the United States: Testing water quality and disturbance models. Ecol Indic 13: 222-231.
JOHNSON LB, RICHARDS C, HOST GE, ARTHUR JW. 1997.
Landscape influences on water chemistry in Midwestern stream ecosystems. Freshwater Biol 37: 193-208.
LECOINTE C, COSTE M AND PRYGIEL J. 1993. "Omnidia": software for taxonomy, calculation of diatom index and inventories management. Hydrobiologia 260/770: 509-513. LI H, LEE JW, CAI M. 2003. Nutrient load estimation methods
for rivers. International J Sediment Res 18: 346-351. LOWRANCE R ET AL. 1997. Water quality functions of riparian
forest buffer systems in Chesapeake Bay watersheds. Environ Manage 21: 687-712.
LUND JWH, KIPLING C AND LECREN ED. 1958. The inverted microscope method of estimating algal number and statistical basis of estimating by counting. Hydrobiologia 11: 143-170.
MAYER PM, REYNOLDS JR SK, MCCUTCHEN MD AND CANFIELD TJ. 2005. U.S. Environmental Protection Riparian Buffer Width, Vegetative Cover, and Nitrogen Removal Effectiveness: A Review of Current Science and Regulations. EPA/600/R-05/118. Cincinnati, OH: U.S. Environmental Protection Agency EPA, 40 p.
MCCUNE B AND MEFFORD MJ. 2006. PC-ORD. Multivariate analysis of ecological data version 5.15. Oregon: MjM Software.
MENDES-CÂMARA FM, MOURA AN AND B ITTENCOURT-OLIVEIRA MC. 2002. Ficoflórula planctônica do Rio Parnaíba, Estado do Piauí – Brasil.Rev Nordestina 16: 3-21. MÜLLER-MELCHERS FC AND FERRANDO H. 1956. Téccnicas
para El Estudio de lãs Diatomeas. Bol Inst Oceanogr 6: 93-138.
NAIMAN RJ, DÉCAMPS H AND MCCLAINME. 2005. Riparia: Ecology, Conservation, and Management of Streamside Communities, Burlington: Elsevier Academic Press, 448 p. NEWBOLD JD, HERBERT S, SWEENEY BW, KIRY P AND ALBERTS
SJ. 2010. Water quality functions of a 15-year-old riparian forest buffer system. J Am Water Resour As 46: 299-310. O’FARRELL I, LOMBARDO RJ, PINTO PT AND LOEZ C. 2002.
The assessment of water quality in the Lower Luján River (Buenos Aires, Argentina): phytoplankton and algal bioassays. Environ Pollut 120: 207–218.
PADISÁK J, ÁCS É, RAJCZY M AND KISS KT. 1991. Use of algae for monitoring rivers in Hungary. In: Whitton BA, Rott E and Friedrich G (Eds), Use of algae for monitoring rivers. Inst. Für Botanik, Uni Innsbruck, p. 123-128.
PATRICK R AND REIMER CW. 1975. The diatoms of the United States – Exclusive of Alaska and Hawaii, Philadelphia: Academy of Natural Sciences of Philadelphia. Vol. 2. Part. 1, 213 p.
PERRY CD, VELLIDIS G, LOWRANCE R AND THOMAS DL. 1999. Watershed-scale water quality impacts of riparian forest management. J Water Res Pl-Asce 125:117-125.
POOLE GC. 2002. Fluvial landscape ecology: addressing uniqueness within the river discontinuum. Freshwater Biol 47: 641-660.
REYNOLDS CS AND DAVIES PS. 2001. Sources and bioavailability of phosphorus fractions in freshwaters: a British perspective. Biol Rev 76: 27-64.
REYNOLDS CS, HUSZAR V, KRUK C, NASELLI-FLORES L AND MELO S. 2002. Towards a functional classification of the
freshwater phytoplankton. J Plankton Res 24: 417-428. RODRIGUES LC, TRAIN S, BOVO-SCOMPARIN VM, JATI S,
BORSALLI CCJ AND MARENGONI E. 2009. Interannual variability of phytoplankton in the main rivers of the Upper Paraná River floodplain, Brazil: influence of upstream reservoirs. Braz J Biol 69 (Suppl 2): 501-516. RODRIGUES SC, TORGAN L AND SCHWARZBOLD A. 2007.
Composição e variação sazonal da riqueza do phyto-plankton na foz de rios do delta do Jacuí, RS, Brasil. Acta Bot Bras 21: 707-721.
ROSSETTI G, VIAROLI P AND FERRARI I. 2009. Role of abiotic and biotic factors in structuring the metazoan plankton community in a lowland river. River Res Applic 25: 814-835.
SABATER S, BUTTURINI A, CLEMENT JC, BURT T, DOWRICK D, HEFTING M, MAÎTREV, PINAY G, POSTOLACHE C, RZEPECKI M AND SABATER F. 2003. Nitrogen removal by riparian buffers along a European climatic gradient: patterns and factors of variation. Ecosystems 6: 20-30.
SAFONOVA TA AND SHAULO SP. 2009. Phytoplankton of the
Karasuk River (West Siberia) as an Indicator of Water Quality. Contemp Probl Ecol 2: 570-575.
SALMASO N AND ZIGNIN A. 2010. At the extreme of physical gradients: phytoplankton in highly flushed, large rivers. Hydrobiologia 639: 21-36.
SHANNON CE, WEAVER W. 1963. The mathematical Theory of Communication, Illinois: University of Illinois Press, Urbana, 117 p.
SILVA CA DA, TRAIN S AND RODRIGUES LC. 2001. Estrutura e dinâmica da comunidade fitoplanctônica a jusante e montante do reservatório de Corumbá, Caldas Novas, Estado de Goiás, Brasil. Acta Sci 23: 283-290.
SOARES MCS, HUZCAR VLM AND ROLAND F. 2007.
Phytoplankton dynamics in two tropical rivers with different degrees of human impact (Southeast Brazil). River Res Applic 23: 698-714.
STRAHLER AN. 1957. Quantitative analysis of watershed geomorphology. Eos T Am Geophys Un 38: 913-920. STOREY RG AND COWLEY DR. 1997. Recovery of three New
Zealand rural streams as they pass through native forest remnants. Hydrobiologia 353: 63-76.
TAVERNINI S, PIEROBON E AND VIAROLI P. 2011. Physical factors and dissolved reactive silica affect phytoplankton community structure and dynamics in a lowland eutrophic river (Po River, Italy). Hydrobiologia 669: 213-225. TRAIN S AND RODRIGUES LC. 1998. Temporal fluctuations of
the phytoplankton community of the Baía River, in the Upper Paraná River floodplain, Mato Grosso do Sul, Brazil. Hydrobiologia 361: 125-134.
UTERMÖHL H. 1958. ZurVervollkommung der quantitativen.
Phytoplankton-Methodik. Mitteilungen der International en Vereinigung für Limnologie 9: 1-38.
VANOTTE RL, MINSHALL GW, CUMMINS KW, SEDELL JR AND CUSHING CE. 1980. The River Continuum Concept. Can J Fish Aquat Sci 37: 130-137.
VÁZQUEZ G, AKÉ-CASTILLO JA AND FAVILA ME. 2011. Algal assemblages and their relationship with water quality in tropical Mexican streams with different land uses. Hydrobiologia 667: 173-189.