Allan Motta Couto1, Thiago de Paula Protásio1*, Paulo Fernando Trugilho1, Thiago Andrade Neves1, Vânia Aparecida de Sá1
*Corresponding author: [email protected]
ABSTRACT: This research aimed to select Eucalyptus clones for bioenergy production by using of two multivariate techniques, principal component analysis and cluster analysis. The analysis evaluated 25 clones of Eucalyptus at age 54 months. Determinations included the concentrations of elemental components (C, H and O), lignin, total extractives and ash, as well as basic density, higher heating value and energy density. Both multivariate methods being used to evaluate and select clones of Eucalyptus for bioenergy production proved effective, there being similarities between the biomass groups formed by them. The cluster analysis revealed five distinct groupings, out of which cluster one, formed by clone U060, was found to have greater potential as a source of energy. Clones G084, G122, G023 and U108 had poorer energy performance.
Key words: Renewable energy, biomass, genetic selection, wood quality.
ANÁLISE MULTIVARIADA APLICADA À AVALIAÇÃO DE CLONES DE Eucalyptus PARA A PRODUÇÃO DE BIOENERGIA
RESUMO: Neste trabalho, objetivou-se selecionar clones de Eucalyptus com finalidades energéticas, utilizando as técnicas multivariadas de componentes principais e de agrupamento. Foram avaliados 25 clones de Eucalyptus aos 54 meses de idade. Foram determinados os teores dos componentes elementares (C, H e O), de lignina, extrativos totais e cinzas, a densidade básica, o poder calorífico superior e a densidade energética. As duas técnicas multivariadas empregadas para a avaliação e seleção dos clones de Eucalyptus para a produção de bioenergia foram eficientes, sendo observadas similaridades entre os grupos de biomassa formados por elas. Pela análise de agrupamento, foram obtidos cinco grupos distintos, sendo que o grupo um, formado pelo clone U060, possui maior potencial como fonte de energia. Os clones G084, G122, G023 e U108 possuem menor desempenho energético. Palavras-chave: Energia renovável, biomassa, seleção genética, qualidade da madeira.
1Universidade Federal de Lavras – Lavras, Minas Gerais, Brazil 1 INTRODUCTION
The worldwide energy industry is currently marked by a pursuit for sustainable energy resources. Biomass has gained a prominent position in such context, since, in addition to meeting sustainability requirements, it has been tipped as a potential alternative energy source if ever non-renewable resources are no longer available.
Energy derived from forest biomass is widely
used in Brazil, and that practice entails selecting genetic
materials with superior energetic potential, particularly clones and species of the genus Eucalyptus (BOTREL et al., 2007; CAIXETA et al., 2003; NEVES et al., 2011; PROTÁSIO et al., 2013; TRUGILHO et al., 2001).
However, the genus Eucalyptus comprises a myriad of genetic materials each of which having distinctive traits.
Hence the need to technically characterize such materials
so as to determine what is the most suitable application for the wood in question.
Parameters used in selection of plant biomass for energy generation typically include volume increment,
dry weight yield, basic density, concentrations of lignin, extractives, ash and holocellulose, as well as higher heating value and elemental chemical composition (C, H, N, S
and O) (LIMA et al., 2011; PROTÁSIO et al., 2011, 2012, 2013; TRUGILHO et al., 1997, 2001, 2003).
However, a common drawback of selecting genetic materials is that rarely is interest focused on one variable only. Additionally, measured variables do correlate with one another, and so they will provide a more informative
analysis if explored jointly (FERREIRA, 2008). Thus,
selection of clones of Eucalyptus for generation of bioenergy requires statistical techniques capable of
assisting with decision-making on the best material. In
this particular instance, multivariate methods are potential tools to help select best clones.
Principal component analysis (PCA) is a technique that aims to explain or model the structure of variance and covariance of a random vector composed of random variables, by constructing linear combinations of the
considered very effective in classifying multivariate data, separating distinct materials and subsequently assigning
them to predefined groups (SOUZA et al., 1990).
Cluster analysis is a method that aims to gather objects into groups based on their characteristics, in such way that elements in the same group are similar to each other while elements in different groups are heterogeneous
as to the relevant traits of interest (FERREIRA, 2008; HAIR JUNIOR et al., 2009; JOHNSON; WICHERN, 1992; MINGOTI, 2005).
This research aimed to select Eucalyptus clones for bioenergy production by using of two multivariate techniques, principal component analysis and cluster analysis.
2 MATERIAL AND METHODS
2.1 Wood sampling and analysis
Wood samples were taken from 25 clones of Eucalyptus urophylla S. T. Blakeand Eucalyptus grandis
W. Hill ex Maiden at 54 months old, originated from a
clonal experiment run by ArcelorMittal Bioenergia and situated in Martinho Campos, in the west-central region of
Minas Gerais. The site is located at latitude 19º19’S and at longitude 45º14’W and has an average annual temperature of 22ºC and accumulated annual precipitation of 1,150 mm.
Five trees were sampled per clone, each tree in one subdivision of the experimental site, to a total of 125 trees.
The trees were felled and, from the first four subdivisions,
discs 2.5 cm thick were removed from the marketable
portion of the stem at 2%, 10%, 30%, 50% and 70% of the
height, up to a diameter outside bark of 5 cm, according
to the procedure proposed by Downes et al. (1997), with an extra disc also being removed from the portion 1.30 m above ground level. In the fifth plot subdivision, discs 2.5
cm thick were removed from the base, from the portion
1.30 m above ground level and each meter from there on,
considering the marketable portion of the stem.
The clones of Eucalyptusurophylla were termed
U026, U028, U030, U034, U058, U060, U063, U073, U108, U127, U133, U260, U271, U083 and U102, while
the clones of Eucalyptusgrandis were termed G006, G008, G022, G023, G084, G094, G114, G118, G122 and G127.
The chemical, physical and energetic property analyses considered composite samples of all longitudinal positions along the stem.
Basic density (BD) was determined according to
standard NBR 11941 (ASSOCIAÇÃO BRASILEIRA DE NORMAS TÉCNICAS - ABNT, 2003). The mean basic
density of a tree was defined as the arithmetic average of
all longitudinal positions being sampled.
Extractives content (EXT) was determined according to the analytical standard M3/69 (ASSOCIAÇÃO BRASILEIRA TÉCNICA DE CELULOSE E PAPEL - ABTCP, 1974a). Insoluble lignin (Klason) was determined
according to the procedure described by Gomide and
Demuner (1986). Soluble lignin in sulfuric acid was
determined by use of spectrophotometry, according to
the guidelines set by Goldschimid (1971). Total lignin (LIG) was derived from the sum of soluble and insoluble
lignin contents.
Ash content (Ash) was determined according to
standard M11/77 (ABTCP, 1974b). Holocellulose content (HOLO) was derived from the difference between the
remaining chemical and mineral components of the sample. An elemental analysis was performed using an
Elementar universal analyzer (model Vario Micro Cube),
to quantify concentrations of carbon, hydrogen and oxygen relative to the dry weight of the wood samples, according
to Paula et al. (2011) and Protásio et al. (2011, 2013).
The samples were crushed and sieved, and the fraction
retained by a 270-mesh sieve was used for submission to
tests. Samples of each tree weighing 2 mg were thoroughly
incinerated at 1,200°C.
The higher heating value (HHV) was determined
using a IKA C-200 digital calorimeter, according to standard NBR 8633 (ABNT, 1984). The energy density
(ED) was derived by multiplying higher heating value by mean basic density.
2.2 Descriptive statistics applied to the original variables
The determination of mean, median and coefficient
of variation as well as maximum and minimum values for the traits of the clones was intended to assess biomass variability and the behavior of the original variables.
2.3 Cluster analysis
The Mahalanobis distance (D²) was used as a measure of similarity and the unweighted pair group method with
arithmetic mean (UPGMA) was used as an agglomerative
hierarchical technique in which the distance between any two clusters is taken to be the average of all distances between pairs of objects in each of the two groups
(FERREIRA, 2008). The Mahalanobis distance not only performs a normalization process but also compensates
for correlations among variables and is an alternative to
The quality of the resulting dendrogram was
evaluated by a cophenetic correlation coefficient, which
is a measure of how faithfully the dendrogam preserved the original pairwise distance matrix of the Eucalyptus clones. A multivariate analysis of variance (MANOVA) was also run using the Pillai statistic as a multivariate test with approximation of the F-distribution in order to verify
whether the newly formed clusters differed significantly as to their centroids (FERREIRA, 2008).
The multivariate analysis considered the arithmetic averages of all original variables being measured on the Eucalyptus clones.
2.4 Principal component analysis
Only mean values of each variable were used and the principal component analysis was applied considering the data correlation matrix. This procedure is equivalent
to normalizing the variables and allows greater accuracy in the analysis (MINGOTI, 2005).
The number of retained principal components was determined by a graph known as scree plot, with the principal components on the abscissa and the eigenvalues representing estimated variance on the ordinate, according
to guidelines set by Ferreira (2008).
All statistical analyzes relied on statistical software R version 2.11.0, stats package (R DEVELOPMENT CORE TEAM, 2008).
3 RESULTS AND DISCUSSION
3.1 Descriptive statistics
Table 1 illustrates the descriptive statistics used for analysis of the original variables.
Basic density was noted to show considerable variability among the clones of interest, with values
ranging between 0.471 g/cm3 and 0.619 g/cm3. Similar
results were found by Trugilho et al. (2001), whose values
of basic density ranged between 0.508 g/cm3 and 0.603
g/cm3 for different clones of Eucalyptus at 7 years old intended for charcoal production. Trugilho et al. (2003) found a mean value of 0.560 g/cm³ for ten clones of Eucalyptus, confirming the findings in this work. Basic density is the main indicator of wood quality, therefore its determination is of great importance to ensure suitable selection and assessment of genetic materials for bionergy production. The denser the wood, the greater its energy density, that is, the greater the amount of energy per unit volume and consequently the greater the charcoal yield for the same volume of furnace being used.
The greatest variability found among the clones referred to total extractives content. As far as energy generation is concerned, higher concentrations of extractives are desirable, given the positive effect of these chemical compounds on the caloric value of biomass
and on the gravimetric yield of charcoal (PROTÁSIO et al., 2012). The mean value of 4.59% differed from the result found by Trugilho et al. (1996) when studying
Eucalyptus saligna at 48 months old (3.68%). However,
Protásio et al. (2013) found a similar value (4.16%) for
clones of Eucalyptus urophylla and Eucalyptus grandis at 42 months old.
As regards total lignin content, the result found was
higher than the value reported by Trugilho et al. (1996)
(24.5%) when analyzing Eucalyptussaligna at various
ages (12, 24, 36 and 48 months old). Protásio et al. (2013)
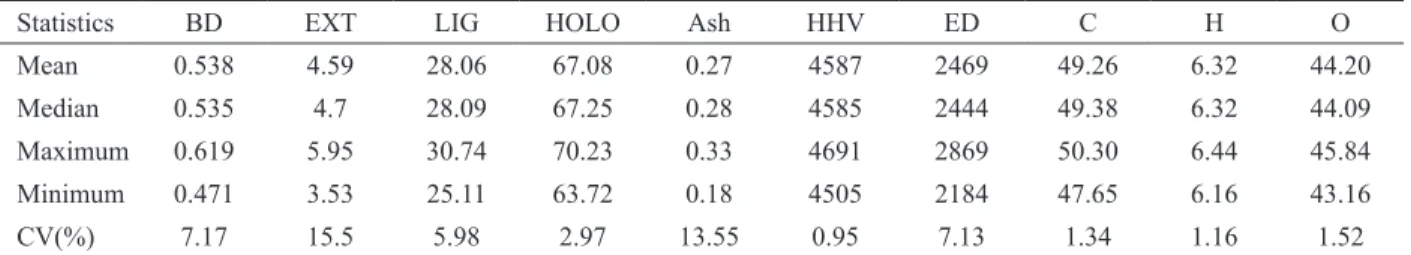
Table 1 – Descriptive statistics applied to original variables. Tabela 1 – Estatísticas descritivas aplicadas às variáveis originais.
Statistics BD EXT LIG HOLO Ash HHV ED C H O
Mean 0.538 4.59 28.06 67.08 0.27 4587 2469 49.26 6.32 44.20
Median 0.535 4.7 28.09 67.25 0.28 4585 2444 49.38 6.32 44.09
Maximum 0.619 5.95 30.74 70.23 0.33 4691 2869 50.30 6.44 45.84
Minimum 0.471 3.53 25.11 63.72 0.18 4505 2184 47.65 6.16 43.16
CV(%) 7.17 15.5 5.98 2.97 13.55 0.95 7.13 1.34 1.16 1.52
BD: basic density (g/cm³); EXT, LIG, HOLO, Ash: concentrations of total extractives, total lignin, holocellulose and ash (%) respectively; HHV: higher heating value (kcal/kg); ED: energy density (cal/cm³); C, H, O: concentrations of carbon, hydrogen and oxygen (%) respectively; CV (%): coefficient of variation (%).
found values ranging from 28.01% to 35.12% for clones
of Eucalyptus urophylla and Eucalyptus grandis at 42
months old, in contrast with the findings in this work.
Such discrepancies are probably related to age, genetic material, location and sampling factors and demonstrate the importance of such factors when selecting eucalyptus clones as a source of renewable energy.
Trugilho et al. (1996) found a decreasing tendency in lignin content up to age 48 months for wood of
Eucalyptus saligna. Also, the coefficient of variation found
was low, indicating wood homogeneity among the relevant Eucalyptus clones regarding this trait.
In assessments of biomass for charcoal production,
lignin plays an important part, as this chemical component is positively correlated with the gravimetric yield from
carbonization (PROTÁSIO et al., 2012), with higher heating value (DEMIRBAS, 2001; PROTÁSIO et al., 2012) while ensuring greater thermal stability.
As for holocellulose content, lower values are desirable when the relevant biomass is intended for bioenergy generation, since this chemical component
has an unstable, weaker profile if subjected to thermal
degradation. Therefore, the higher the holocellulose
content, the lower the charcoal yield (PROTÁSIO et al., 2012). Low variability was found among the relevant Eucalyptus clones, and the mean value (67.08%) found was similar to the result reported by Protásio et al. (2013)
for Eucalyptus clones at 42 months old (64.15%). Minerals are inorganic constituents and therefore they do not participate in the combustion process of
biomass, which means they reduce the calorific power of fuels (BRAND, 2010; PAULA et al., 2011; PROTÁSIO et al., 2011; REIS et al., 2012). A high ash content is
thus undesirable when the wood is intended for charcoal production to fuel ironworks.
Ash content values reported in literature (MORI et al., 2003; NEVES et al., 2011; PAULA et al., 2011; PROTÁSIO et al., 2011, 2013; TRUGILHO et al., 1996, 2003) for eucalyptus wood are usually low (0.07% to 1%), sustaining the findings in this work. The low ash content
values found for the Eucalyptus clones are indicative of the great potential of these genetic materials for use in energy generation.
Chemical composition directly influences the caloric value of wood, noting that, overall, higher concentrations of carbon, hydrogen, total extractives and lignin result in improved heating value. As a counterpoint, higher concentrations of minerals and oxygen tend to
reduce heating value (BRAND, 2010; DEMIRBAS, 2001, 2004; DINIZ et al., 2004; PROTÁSIO et al., 2011, 2012; REIS et al., 2012; VALE et al., 2000). According to Protásio et al. (2011), an increase of 1% in the carbon and
hydrogen content of fuels from plant biomass corresponds
to an increase of 64.14 kcal/kg and 514.75 kcal/kg in higher
heating value, indicating the huge importance of these elemental components when evaluating lignocellulosic materials.
Heating value relates to the total amount of thermal energy (heat) that is released throughout the combustion of a combustible material, therefore the higher this value is, the most suitable the resulting biomass will be for generation of bioenergy. The mean high heating value of
the tested materials was 4,587 kcal/kg, with low variation
between the clones, similarly to results found by Paula et
al. (2011) and Protásio et al. (2011, 2013) for eucalyptus
wood.
As regards energy density, the mean value found for the Eucalyptus clones was 2469 cal/cm³, close to the
result reported by Protásio et al. (2013) for Eucalyptus
grandis and Eucalyptus urophylla at 42 months old, 2380
cal/cm³. This slight variation of 3.74% relative to literature
results is probably due to the increase in basic density
with age (TRUGILHO et al., 1996), noting that energy
density was derived as the product of basic density and higher heating value.
The mean concentrations of carbon, hydrogen and oxygen were found to be similar to results reported
by Arantes (2009) for wood of an Eucalyptus grandis x
Eucalyptus urophylla hybrid at six years old (C: 49.51; O: 43.65 and H: 6.32%) and by Protásio et al. (2011) for
wood of Eucalyptus urophylla at the same age (C: 48.20; O: 45.04 and H: 6.36%).
3.2 Cluster analysis
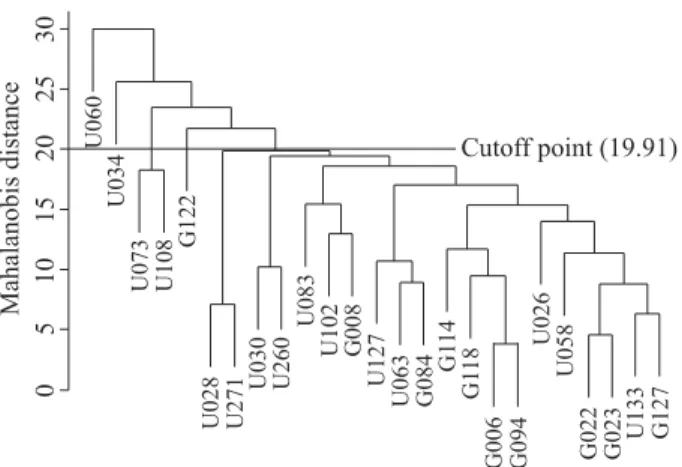
Figure 1 provides a similarity dendrogram obtained
from the cluster analysis. Results revealed a good fit
between the graphical representation and the original
distance matrix, as the cophenetic correlation coefficient was 0.68. One can thus draw inferences of interest from
visual assessment of the dendrogram.
As seen from the set cutoff point of 19.91, equivalent to 66.37% of the total distance, five distinct
groupings were formed. The multivariate analysis of variance revealed that the formed clusters differed
significantly (p < 0.0001) as to their centroids, that way
Cluster one was formed by clones U028, U030, U063, U133, U260, G008, U083, G022, G023, G084, G118, G127, U271, G094, U102, G006, U026, U058, G114, U127, cluster two was formed by clone U034, cluster three was formed by clone U060, cluster four was formed by clones U073 and U108, while cluster five was
formed by clone G122.
Table 2 provides mean values of the variables of interest for each cluster formed by the cluster analysis.
According to Trugilho et al. (1997), woods with
high basic density, low ash content, high lignin content, having thick cell wall and narrow width fibers, are responsible for improved charcoal yield and quality. According to the authors, these characteristics are considered quality indices on which to grade wood for charcoal production.
Results revealed a similarity among the five clusters
as to the higher heating value and ash content found. Cluster three had higher values of basic density, lignin, extractives, hydrogen, higher heating value and energy density, but lower holocellulose and ash contents.
These results reveal the use potential of clone U060, from cluster three, for bioenergy and/or charcoal production.
Cluster two had the second highest basic density and energy density values, the highest holocellulose content and the lowest lignin content, which could
potentially influence gravimetric yield from carbonization (PROTÁSIO et al., 2012; TRUGILHO et al., 1997) should
this clone be used for charcoal production. However, good energy yields can be expected should this genetic material be used as an energy source in thermochemical systems through the combustion of wood.
As for cluster five, despite having the highest
carbon and lignin contents and the lowest oxygen content, it had the lowest basic density and energy density, which makes the relevant clone in this cluster, G122, less suitable as a bioenergy source. However, one should evaluate parameters associated with productivity both in volume and in dry weight so as to correctly assess the energy potential of that clone.
Clusters 1 and 4 can be considered midrange as to their potential for bioenergy use, noting that cluster 4 had the lowest total extractives content.
3.3 Principal component analysis
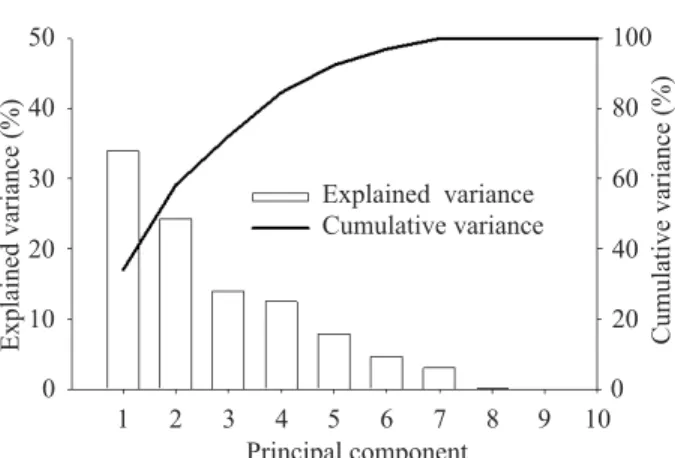
Figure 2 illustrates the explained variance and
cumulative variance of the principal components. The first three principal components explained 72% of the variance
in original data. Figure 1 – Dendrogram obtained from the cluster analysis.
Figura 1 – Dendrograma obtido pela da análise de agrupamento.
Table 2 – Mean values of the variables of interest for each cluster formed. Tabela 2 – Valores médios das variáveis analisadas em cada grupo formado.
Cluster BD LIG HOLO Ash EXT HHV ED C H O
1 0.531 27.91 67.25 0.27 4.57 4584 2434 49.43 6.33 44.03
2 0.596 25.97 68.20 0.24 5.59 4538 2705 48.95 6.30 44.36
3 0.619 30.37 63.72 0.25 5.66 4639 2870 48.13 6.43 45.28
4 0.569 28.25 67.80 0.29 3.67 4575 2602 47.82 6.18 45.76
5 0.484 30.39 64.48 0.28 4.85 4691 2273 50.30 6.42 43.17
BD: Basic density (g/cm³); EXT, LIG, HOLO, Ash: concentrations of total extractives, total lignin, holocellulose and ash (%) respectively; HHV: higher heating value (kcal/kg); ED: energy density (cal/cm³); C, H, O: concentrations of carbon, hydrogen and oxygen (%) respectively.
BD: Densidade básica (g/cm³); EXT, LIG, HOLO, Ash: teores de extrativos totais, lignina total, holocelulose e cinzas (%), respectivamente; HHV: poder calorífico superior (kcal/kg); ED: densidade energética (cal/cm³); C, H, O: teores de carbono, hidrogênio e oxigênio (%), respectivamente.
Mahalanobis distance
0
5
10
15
20
25
30
Cutoff point (19.91)
U060
U034
G122
U073 U108
U028 U271 U030 U260
U102 G008
U083
U063 G084
U127
G1
18
G1
14
G006 G094
U058
U026
Table 3 provides eigenvectors and the contribution of the original variables to the first 3 principal components.
The highest coefficients of principal component 1,
in module, were noted to relate to basic density, oxygen and energy density. That principal component can be considered a contrast between basic density, energy density and oxygen content with carbon and hydrogen contents.
In principal component 2, the highest coefficients
are related to levels of holocellulose, lignin, total extractives, basic density and energy density. The higher the levels of lignin, total extractives, basic density and energy density, and the lower the holocellulose content, the higher the scores of that component and the more suitable the biomass will be for energy or charcoal production. Principal component 2 can be thus interpreted as an index of energy quality on which to grade wood.
As regards principal component three, the highest coefficients are related to lignin content and energy density, noting that the higher the lignin content, the lower the scores of that component and the best suited the biomass will be for charcoal production and direct energy
generation. It should be also noted that energy density
made an important contribution to principal component
3. That component can be considered a contrast between
lignin content and energy density.
Figures 3 and 4 provide correlations of original
variables with principal components and scores of these latent variables. A similarity was noted between the clusters formed by the cluster analyses and principal
components 1, 2 and 3.
It was noted that clones U060 (cluster 3), U083 and U028 (cluster 1) had the highest scores for principal
component 2, therefore they are considered superior
materials for generation of bioenergy. Clones G084 and U108 (cluster 1) in turn had the lowest values for this
latent variable and thus are not recommended as a source of bioenergy.
Regarding principal component 1, it was noted that
clones U073, U108, U034, U060, U133 and U083 had the
highest scores, indicating higher values of basic density and energy density as well as higher oxygen content in
the relevant wood. Clones G122 and G023 had the lowest
scores for principal component 1 on account of higher carbon and hydrogen contents and lower mean values of basic density and energy density.
As for principal component 3, clones U034, G008, U260 and U030 were noted to have the highest scores,
mainly owing to higher values of basic density and energy
density and lower total lignin contents. Clones U073, G118
and G114 in turn had higher lignin content, resulting in
lower scores for component 3. Figure 2 – Explained variance and cumulative variance of
principal components.
Figura 2 – Variância explicada e acumulada pelas componentes principais.
Table 3 – Normalized eigenvectors of the first 3 principal components.
Tabela 3 – Autovetores normalizados das 3 primeiras componentes principais.
Variables PC1 PC2 PC3
ê1 Cont Ê2 Cont ê3 Cont Basic density 0.402 16.15 0.310 9.59 0.362 13.13 Total lignin -0.137 1.87 0.459 21.06 -0.528 27.84 Holocellulose 0.148 2.19 -0.562 31.62 0.335 11.25 Ash -0.118 1.39 0.007 0.005 0.109 1.18 Total extractives -0.086 0.74 0.492 24.24 0.297 8.81 Higher heating
value -0.154 2.38 0.079 0.62 0.092 0.85 Energy density 0.385 14.84 0.324 10.47 0.379 14.39 Carbon -0.484 23.52 0.009 0.008 0.241 5.81 Hydrogen -0.362 13.09 0.154 2.38 0.302 9.10 Oxygen 0.489 23.92 0.004 0.002 -0.276 7.63 PC1, PC2 and PC3: principal components 1, 2 and 3 respectively; ê1, ê2, ê3: eigenvectors of principal components 1, 2 and 3 respectively; Cont: contribution of original variables to the principal components (%).
PC1, PC2 e PC3: componentes principais 1, 2 e 3, respectivamente; ê1, ê2, ê3: autovetores das componentes principais 1, 2 e 3, respectivamente; Cont: contribuições das variáveis originais nas componentes principais (%).
Explained variance (%
)
50
40
30
20
10
0
Cumulative variance (%
)
100
80
60
40
20
0
1 2 3 4 5 6 7 8 9 10
Also observed was the overlap of clones U060 and U034 in relation to the clones in cluster 1 by the dispersion
of the scores of the principal components considering the same clusters formed by the cluster analysis.
4 CONCLUSIONS
Clones U060, U083 and U028 have high basic
density and energy density, high lignin and total extractives content, low holocellulose and ash content, being
considered a promising alternative for bioenergy and/ or charcoal production, not least clone U060 (cluster 3). Clones G084, G122, G023 and U108 had poorer energy
performance.
The multivariate techniques were effective in clustering the clones of interest based on their chemical, physical and energetic similarities. From the interpretation of principal component 2, it was possible to obtain an index of energy quality on which to grade wood.
Figure 3 – Correlations of original variables (a) and scores (b) of principal components 1 and 2. Figura 3 – Correlações das variáveis originais (a) e escores (b) das componentes principais 1 e 2.
Figure 4 – Correlations of original variables (a) and scores (b) of principal components 1 and 3. Figura 4 – Correlações das variáveis originais (a) e escores (b) das componentes principais 1 e 3.
Principal component 1
Principal component 2
1.0
0.5
0.0
-0.5
-1.0
4
2
0
-2
-1.0 -0.5 0.0 0.5 1.0 -4 -2 0 2 4
b a
C H
HHV Ash
LigExt
ED BD
O
Holo
Principal component 1
Principal component 3
1.0
0.5
0.0
-0.5
-1.0
2
0
-1
-2
-1.0 -0.5 0.0 0.5 1.0 -4 -2 0 2 4
b a
1
C H
Ext Holo EDBD
O
5 ACKNOWLEDGEMENTS
The authors wish to thank CNPq, Fapemig and Capes for providing financial support, ArcelorMittal Bioenergia for donating the biological material, and the
staff of the Biomaterials Multiuser Laboratory (Forest Sciences Department) of the Federal University of Lavras.
6 REFERENCES
ARANTES, M. D. C. Variação nas características da madeira e do carvão vegetal de um clone de Eucalyptus grandis W. Hill ex Maiden X Eucalyptus urophylla S.T. Blake. 2009. 149 p. Tese (Doutorado em Ciência e Tecnologia da Madeira) - Universidade Federal de Lavras, Lavras, 2009.
ASSOCIAÇÃO BRASILEIRA DE NORMAS TÉCNICAS. NBR 11941: madeira: determinação da densidade básica. Rio de Janeiro, 2003. 6 p.
ASSOCIAÇÃO BRASILEIRA DE NORMAS TÉCNICAS. NBR 8633: carvão vegetal: determinação do poder calorífico: método de ensaio.Rio de Janeiro, 1984. 13 p.
ASSOCIAÇÃO BRASILEIRA TÉCNICA DE CELULOSE E PAPEL. M3/69: métodos de ensaio. São Paulo, 1974a. 8 p.
ASSOCIAÇÃO BRASILEIRA TÉCNICA DE CELULOSE E PAPEL. M70/71: métodos de ensaio. São Paulo, 1974b. 8 p.
BOTREL, M. C. G.; TRUGILHO, P. F.; ROSADO, S. C. S.; SILVA, J. R. M. Melhoramento genético das propriedades do carvão vegetal de Eucalyptus. Revista Árvore, Viçosa,v. 31, n. 3, p. 391-398, maio/jun. 2007.
BRAND, M. A. Energia de biomassa florestal. Rio de Janeiro: Interciência, 2010. 131 p.
CAIXETA, R. P.; TRUGILHO, P. F.; ROSADO, S. C. S.; LIMA, J. T. Propriedades e classificação da madeira aplicadas à seleção de genótipos de Eucalyptus. Revista Árvore, Viçosa, v. 27, n. 1, p. 43-51, jan./fev. 2003.
DEMIRBAS, A. Relationships between heating value and lignin, moisture, ash and extractive contents of biomass fuels. Energy, Exploration & Exploitation, Hebei, v. 22, n. 2, p. 135-143, 2004.
DEMIRBAS, A. Relationships between lignin contents and heating values of biomass. Energy Conversion and Management, Oxford, v. 42, n. 2, p. 183-188, 2001.
DINIZ, J.; CARDOSO, A. L.; STAHL, J. A.; VILLETTI, M. A.; MARTINS, A. F. Poder calorífico da casca de arroz, caroço de pêssego, serragem de eucalipto e de seus produtos de pirólise. Ciência e Natura, Santa Maria, v. 26, n. 2, p. 25-32, 2004.
DOWNES, G. M.; HUDSON, I. L.; RAYMOND, C. A.; DEAN, G. H.; MICHELL, A. J.; SCHIMLECK, R.; EVANS, R.; MUNERI, A. Sampling plantation eucalypts for wood
and fibre properties. Collingwood: CSIRO, 1997. 126 p.
FERREIRA, D. F. Estatística multivariada. Lavras: UFLA, 2008. 662 p.
GOLDSCHIMID, O. Ultraviolet espectra. In: SARKANEN, K. V.; LUDWIG, C. H. (Ed.). Lignins: occurrence, formation, structure and reactions. New York: J. Wiley Interprice, 1971. p. 241-298.
GOMIDE, J. L.; DEMUNER, B. J. Determinação do teor de lignina em material lenhoso: método Klason modificado. O Papel, São Paulo, v. 47, n. 8, p. 36-38, 1986.
HAIR JUNIOR, J. F.; BLACK, W. C.; BABIN, B. J.; ANDERSON, R. E.; TATHAM, R. L. Análise multivariada de dados. Porto Alegre: Bookman, 2009. 688 p.
JOHNSON, R. A.; WICHERN, D. W. Applied multivariate statistical analysis. New Jersey: Prentice-Hall, 1992.607 p.
KENT, M.; COKER, P. Vegetation description and analysis. Baffins Lane: J. Wiley, 1992. 363 p.
LIMA, E. A.; SILVA, H. D.; LAVORANTI, O. J. Caracterização dendroenergética de árvores de Eucalyptus benthamii. Pesquisa Florestal Brasileira, Colombo, v. 31, n. 65, p. 9-17, 2011.
MINGOTI, S. A. Análise de dados através de métodos de estatística multivariada: uma abordagem aplicada. Belo Horizonte: UFMG, 2005. 297 p.
NEVES, T. A.; PROTÁSIO, T. P.; COUTO, A. M.; TRUGILHO, P. F.; SILVA, V. O.; VIEIRA, C. M. M. Avaliação de clones de Eucalyptus em diferentes locais visando à produção de carvão vegetal. Pesquisa Florestal Brasileira, Colombo, v. 31, n. 68, p. 319-330, 2011.
PAULA, L. E. R.; TRUGILHO, P. F.; NAPOLI, A.; BIANCHI, M. L. Characterization of residues from plant biomass for use in energy generation. Cerne, Lavras, v. 17, n. 2, p. 237-246, 2011.
PROTÁSIO, T. P.; BUFALINO, L.; TONOLI, G. H. D.; COUTO, A. M.; TRUGILHO, P. F.; GUIMARÃES JÚNIOR, M. Relação entre o poder calorífico superior e os componentes elementares e minerais da biomassa vegetal. Pesquisa Florestal Brasileira, Colombo, v. 31, n. 66, p. 122-133, 2011.
PROTÁSIO, T. P.; COUTO, A. M.; REIS, A. A.; TRUGILHO, P. F. Seleção de clones de Eucalyptus para a produção de carvão vegetal e bioenergia por meio de técnicas univariadas e multivariadas. Scientia Forestalis, Piracicaba, v. 42, n. 97, p. 15-28, 2013.
PROTÁSIO, T. P.; TRUGILHO, P. F.; NEVES, T. A.; VIEIRA, C. M. M. Análise de correlação canônica entre características da madeira e do carvão vegetal de Eucalyptus. Scientia Forestalis, Piracicaba, v. 40, n. 95, p. 317-326, 2012.
R DEVELOPMENT CORE TEAM. R: a language and environment for statistical computing. Vienna: R Foundation for Statistical Computing, 2008. Disponível em: <http:// www.R-project.org>. Acesso em: 10 dez. 2010.
REIS, A. A.; PROTÁSIO, T. P.; MELO, I. C. N. A.; TRUGILHO, P. F.; CARNEIRO, A. C. Composição da
madeira e do carvão vegetal de Eucalyptus urophylla em diferentes locais de plantio. Pesquisa Florestal Brasileira, Colombo, v. 32, n. 71, p. 277-290, 2012.
SOUZA, A. L.; HOSOKAWA, R. T.; KIRCHNER, F. F.; MACHADO, S. A. Análise multivariada para manejo de floresta natural na reserva florestal de Linhares Espírito Santo: análise de agrupamento e discriminante. Revista Árvore, Viçosa, v. 14, n. 2, p. 85-101, 1990.
TRUGILHO, P. F.; LIMA, J. T.; MENDES, L. M. Influência da idade nas características físico-químicas e anatômicas da madeira de Eucalyptus saligna. Cerne, Lavras, v. 2, n. 1, p. 94-111, 1996.
TRUGILHO, P. F.; LIMA, J. T.; MORI, F. A. Correlação canônica das características químicas e físicas da madeira de clones de Eucalyptus grandis e Eucalyptus urophylla. Cerne, Lavras, v. 9, n. 1, p. 66-80, 2003.
TRUGILHO, P. F.; LIMA, J. T.; MORI, F. A.; LINO, A. L. Avaliação de clones de Eucalyptus para a produção de carvão vegetal. Cerne, Lavras, v. 7, n. 2, p. 104-114, 2001.
TRUGILHO, P. F.; VITAL, B. R.; REGAZZI, A. J.; GOMIDE, J. L. Aplicação da análise de correlação canônica na
identificação de índices de qualidade da madeira de eucalipto para a produção de carvão vegetal. Revista Árvore, Viçosa, v. 21, n. 2, p. 259-267, mar./abr. 1997.
VALE, A. T.; BRASIL, M. A. M.; CARVALHO, C. M.; VEIGA, R. A. A. Produção de energia do fuste de Eucalyptus grandis Hill Ex-maiden e Acacia mangium Willd em diferentes níveis de adubação. Cerne, Lavras, v. 6, n. 1, p. 83-88, 2000.