Autor Correspondente | Corresponding Author Recebido | Received: 19/08/2011 Aprovado | Approved: 18/06/2012 Publicado | Published: dez./2012
Summary
The Word Association technique was used to analyze the perception of 120 Uruguayan consumers concerning the different types of chocolate. Similarly, it was estimated how healthy consumers perceived dark, white and milk chocolate to be. As a generic product, chocolate was associated with good taste, positive feelings, sweetness, feelings of warmth and calories/energy. White, dark and milk chocolate were significantly associated with other concepts (creaminess, bitterness, intense taste, etc.). A cluster analysis was performed on the scores regarding the perceived healthiness as reported by the consumers. 3 clusters were identified: Cluster 1 did not perceive any of the three types of chocolate to be very healthy, Cluster 2 considered dark chocolate to be very healthy but white chocolate to be less healthy and Cluster 3 perceived the three types of chocolate as very healthy. The Word Association technique enabled us to identify the differences between the associations made by each cluster.
Key words: Chocolate; Word association; Consumer studies; Qualitative techniques.
Resumo
A técnica de Associação de Palavras foi utilizada para analisar a percepção que 120 consumidores uruguaios tinham em relação a diferentes tipos de chocolate. Da mesma forma, estimou-se o quão saudável os consumidores percebiam cada tipo de chocolate: escuro, branco e ao leite. Como um produto genérico, o chocolate foi associado com bom gosto, sentimentos positivos, doçura, sensação de calor e calorias/energia. Chocolates dos tipos branco, escuro e ao leite foram significativamente associados com outros conceitos (cremosidade, amargura, sabor intenso, etc.). Uma análise de agrupamento foi realizada na pontuação em relação à saudabilidade percebida, reportada pelos consumidores. Três grupos foram identificados: Grupo 1 - não percebem qualquer um dos três tipos de chocolate como sendo muito saudável; Grupo 2 - consideram o chocolate escuro como muito saudável e o chocolate branco foi considerado como menos saudável; Grupo 3 - percebem os três tipos de chocolate como muito saudáveis. A técnica de Associação de Palavras permitiu identificar as diferenças entre as associações feitas por cada grupo.
Palavras-chave: Chocolate; Associação de palavras; Estudos de consumo; Técnicas qualitativas.
Autores | Authors
Adriana GÁMBARO Universidad de la República (UdelaR) Departamento de Ciencia y Tecnología de
Alimentos Facultad de Química Sección Evaluación Sensorial Gral. Flores, 2124, CP: 11800
Montevideo - Uruguay e-mail: [email protected]
Ana Claudia ELLIS Universidad de la República (UdelaR) Departamento de Ciencia y Tecnología de
Alimentos Facultad de Química Sección Evaluación Sensorial Montevideo - Uruguay e-mail: [email protected]
1 Introduction
Different types of chocolate can be found on the Uruguayan market, usually obtained from a mixture of cocoa powder or ‘mass’ blended with cocoa butter and cocoa liquor in varying quantities. The basic types are as follows: milk chocolate (containing sugar, milk or milk powder, cocoa powder, cocoa liquor, cocoa butter, lecithin and vanilla), white chocolate (without cocoa powder) and dark chocolate (without milk or milk powder) (BECKETT, 2004).
Much research has been carried out showing the beneficial effects of the consumption of dark chocolate on human health, mainly due to the high content of polyphenols present in cocoa powder. Cocoa flavonoids have been reported to have specific cardio protective effects, including a decrease in low-density lipoprotein (LDL) oxidation, increase in high-density lipoprotein (HDL) levels, inhibition of platelet activation and aggregation, and anti-inflammatory properties (DING et al., 2006). Shiina et al. (2007) found that the intake of flavonoid-rich dark chocolate significantly improved coronary circulation in healthy adults, whereas non-flavonoid white chocolate did not have such effects. Other researchers reported that cocoa reduced blood pressure and insulin resistance and improved endothelium-dependent vasodilation in hypertensive individuals (GRASSI et al., 2005).
On the other hand, chocolate contains several psychoactive components that affect our central nervous system, such as phenyl-ethanolamine (which stimulates the release of mesolimbic dopamine into our pleasure centres) and methylxanthines (caffeine, theobromine and theophylline). These psycho-pharmacologically active ingredients can explain the positive effects of the consumption of chocolate, such as sensory pleasure and energy (SMIT et al., 2004). Chocolate has been shown to be craved and consumed during depressive moods (MacDIARMID e HETHERINGTON, 1995; WILLNER et al., 1998; WANSIK et al., 2003). Macht and Dettmer (2006) studied the emotional changes triggered in German women after eating a chocolate bar and an apple. They found that both chocolate and apples reduced hunger, improved the mood and increased activation, but the effects of chocolate intake were stronger. In order to improve the knowledge of the causes and consequences of chocolate consumption, Benton et al. (1998) developed the Attitudes to Chocolate Questionnaire, which has been used more recently by other researchers (CRAMER and HARTLEIB, 2001; MÜLLER et al., 2008). This research was carried out on chocolate as a generic product, and no distinction was made between the different types of chocolate in terms of consumer perception.
Word association is a qualitative technique commonly used in psychology and sociology (HIRSH and TREE, 2001; ROSS, 2003; HOVARDAS and KORFIATIS,
2006) that has recently been applied to the understanding of consumer perception concerning food products (ROININEN et al., 2006; ARES et al., 2008). According to the Ajzen and Fishbein Theory (1980), if a conceptual stimulus or object is provided to consumers and they are requested to freely associate the ideas that come to their minds, a relatively unrestricted access to the mental representations produced by the given stimulus is likely to be obtained. It has been stated that the ideas expressed using a word association procedure are spontaneous productions subject to fewer constraints than those typically imposed during interviews or during the performance of closed questionnaires. For food products, the first associations that come to the consumers’ minds were those most relevant in the selection and decision making process that the purchase of the food product entails (ROININEN et al., 2006).
The aims of the present work were: (a) to gather information about the perceptions of Uruguayan consumers concerning milk, dark and white chocolate using a Word Association technique, and (b) to estimate how healthy the consumer perceives these three types of chocolate to be.
2 Material and methods
2.1 Participants
The study was carried out in the city of Montevideo, Uruguay. A total of 120 consumers were randomly recruited in shopping areas, universities, restaurants and other public places. The sample included 60 female (50%) and 60 male (50%) participants, ranging from 18 to 60 years of age (mean 33, SD 14). Taking into account the areas where the participants were recruited, the sample was assumed to represent the general Uruguayan middle income groups.
Participants were given cards and an evaluation sheet and asked to fill in the questionnaire on their own at the recruitment site, in order to minimize the influence of the interviewer’s participation.
2.2 Consumer study
In this study, the target stimuli were the names of the different types of chocolate, printed on a card. Each of the respondents received 4 cards, and they had to evaluate them one at a time. In all cases, the first card received included the term “chocolate”, after which they received three random cards with the terms “white chocolate”, “dark chocolate” and “milk chocolate” printed on them. The respondents were asked to write down the first four images, associations, thoughts or feelings that came into their minds. (GÁMBARO et al., 2011).
9-box scale labelled “not healthy at all” on the left and “very healthy” on the right (ARES and GÁMBARO, 2007).
Finally the participants answered a few questions regarding their personal background such as age, gender and frequency of chocolate consumption (“How often do you consume chocolate? Usually – several times a week; or Seldom – several times a month or less”).
2.3 Data analysis
2.3.1 Cluster analysis
In order to identify possible groups of consumers with different perceptions regarding the healthiness of the different types of chocolate, a hierarchical cluster analysis was carried out on the scores. Euclidean distances and the Ward’s aggregation method were considered.
The existence of differences between the age, gender and frequency of chocolate consumption between the clusters was evaluated using the χ2statistical test.
The Pearson’s chi-squared test allows one to test the independence between the rows and the columns of the table by measuring to what extent the observed table is far (in the chi-squared sense) from the expected table computed using the same marginal sums.
2.3.2 Analysis of variance
The analysis of variance (ANOVA) was applied to the data concerning the perceived healthiness of the different types of chocolate, considering the cluster as a fixed variation source. The ANOVA model considered in the present study was the following:
Y = mean + main effects for cluster + main effects for type of chocolate + interaction between cluster and type of chocolate + random error.
Only significant differences were calculated using Tukey’s test. Differences were considered significant when p ≤ 0.05.
2.3.3 Analysis of elicited words
The elicited associations were analysed qualitatively. First, recurrent terms within each type of chocolate were searched for. Terms with similar meaning were grouped in different categories for each type of chocolate. This classification was performed manually by two researchers who considered synonymous words. After individually evaluating the data, the researchers met and discussed the level of agreement between their classifications. Categories mentioned by more than 10% of the consumers were considered acceptable, and the frequencies for each category were determined by counting the number of consumers that used similar words to describe the concept. The associations suggested for the different types of chocolate were then compared and merged into 11 categories according to their similar meanings
and labelled. A Chi-squared formula was calculated to evaluate the differences in consumer perception regarding the types of chocolate.
2.3.4 Correspondence analysis
A Correspondence Analysis was applied to visualize the relationship between concepts and categories for each of the clusters identified. Correspondence analysis is a descriptive/exploratory technique designed to analyze simple two-way contingency tables containing some degree of correspondence between the rows and columns. Row and column variables were spatially represented using this technique, allowing for a visual representation of the data (TENKEIJ and MUSTERS, 2003; GREENACRE, 2010)
All statistical analyses were performed using XL-Stat 2009 (ADDINSOFT, 2009).
3 Results and discussion
3.1 Cluster analysis
The hierarchical cluster analysis identified three groups of consumers that scored the perceived healthiness of milk, dark and white chocolate differently: Cluster 1 with 52 participants, Cluster 2 with 34 participants and Cluster 3 with 34 participants.
As shown in Table 1, Cluster 1 perceived the three types of chocolate as not very healthy, but also perceived white chocolate as the least healthy of the three. On the other hand, Cluster 3 perceived the three types of chocolate as very healthy, but also perceived white chocolate and milk chocolate as healthier. Cluster 2 considered dark chocolate as the healthiest, followed by milk chocolate, whereas white chocolate was perceived as not very healthy. If one looks at the beneficial effects of the three types of chocolate on human health as a result of the high content of polyphenols present in cocoa powder, Cluster 2 was the group whose perception of healthiness was the closest to reality. This is because dark chocolate has the highest percentage of cocoa powder, whereas white chocolate has none at all.
Table 1. Average scores for the perceived healthiness awarded by each of the three clusters identified.
Cluster 1 (n = 52)
Cluster 2 (n = 34)
Cluster 3 (n = 34)
White chocolate 3.2Bb 3.5Cb 7.4Aa
Dark chocolate 4.2Ac 7.9Aa 6.7Bb
Milk chocolate 4.4Ac 6.6Bb 8.0Aa
Means in the same column with different capital superscripts are significantly different according to Tukey’s test (p ≤ 0.05). Means in
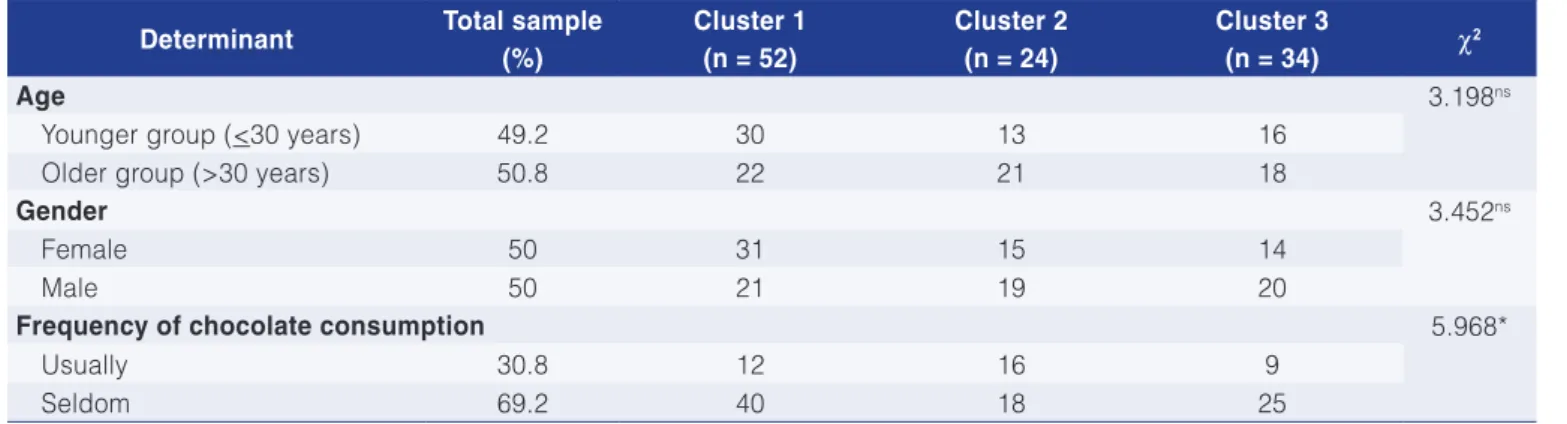
As shown in Table 2, the clusters differed significantly (p ≤ 0.05) in terms of their distribution of
chocolate consumption frequency.
Clusters 1 and 3 mainly consisted of occasional consumers (77% and 74% respectively). Cluster 2 consisted of 47% usual consumers and 53% occasional consumers. This suggests that frequent consumers had a perception closer to reality than occasional consumers. This perception of healthiness could increase product consumption and shows the influence of nutritional information on consumer dietary habits.
3.2 Word association
Table 3 shows the categories associated with each of the types of chocolate evaluated, as well as examples of individual associations.
The participants’ associations with chocolate were mainly related to taste (“tasty”, “delicious”) (69%), positive feelings related to love and family (35%) and sweetness, this being the only sensory attribute mentioned several times (42%). Besides this, an important number of associations mentioned the feelings of warmth produced
by chocolate (25%) and its energetic value (21%). To a lesser degree, associations related to chocolate’s creaminess and bitterness were observed (12%). There was no reference to disliking chocolate and very few references to sensory defects, such as the chocolate being greasy, buttery or overly sweet.
On one hand, these results agreed with the findings of Macht and Dettmer (2006) who found that chocolate induced emotionally positive effects. However, feelings of guilt were found by other authors (MACHT and DETTMER, 2006; MÜLLER et al., 2008) regarding slimness and body weight and based on cultural attitudes not found in our study. Only 21% of the participants mentioned chocolate as an energetic product that induced weight gain.
The consumer associations were substantially different (χ2 = 275.3, p < 0.001) in the case of white
chocolate. The number of references related to good taste, positive feelings, sensation of warmth and calories decreased considerably. The number of references regarding bitterness also decreased. On the other hand, references to creaminess, texture and flavour defects increased sharply and an important number of references to an unpleasant taste (disgusting, horrible)
Table 2. Socio-demographic determinants of the sample.
Determinant Total sample
(%)
Cluster 1 (n = 52)
Cluster 2 (n = 24)
Cluster 3
(n = 34) χ2
Age 3.198ns
Younger group (<30 years) 49.2 30 13 16
Older group (>30 years) 50.8 22 21 18
Gender 3.452ns
Female 50 31 15 14
Male 50 21 19 20
Frequency of chocolate consumption 5.968*
Usually 30.8 12 16 9
Seldom 69.2 40 18 25
*Significant differences (p ≤ 0.05). nsNo significant differences (p > 0.05).
Table 3. Results of the word association task; Number of mentions for each of the categories identified.
Category Examples of individual
associations Chocolate
White chocolate
Dark chocolate
Milk chocolate
(1) Calories/Energy Caloric, energetic, generates weight gain 25 8 10 10 (2) Positive feelings Love, friendship, family, home, childhood 42 20 21 38 (3) Taste I like it, tasty, delicious 83 46 48 64 (4) Feelings of warmth Warm, cold days, winter 30 12 24 34
(5) Sweetness Sweet 50 43 1 33
(6) Bitterness Bitter 14 0 24 3
(7) Creaminess Creamy, Soft 14 29 2 44
(8) Dislike Disgusting, I don’t like it, horrible 0 30 39 2
(9) Texture defects Greasy, buttery, 2 13 2 1
(10) Flavour defects Too sweet, overly-sweet 3 23 2 4
also appeared. This shows that white chocolate was perceived by participants as a creamy, greasy and overly sweet product.
Consumer associations were also significantly different (χ2 = 101.2, p < 0.001) in the case of dark
chocolate. As for white chocolate, the references regarding good taste, positive feelings and calories decreased, except for the case of the references regarding the warmth produced by chocolate. Similarly, references to creaminess and sweetness also dropped. On the other hand, references to product bitterness and intense taste rose. Thus it can be seen that dark chocolate was perceived as a bitter and intensely flavoured product that produces warmth but that part of the participants disliked.
The associations of the participants with milk chocolate were mainly related to good taste, positive feelings, sweetness and warmth, but there were less references to good taste and sweetness for each category. A noticeable increase in creaminess (χ2 = 93.8, p < 0.001)
Table 5. Differences in the associations of the clusters with white chocolate.
Category Cluster 1 Cluster 2 Cluster 3
Calories/Energy 5 1 2 Positive feelings 6 4 10
Taste 21 8 17
Feelings of warmth 5 3 4
Sweetness 19 9 15
Bitterness 0 0 0
Creaminess 12 8 9
Dislike 14 13 3
Texture defects 7 5 1 Flavour defects 12 9 2
Intense taste 0 0 0
χ2 = 45.61. p < 0.0000.
Table 4. Differences in the associations of the clusters with chocolate.
Category Cluster 1 Cluster 2 Cluster 3
Calories/Energy 10 8 7 Positive feelings 20 10 12
Taste 35 23 25
Feelings of warmth 9 11 10
Sweetness 25 10 15
Bitterness 7 4 3
Creaminess 7 3 4
Dislike 0 0 0
Texture defects 1 1 0 Flavour defects 2 1 0
Intense taste 0 0 0
χ2 = 13.29ns. p = 0.3485
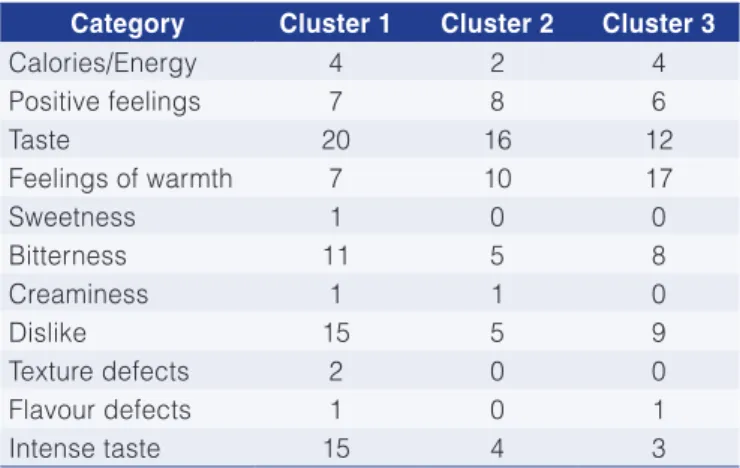
Table 6. Differences in the associations of the clusters with dark chocolate.
Category Cluster 1 Cluster 2 Cluster 3
Calories/Energy 4 2 4 Positive feelings 7 8 6
Taste 20 16 12
Feelings of warmth 7 10 17
Sweetness 1 0 0
Bitterness 11 5 8
Creaminess 1 1 0
Dislike 15 5 9
Texture defects 2 0 0 Flavour defects 1 0 1
Intense taste 15 4 3
χ2 = 27.38. p = 0.0068
could be seen, and fewer references to the caloric value of milk chocolate. This type of chocolate showed fewer references to creaminess (37%) and feelings of warmth (28%).
Tables 4-7 show the differences between the associations made by the three clusters with each type of chocolate.
No significant differences were found between the associations made by the clusters regarding chocolate and milk chocolate, suggesting that the three clusters perceived these products similarly. Even though the three clusters had different perceptions of the healthiness of the different types of chocolate, they did not differ much in their associations related to chocolate as a generic product or about milk chocolate, despite the fact that Cluster 3 considered milk chocolate as a healthy product and Cluster 1 considered it less healthy. These results show that the Word Association technique does not seem to be complete enough to thoroughly understand the consumer perceptions of food products.
Table 7. Differences in the associations of the clusters with milk chocolate.
Category Cluster 1 Cluster 2 Cluster 3
Calories/Energy 4 2 4 Positive feelings 16 10 12
Taste 29 17 18
Feelings of warmth 10 13 11
Sweetness 14 10 9
Bitterness 1 1 1
Creaminess 23 12 9
Dislike 1 1 0
Texture defects 1 0 0 Flavour defects 2 2 0
Intense taste 0 0 0
On the other hand, participants in the three clusters perceived white chocolate and dark chocolate in significantly different ways, as shown in Tables 5 and 6. Cluster 3 participants did not associate white chocolate with poor taste, texture and flavour defects as much as participants from Clusters 1 and 2 did, and they associated it with more positive feelings. Participants from Cluster 2 did not associate white chocolate with good taste and sweetness as much as participants from the other two Clusters did.
Similarly, participants from Cluster 1 associated dark chocolate more frequently with poor taste, bitterness and an intense taste, even though there were more
associations with good taste than in the other two clusters. This can be explained by the fact that participants from Cluster 1 associated dark chocolate with sensory aspects such as bitterness and intense taste, which could be pleasant to some participants but not to others.
3.3 Correspondence analysis
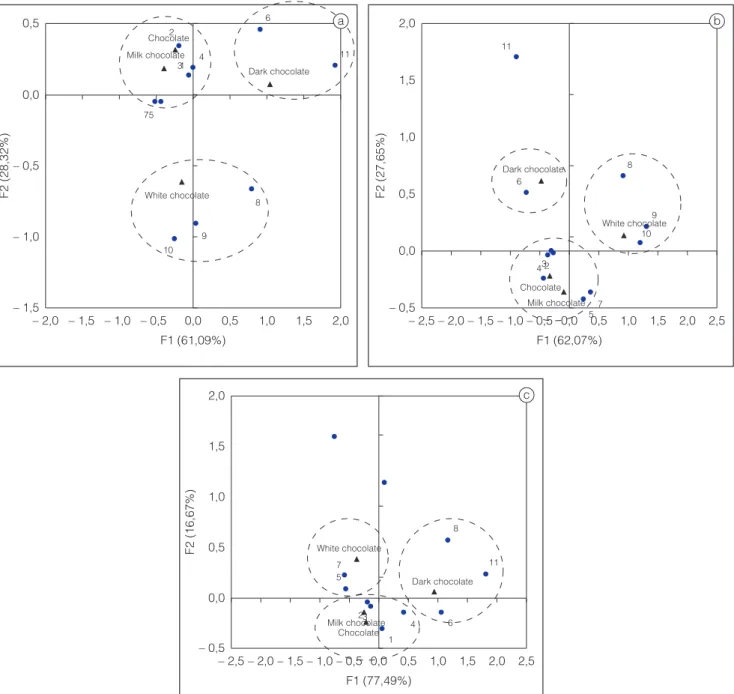
As mentioned above, a correspondence analysis was used to visualize the relationships between the products and the associations and the resulting perceptual maps for each Cluster are shown in Figure 1. The first two dimensions of the correspondence analysis
Figure 1. Correspondence analysis plots for the categories associated with the different types of chocolate during the word association activity for participants in Cluster 1 (a), Cluster 2 (b) and Cluster 3 (c).
a b
explained 89.4%, 89.7% and 94.2% of the variability of the experimental data for Cluster 1, 2 and 3, respectively.
These maps show the above mentioned differences between the products and the clusters. For Cluster 1 participants (Figure 1a), the three types of chocolate were divided into three categories: one for chocolate and milk chocolate, another for white chocolate and another for dark chocolate. These groups of products were associated with different categories which consisted of different attributes relevant to the consumers and their motivations for consuming them. This analysis shows that in the consumers’ minds the concept of chocolate as a generic product was associated with milk chocolate, and the concept of chocolate being an energetic product that produces a feeling of warmth and good taste was associated with positive feelings and positive sensory attributes such as sweetness and creaminess. Also white chocolate was associated with sensory defects in texture and taste. Dark chocolate was mainly associated by this Cluster with sensory attributes of bitterness and intense flavour. If one considers that Cluster 1 perceived chocolate as a less healthy product, one can infer that even though positive feelings were found regarding milk chocolate in this Cluster, the fact that it was perceived as energetic and providing calories made it less healthy. For white and dark chocolate, the associations did not explain the perceptions of these types of chocolate as being less healthy and generating negative sensory attributes, such as greasiness and excessive sweetness in white chocolate, and bitterness in dark chocolate.
For the participants of Cluster 2 the types of chocolate evaluated were also separated into three groups (Figure 1b), and they showed associations very similar to those of the participants in Cluster 1 for chocolate and milk chocolate. Dark chocolate did not receive any strong associations with intensive flavour and bitterness. One can see stronger associations for white chocolate with feelings of dislike (“I don´t like it, it is horrible”) and with sensory flaws in the texture and flavour. If one takes into account that this Cluster only considered white chocolate to be less healthy, one can reinforce the idea that this perception brings negative associations into the consumers’ minds. This Cluster was integrated by a greater number of frequent chocolate consumers who perceived dark chocolate as the healthiest of the three, and for this Cluster the association of dark chocolate with bitterness had no influence on their perception of it being healthy.
The participants in Cluster 3 also separated the types of chocolate into three groups, but showed different associations to those of the other Clusters (Figure 1c). White chocolate was mainly associated with sensory attributes of sweetness and creaminess and black chocolate with feelings of dislike, bitterness and intense
flavour. One can infer that the sensory attributes associated in the consumers’ minds had a positive influence on the acceptance of white chocolate and a negative influence on the acceptance of dark chocolate. Considering that this Cluster was the only one which perceived white chocolate as very healthy, one can again see a relationship between the sensory attributes associated in the consumers’ minds and their perception of the product being healthy.
4 Conclusions
Word association was found to be an easy and quick methodology for gathering useful information about consumer perceptions of a food product. This methodology can allow for the identification of attributes that are relevant to consumer acceptance of a product, common product flaws in the marketplace, reasons behind consumer choices and attributes that might have decreased consumer interest in the product.
In addition, word association was useful to study the differences between three groups of consumers with different perceptions regarding how healthy the different types of chocolate were. The results of this study also showed that the word association technique was not complete enough to thoroughly understand consumer perception regarding the food products, and needs to be supplemented by other techniques in order to enable one to elicit more accurate information.
References
ADDINSOFT. XLStat. version 2009.4.02. New York: Addinosoft, 2009. Disponível em: <www.xlstat.com>.
AJZEN, I.; FISHBEIN, M. Understanding Attitudes and Predicting Behaviour. Englewood Cliffs: Prentice-Hall. Inc., 1980. 278 p.
ARES, G.; GÁMBARO, A. Influence of gender, age and motives underlying food choice on perceived healthiness and willingness to try functional foods. Appetite, Oxford, v. 49, n. 1, p. 148-158, 2007. http://dx.doi.org/10.1016/j.appet.2007.01.006
ARES, G.; GIMÉNEZ, A.; GÁMBARO, A. Understanding consumers’ perceptions of conventional and functional yoghurts using word association and hard laddering. Food Quality and Preference, Oxford, v. 19, n. 7, p. 636-643, 2008. http://dx.doi. org/10.1016/j.foodqual.2008.05.005
BECKETT, S. The Science of Chocolate. Cambridge: The Royal Society of Chemistry, 2004. 175 p.
BENTON, D.; GREENFIELD, K.; MORGAN, M. The development of the attitudes to chocolate questionnaire. Personality and Individual Differences, Oxford, v. 24, n. 4, p. 513-520, 1998. http://dx.doi.org/10.1016/S0191-8869(97)00215-8
Individual Differences, Oxford, v. 31, n. 6, p. 931-942, 2001. http://dx.doi.org/10.1016/S0191-8869(00)00195-1
DING, E. L.; HUTFLESS, S. M.; DING, X.; GIROTA, S. Chocolate and prevention of cardiovascular disease: a systematic review.
Nutrition & Metabolism, London, v. 3, n. 2, p. 2-12, 2006. http:// dx.doi.org/10.1186/1743-7075-3-2
GÁMBARO, A.; DAUBER, C.; ARES, A.; ELLIS, A. C. Studying Uruguayan consumer’s perception of vegetales oils using Word Association. Brazilian Journal of Food Technology, Campinas, v. 14, Special Issue, p. 131-139, 2011, p. 131-139, 2011. http:// dx.doi.org/10.4260/BJFT201114E000116
GRASSI, D.; NECOZIONE, S.; LIPPI, C. Cocoa reduces blood pressure and insulin resistance and improves endothelium-dependent vasodilatation in hypertensives. Hypertension, Dallas, v. 46, n. 2, p. 398-405, 2005. http://dx.doi.org/10.1161/01. HYP.0000174990.46027.70
GREENACRE, M. Correspondence Analysis. International Encyclopedia of Education (Third Edition), New York, v. 8, p. 103-111, 2010. http://dx.doi.org/10.1016/B978-0-08-044894-7.01317-8
HIRSH, K. W.; TREE, J. J. Word association norms for two cohorts of British adults. Journal of Neurolinguistics, Oxford, v. 14, n. 1, p. 1-44, 2001. http://dx.doi.org/10.1016/S0911-6044(00)00002-6
HOVARDAS, T.; KORFIATIS, K. J. Word associations as a tool for assessing conceptual change in science education. Learning and Instruction, Oxford, v. 16, n. 5, p. 416-132, 2006. http:// dx.doi.org/10.1016/j.learninstruc.2006.09.003
MACDIARMID, J. I.; HETHERINGTON, M. M. Mood modulation by food: An exploration of affect and cravings in “chocolate addicts”.
British Journal of Clinical Psychology, Malden, v. 34, n. 1, p. 129-138, 1995. http://dx.doi.org/10.1111/j.2044-8260.1995. tb01445.x
MACHT, M.; DETTMER, D. Everyday mood and emotions after eating a chocolate bar or an apple. Appetite, Oxford, v. 46, n. 3, p. 332-336, 2006. http://dx.doi.org/10.1016/j.appet.2006.01.014
MÜLLER, J.; DETTMER, D.; MACHT, M. The Attitudes to Chocolate Questionnaire: Psychometric properties and
relationship to dimensions of eating. Appetite, Oxford, v. 50, n. 2-3, p. 499-505, 2008. http://dx.doi.org/10.1016/j. appet.2007.10.008
ROININEN, K.; ARVOLA, A.; LÄHTEENMÄKI, L. Exploring consumers’ perceptions of local food through two different qualitative techniques: Laddering and word association. Food Quality and Preference, Oxford, v. 17, n. 1-2, p. 20-30, 2006. http://dx.doi.org/10.1016/j.foodqual.2005.04.012
ROSS, T.P. The reliability of cluster and switch scores for the controlled oral word association test. Archives of Clinical Neuropsychology, Oxford, v. 18, n. 2, p. 153-164, 2003. http:// dx.doi.org/10.1016/S0887-6177(01)00192-5
SHIINA, Y.; FUNABASHI, N.; LEE, K.; MURAYAMA, T.; NAKAMURA, K.; WAKATSUKI, Y.; DAIMON, M.; KOMURO, I. Acute effects of oral flavonoid-rich dark chocolate intake on coronary circulation, as compared with non-flavonoid white chocolate, by transthoracic Doppler echocardiography in healthy adults. International Journal of Cardiology, Oxford, v. 131, n. 3, p. 424-429, 2007. http://dx.doi.org/10.1016/j.ijcard.2007.07.131
SMIT, H. J.; GAFFAN, E. A.; ROGERS, P. J. Methylxanthines are the psycho-pharmacologically active constituents of chocolate. Psychopharmacology, Heidelberg, v. 176, n. 3-4, p. 412-419, 2004. http://dx.doi.org/10.1007/s00213-004-1898-3
TEN KLEIJ, F.; MUSTERS, P. A. D. Text analysis of open-ended survey responses: A complementary method to preference mapping. Food Quality and Preference, Oxford, v. 14, n. 1, p. 43-52, 2003. http://dx.doi.org/10.1016/S0950-3293(02)00011-3
WANSIK, B.; CHENEY, M. M.; CHAN, N. Exploring comfort food preferences across age and gender. Physiology and Behavior, Oxford, v. 79, n. 4-5, p. 739-747, 2003. http://dx.doi.org/10.1016/ S0031-9384(03)00203-8