CHEMOMETRIC ANALYSIS OF METAL CONTENTS IN DIFFERENT TYPES OF CHOCOLATES
Lidija R. Jevrić*, Sanja O. Podunavac-Kuzmanović, Jaroslava V. Švarc-Gajić, Strahinja Z. Kovačević
University of Novi Sad, Faculty of Technology Novi Sad, Bulevar cara Lazara 1, 21 000 Novi Sad, Serbia The relationships between the contents of various metals (Cu, Ni, Pb and Al) in 38 different milkchocolate samples were studied using a chemometric approach. The che-mometric expressions were generated using a training set of 25 chocolate samples and the predictive ability of the resulting models was evaluated against a test set of 13 cho-colate samples. The chemometric analysis was based on the application of multiple linear regression analysis (MLR). MLR was performed in order to select the significant models for predicting the metal contents. The MLR equations that represent the content of one metal as a function of the contents of other metals were established. High agreement between experimental and predicted values, obtained in the validation procedure, indica-ted the good quality of the models. It enables the researchers to establish reliable rela-tionships between the contents of various metals which can be used for their prediction in different types of chocolate prior to their analysis. This can reduce the trial-and-error element and experimental costs in the production.
KEY WORDS: chocolate, multiple linear regression, chemometrics
INTRODUCTION
Chemometrics is considered part of analytical chemistry. In its arsenal, we can find methods that help analytical chemists to deal with all steps of analytical procedures, star-ting from the design of an experiment through extraction of information to the final deci-sion making. A majority of chemometrics methods are of a general purpose (i.e. they can be applied to any type of analytical experiment and to any type of instrumental signal). However, there are problems associated with specific types of instrumental signals or with particular analytical techniques that need special treatment. Only with the knowled-ge of the system studied and of the principles of the measurements performed one can choose a well-suited method. Statistics, of course, plays a major role in chemometrics. Statistical approaches are based on mathematical theory, so statistics falls between ma-thematics and chemometrics. Computing is important as much of chemometrics relies on
software. However, chemometrics is not really computer science. Engineers, especially chemical and process engineers, have a profound need for chemometric methods in many areas of their work, and have a quite different perspective from the mainstream chemists (1-3).
Multiple linear regression (MLR) is a widely applied chemometric method for regres-sion and classification purposes. MLR presents an extenregres-sion of a simple linear regresregres-sion and it has to quantify the relationships between more independent variables and a depen-dent variable (4). Chemometric analysis was applied on various milk chocolate to model the relationships between the contents of different metals present in chocolate samples. The MLR method was used to derive reliable models for predicting the metals contents. High agreement between the experimental and predicted values, obtained in the valida-tion procedure, indicated the good quality of the models. The applicavalida-tion of the presented high-quality networks can significantly reduce the analysis time of metal contents in the analyzed samples.
EXPERIMENTAL
Materials and methods
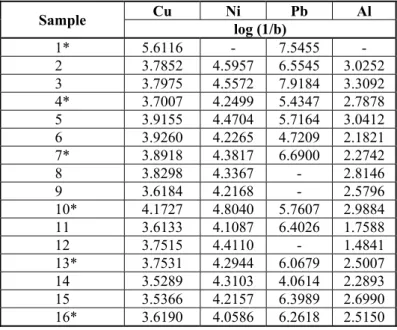
To describe the relationships in a set of the metal contents in 38 different milk choco-late samples (Table 1), use was made of MLR as the most frequently used chemometric multivariate method (5-8).
Table 1. Content of the metals in the analyzedchocolate samples
Sample Cu Ni Pb Al
log (1/b)
1* 5.6116 - 7.5455 -
2 3.7852 4.5957 6.5545 3.0252 3 3.7975 4.5572 7.9184 3.3092 4* 3.7007 4.2499 5.4347 2.7878 5 3.9155 4.4704 5.7164 3.0412 6 3.9260 4.2265 4.7209 2.1821 7* 3.8918 4.3817 6.6900 2.2742
8 3.8298 4.3367 - 2.8146
9 3.6184 4.2168 - 2.5796
10* 4.1727 4.8040 5.7607 2.9884 11 3.6133 4.1087 6.4026 1.7588
12 3.7515 4.4110 - 1.4841
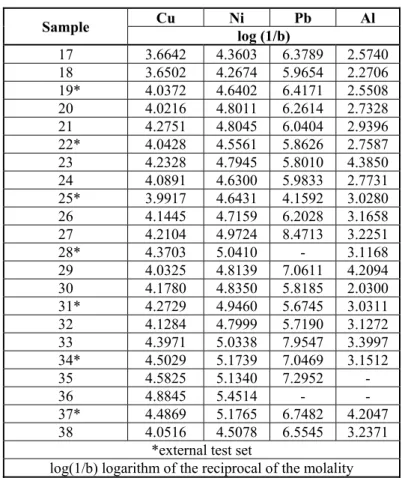
Table 1. Continuation
Sample Cu Ni Pb Al
log (1/b)
17 3.6642 4.3603 6.3789 2.5740 18 3.6502 4.2674 5.9654 2.2706 19* 4.0372 4.6402 6.4171 2.5508 20 4.0216 4.8011 6.2614 2.7328 21 4.2751 4.8045 6.0404 2.9396 22* 4.0428 4.5561 5.8626 2.7587 23 4.2328 4.7945 5.8010 4.3850 24 4.0891 4.6300 5.9833 2.7731 25* 3.9917 4.6431 4.1592 3.0280 26 4.1445 4.7159 6.2028 3.1658 27 4.2104 4.9724 8.4713 3.2251
28* 4.3703 5.0410 - 3.1168
29 4.0325 4.8139 7.0611 4.2094 30 4.1780 4.8350 5.8185 2.0300 31* 4.2729 4.9460 5.6745 3.0311 32 4.1284 4.7999 5.7190 3.1272 33 4.3971 5.0338 7.9547 3.3997 34* 4.5029 5.1739 7.0469 3.1512
35 4.5825 5.1340 7.2952 -
36 4.8845 5.4514 - -
37* 4.4869 5.1765 6.7482 4.2047 38 4.0516 4.5078 6.5545 3.2371
*external test set
log(1/b)logarithm of the reciprocal of the molality
Model validation
The MLR analysis was carried out by the NCSS&GESS and Statistica v. 10.0 softwa-re. In the established MLR models multicollinearity has to be avoided. The established MLR models have to be statistically valid. Validation of the developed mathematical mo-dels is an important aspect of any chemometrics study (9). Once a model is obtained, it is necessary to determine its reliability and statistical significance. As internal validation, in the case of MLR a leave-one-out (LOO) cross-validation method was applied.
Instrumentation
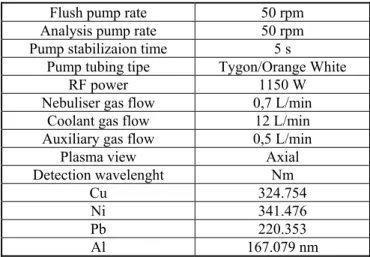
given in Table 2. The emission lines for each element were based on the tables of known interferences, baseline shifts and experience in work with different samples.
Table 2. Operational ICP-OES parametars
Flush pump rate 50 rpm Analysis pump rate 50 rpm Pump stabilizaion time 5 s
Pump tubing tipe Tygon/Orange White
RF power 1150 W
Nebuliser gas flow 0,7 L/min Coolant gas flow 12 L/min Auxiliary gas flow 0,5 L/min Plasma view Axial Detection wavelenght Nm
Cu 324.754 Ni 341.476 Pb 220.353
Al 167.079 nm
Plasma of argon gas was used to produce excited atoms and ions which emitted cha-racteristic electromagnetic radiation. Samples were prepared in an automated system for microwave digestion (Berghof MSW 3+).
Chemicals and reagents
Chemicals used in the analysis were of extra purity grade for trace element analysis (J.T. Baker, USA, INSTRA). The chemicals used included HNO3, H2O2, and standard
solutions of Cu, Ni, Pb and Al (1000 mg/dm3). For all dilutions and dissolutions ultra pure water from EasyPure system was used. Working solutions were prepared daily by diluting standard solutions with 0,1 mol/dm3 nitric acid. All vessels and cells were washed with nitric acid (1:1) and deionized ultra pure water.
Samples
Metal contents were determined in 38 different milk chocolate samples. Samples were collected randomly in the local markets. The collected samples included both domestic (Serbian) and foreign producers.
Sample preparation
Table 3. Program of microwave digestion
Parameter 1. step 2. step 3. step 4. step 5. step
Temperature [oC] 160 190 210 100 100
Pressure [bar] 30 30 30 10 10
Time [min] 5 5 25 10 5
Ramp [min] 5 1 2 1 1
Power [%] 80 80 80 10 10
The digested samples were quantitatively transferred to the volumetric flasks and di-luted to 25 cm3 with ultra pure water. A blank digest was carried out in the same way as the samples.
RESULTS AND DISCUSSION
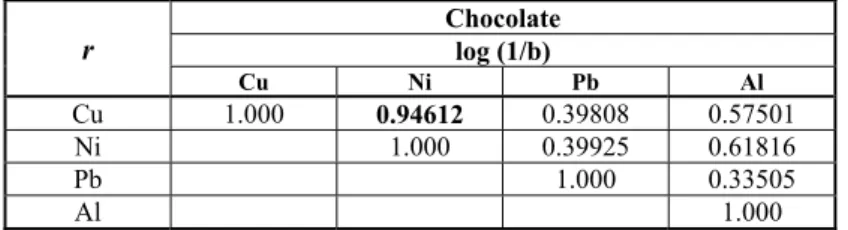
The development of a chemometric model requires diverse sets of data, and, thereby a large number of data have to be considered. The data reduction is very important in ducing data redundancy that could lead to low predictivity of the models. To further re-duce the data, a correlation matrix was generated to study the data patterns. Finally, the selection of a set of appropriate Pearson's correlation matrix has been performed on all content of metals (Table 4).
Table 4. The correlation matrix for the content of metals in the analyzed chocolate samples
r
Chocolate log (1/b)
Cu Ni Pb Al
Cu 1.000 0.94612 0.39808 0.57501
Ni 1.000 0.39925 0.61816
Pb 1.000 0.33505
Al 1.000
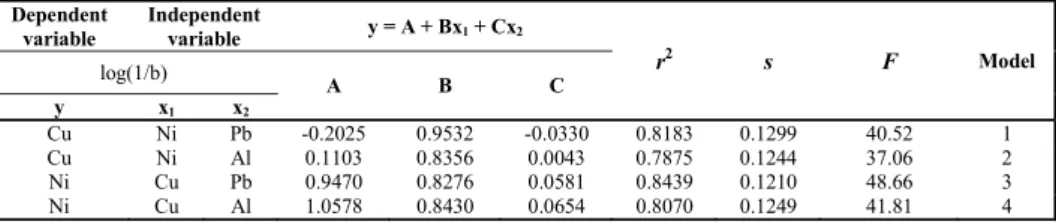
statistically significant models, free of multicollinearity, were obtained and they are given in the Table 5.
Table 5. Statistical parameters of the relationships between the content of metals present in the chocolate samples
However, it is well known that there are three important components in any chemo-metric study: development of the models, validation of the models and utility of the deve-loped models. Validation is a crucial aspect of any chemometric analysis. It is noteworthy that all these equations were derived using entire data set of chocolate samples (n = 38) and no outliers were identified. The statistical quality of the generated models is determi-ned by statistical measures: the square of the correlation coefficient (r2), the standard er-ror of estimation (s), and F-test (Fisher's value) for statistical significance (10, 11)The square of the correlation coefficient (or coefficient of multiple determination) is a relative measure of fit by the regression equation. Correspondingly, it represents the part of varia-tion in the observed data that is explained by the regression. The correlavaria-tion coefficient values closer to 1.0 represent the better fit of the regression. Standard deviation is measu-red by the error mean square, which expresses the variation of the residuals or the varia-tion about the regression line. Thus, standard deviavaria-tion is an absolute measure of quality of fit, and it should have a low value for the regression to be significant. The F-test ref-lects the ratio of the variance explained by the model and the variance due to the error in regression. High values of the F-test indicate that the model is statistically significant. To test the validity of the predictive power of derived model use was made of the cross-vali-dation statistical technique. This is the most common valicross-vali-dation technique, where a num-ber of modified data sets are created by deleting, in each case, one or smaller group of objects from the data in such a way that each object is taken away once and only once. For each reduced data set, the model is calculated, and responses for the deleted objects are predicted from the model. The simplest and most general cross-validation procedure is the LOO technique. This method uses cross-validated of fewer parameters: PRESS (predicted residual sum of squares), SSY (total sum of squares deviation), r2CV, and r2adj
(Table 6). PRESS is an important cross-validation parameter as it is a good approxima-tion of the real predictive error of the models. Its value being less than SSY points out that the model predicts better than chance, and can be considered statistically significant. The present models have PRESS<<SSY.
Dependent variable
Independent
variable y = A + Bx1 + Cx2
r2 s F Model
log(1/b)
A B C
y x1 x2
Cu Ni Pb -0.2025 0.9532 -0.0330 0.8183 0.1299 40.52 1
Cu Ni Al 0.1103 0.8356 0.0043 0.7875 0.1244 37.06 2
Ni Cu Pb 0.9470 0.8276 0.0581 0.8439 0.1210 48.66 3
Table 6. Cross-validation parameters of the established MLR models
PRESS SSY PRESS/ SSY r2CV r2adj Model
0.4540 1.6707 0.2717 0.7283 0.7981 1 0.3933 1.4561 0.2701 0.7299 0.7663 2 0.3836 1.6891 0.2271 0.7729 0.8266 3 0.4069 1.6171 0.2516 0.7484 0.7877 4
In many cases, r2CV and r2adjare taken as a proof of the high predictive ability of che-mometric models. Ahigh value of these statistical characteristic (> 0.5) is considered as a proof of the high predictiveability of the model, although recent reports have proven the opposite (12). Thus, the high value of LOO r2CV is the necessary condition for a model to
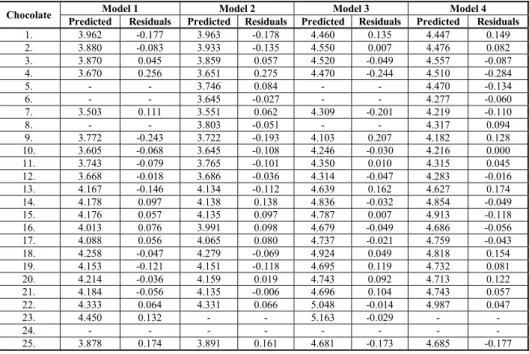
have a high predictive power. However, the only way to estimate the true predictive pow-er of a model is to test its ability to predict accurately the metal content (Figure 1). In or-der to verify the predictive power of the developed model, the metal content was calcula-ted using models(1 - 4) and compared with the observed values (Table 7). The data pre-sented in Table 5 show that the observed and the estimated values are very close to each other. The residual values (the difference between experimentally obtained values for metal content and chemometric calculated metal content is less than or equal to 0.284.
Table 7. Predicted values of the composition of the metals present in the investigated samples
Chocolate Model 1 Model 2 Model 3 Model 4
Predicted Residuals Predicted Residuals Predicted Residuals Predicted Residuals
1. 3.962 -0.177 3.963 -0.178 4.460 0.135 4.447 0.149
2. 3.880 -0.083 3.933 -0.135 4.550 0.007 4.476 0.082
3. 3.870 0.045 3.859 0.057 4.520 -0.049 4.557 -0.087
4. 3.670 0.256 3.651 0.275 4.470 -0.244 4.510 -0.284
5. - - 3.746 0.084 - - 4.470 -0.134
6. - - 3.645 -0.027 - - 4.277 -0.060
7. 3.503 0.111 3.551 0.062 4.309 -0.201 4.219 -0.110
8. - - 3.803 -0.051 - - 4.317 0.094
9. 3.772 -0.243 3.722 -0.193 4.103 0.207 4.182 0.128
10. 3.605 -0.068 3.645 -0.108 4.246 -0.030 4.216 0.000
11. 3.743 -0.079 3.765 -0.101 4.350 0.010 4.315 0.045
12. 3.668 -0.018 3.686 -0.036 4.314 -0.047 4.283 -0.016
13. 4.167 -0.146 4.134 -0.112 4.639 0.162 4.627 0.174
14. 4.178 0.097 4.138 0.138 4.836 -0.032 4.854 -0.049
15. 4.176 0.057 4.135 0.097 4.787 0.007 4.913 -0.118
16. 4.013 0.076 3.991 0.098 4.679 -0.049 4.686 -0.056
17. 4.088 0.056 4.065 0.080 4.737 -0.021 4.759 -0.043
18. 4.258 -0.047 4.279 -0.069 4.924 0.049 4.818 0.154
19. 4.153 -0.121 4.151 -0.118 4.695 0.119 4.732 0.081
20. 4.214 -0.036 4.159 0.019 4.743 0.092 4.713 0.122
21. 4.184 -0.056 4.135 -0.006 4.696 0.104 4.743 0.057
22. 4.333 0.064 4.331 0.066 5.048 -0.014 4.987 0.047
23. 4.450 0.132 - - 5.163 -0.029 - -
24. - - - -
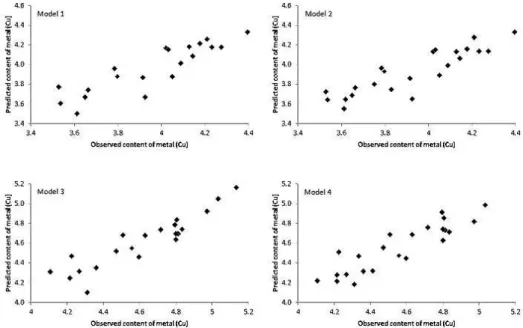
Further, Fig. 1 shows the linear regression plots between the predicted and observed values of metal content in the analyzedchocolate samples and also proves the usefulness of the derived models.
Figure 1. Plots of the predicted vs experimental values of metal content of the training set
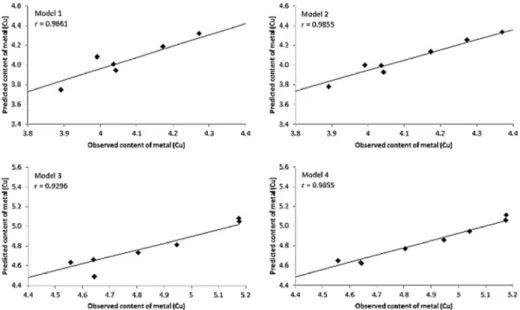
In order to investigate the existence of a systemic error in developing the chemomet-ric models, the residuals of the predicted values were plotted against the observed values (Fig. 2). The propagation of the residuals on both sides of the zero axis indicates that no systemic error in the development of regression models exists, as suggested by Jalali-He-ravi and Kyani (13).
Figure 2. Plots of the residual values vs the experimentally observed metal content of training set
All the presented results indicate that these models can be successfully applied to pre-dict the metal content of this class of chocolate samples.
CONCLUSIONS
Accurate MLR models were developed for predicting the metal content of this class of chocolate samples. The MLR equations that represent the content of a metal as a func-tion of the contents of the other metals were established. The validity of the model was established by the determination of the appropriate statistical parameters. The close agre-ement between the observed and predicted values was obtained. The low residual activity and high cross-validated r2 values (r2CV) suggest a good predictive ability of the
develo-ped chemometric models. This study could give necessary guidelines for the analyses of different types of chocolate for metal content.
Acknowledgement
This paper was performed within the framework of the research projects No. 31055, No. 172012 and 172014 supported by the Ministry of Education, Science and Technolo-gical Development of the Republic of Serbia and the project No. 114-451-3593/2013-04, financially supported by the Provincial Secretariat for Science and Technological Deve-lopment of Vojvodina.
REFERENCES
1. Guanasekaran, S. and Ding, K.: Using computer vision for food quality evaluation. Food Technol. 15 (1994) 1-54.
2. Brosnan, T. and Sun, D.W.: Improving quality inspection of food products by compu-ter vision: a review. J. Food Eng. 61 (2004) 3-16.
3. Du, C.J. and Sun, D.W.: Learning techniques used in computer vision for food quality evaluation: a review. J. Food Eng. 72 (2006) 1-54.
4. Minovski, N, Jezierska-Mazzarello, A., Vračko, M. and Šolmajer, T.: Investigation of 6-fluoroquinolones activity against Mycobacterium tuberculosis using theoretical mo-lecular descriptors: a case study. Cent. Eur. J. Chem. 9 (2011)855-866.
5. Jevrić, L., Podunavac-Kuzmanović, S., Švarc-Gajić, J., Tepić, A., Kovačević, S. and Kalajdžija, N.: (2013) QSRR modeling of retention behavior of some s-triazine deri-vatives. Acta Chim. Slov. 60 (2013) 732-742.
6. Kovačević, S., Jevrić, L., Podunavac-Kuzmanović, S., Kalajdžija, N. and Lončar, E.: Quantitative structure-retention relationship analysis of some xylofuranose derivatives by linear multivariate method. Acta Chim. Slov. 60 (2013) 420-428.
7. Podunavac Kuzmanović, S., Jevrić, L., Kovačević, S. And Kalajdžija, N.: A chemo-metric approach for prediction of antifungal activity of some benzoxazole derivatives against Candida albicans. APTEFF 43 (2012) 273-282.
9. Kovačević, S., Jevrić, L., Podunavac Kuzmanović, S. and Lončar, E.: Chemometric estimation of the RP TLC retention behaviour of some estrane derivatives by using multivariate regression methods. Cent. Eur. J. Chem. 11 (2013)2031-2039.
10.Snedecor, W., Cochran, G.: Statistical Methods (1967) Oxford and IBH, New Delhi. 11.G. Topliss, G.and Edwards, P.: J. Med. Chem. 22 (1979) 1238-1244.
12.Jung, M., Tak, J., Lee, Y. and Jung, Y.: Quantitative structure–activity relationship (QSAR) of tacrine derivatives against acetylcholinesterase (AChE) activity using va-riable selections. Bioorg. Med. Chem. Lett. 17 (2007)1082-1090.
13.M. Jalali-Heravi and A. Kyani: Use of Computer-Assisted Methods for the Modeling of the Retention Time of a Variety of Volatile Organic Compounds: A PCA-MLR-ANN Approach. J. Chem. Inf. Comput. Sci. 44 (2004) 1328-1335.
ɏȿɆɈɆȿɌɊɂȳɋɄȿȺɇȺɅɂɁȿɋȺȾɊɀȺȳȺɆȿɌȺɅȺɍɊȺɁɅɂɑɂɌɂɆ
ɍɁɈɊɐɂɆȺɑɈɄɈɅȺȾȺ
. *, . , . - ,
.
, , 1, 21000 ,
, ђ
(Cu, Ni, Pb, Al) .
ђ .
-j
( ). ,
.
-ђ - .
ђ
-Ʉʂɭɱɧɟɪɟɱɢ: , ,