Vol.53, n. 5: pp.1005-1013, September-October 2010
ISSN 1516-8913 Printed in Brazil BRAZILIAN ARCHIVES OF
BIOLOGY AND TECHNOLOGY
A N I N T E R N A T I O N A L J O U R N A L
Enhanced Exoinulinase Production from Kluyveromyces
marxianus YS-1 using Response Surface Methodology
Ram Sarup Singh
*and Shveta Lotey
Carbohydrate and Protein Biotechnology Laboratory; Department of Biotechnology; Punjabi University; Patiala 147 002; Punjab - India
ABSTRACT
Optimization of critical medium components for exoinulinase production by Kluyveromyces marxianus YS-1 at shake-flask was investigated using response surface methodology (RSM) based on a central composite rotatable design (CCRD). A five-level with five factors CCRD was used to evaluate the influence of related factors including concentration of inulin, meat extract, calcium chloride, sodium dodecyl sulphate and medium pH. Optimum values obtained by RSM were 2% inulin, 2.17% meat extract, 0.65 mM calcium chloride, 0.10 mM sodium dodecyl sulphate and pH 5.5. Optimized medium projected a theoretical exoinulinase production of 63.61 IU/mL and biomass yield of 0.965 (OD600/10). Multiple correlation coefficient R was 0.9976 and 0.9605 for exoinulinase
production and biomass yield, respectively, which being close to one, justified an excellent correlation between the predicted and experimental values. Maximum productivity of exoinulinase (64.05 IU/mL) obtained experimentally by RSM was more than double in comparison to earlier findings using classical one-variable-at-a-time technique.
Key words: Kluyveromyces marxianus, exoinulinase, medium optimization, central composite rotatable design, response surface methodology
* Author for correspondence: [email protected]
INTRODUCTION
Microbial inulinases are an important class of industrial enzymes, which hydrolyze inulin to produce fructose and fructo-oligosaccharides. Both fructose and fructo-oligosaccharides are fast emerging as important ingredients in the food and pharmaceutical industry. Inulin is a linear β-(2→1) linked fructose polymer with a terminal glucose unit that occurs as a reserve carbohydrate in many plants belonging to the Compositae, Liliaceae and Gramineae families (Gupta and Kaur, 1997). This polymer is a well recognized source for the production of either ultra-high fructose syrup or fructo-oligosaccharides (Gupta and Kaur, 1997; Kaur and Gupta, 2002). Fructose is a GRAS sweetener, sweeter than sucrose (1.2-2.0 times),
with lower cost and its technical superiorities over sucrose are attracting many food and beverage industries (Singh et al., 2008). Furthermore,
fructose metabolism bypasses the known
metabolic pathway of glucose and therefore does not require insulin (Kaur and Gupta, 2002). Fructo-oligosaccharides are prebiotic and their positive effect on human health has been widely known (Sangeetha et al., 2005). Other important applications of inulinases are in the production of ethanol, gluconic acid, sorbitol, pullulan and acetone-butanol (Singh and Gill, 2006).
yield is only 45%. In contrast, the complete hydrolysis of inulin by a single step using exoinulinase (2,1-β-D fructan fructohydrolase, EC 3.2.1.7) gives a yield of 90-95% (Singh et al., 2007a). High inulinase producing microorganisms are Penicillium, Aspergillus and Kluyveromyces,
but in the present study Kluyveromyces was preferred due to its GRAS status and relatively less fermentation time over the other two microorganisms.
The optimization of a process or formulation of a medium by classical methods involving the change of one-variable-at-a-time is extremely time consuming and expensive, when a large number of variables are considered. This method does not bring about the effects of interactions of various variables (Cochran and Cox, 1992). Statistical experimental design techniques are very useful tools for the selection of nutrients. They can
provide statistical models which help in
understanding the interactions among the nutrients at various levels and in calculating the optimal level of each nutrient for a given target (Reddy et al., 2003). The application of statistical experimental design techniques in a fermentation process development can improve product yield, reduce process variability and process time, and can make the process more cost effective, etc. (Elibol, 2004). Response surface methodology (RSM) is a model consisting of mathematical and statistical techniques, and is an important tool to study the effect of both the primary factors and their mutual interactions (Myers and Montgomery, 1995). Furthermore, central composite rotatable design (CCRD) is a widely used statistical technique for determining the key factors from a large number of medium components by a small number of experiments.
The present work studied the optimization of
medium for exoinulinase production by K.
marxianus at shake-flask level using a central
composite rotatable design, where the
simultaneous effect of five independent variables (inulin, meat extract, calcium chloride, sodium dodecyl sulphate and pH) were investigated.
MATERIALS AND METHODS
Yeast culture and its maintenance
Kluyveromyces marxianus YS-1 was isolated, identified and maintained as described previously
(Singh et al., 2005). Yeast culture has been deposited in International Depository Authority of Microbial Type Culture Collection (MTCC), Chandigarh, India and assigned an accession no. 5201.
Inoculum preparation
Inoculum was prepared in 250 mL Erlenmeyer’s flask containing 50 mL medium having a composition of 1.0% glucose, 0.3% malt extract, 0.3% yeast extract, 0.5% peptone and adjusted to pH 6.5. The flasks were incubated at 30 °C on a rotary shaker (Innova 4335, New Brunswick, USA) under agitation (150 rpm) for 12 h.
Exoinulinase production at shake-flask level Erlenmeyer’s flasks (250 mL) containing 50 mL of fermentation medium were inoculated with 5% (v/v) of inoculum. Shake-flask fermentations were carried out at 30 °C under shaking (150 rpm) for 72 h.
Experimental design and statistical analysis Response surface methodology based on a five-level, five-variable central composite rotatable design (CCRD) was employed for optimization with respect to the important variables, i.e., the most significant medium components affecting the exoinulinase production in submerged cultivation using K. marxianus. The variables optimized were inulin (1-2.5%, w/v), meat extract (1-2.5%, w/v), calcium chloride (0.3-1 mM), sodium dodecyl sulphate (0.05-0.15 mM) and pH (5.5-7.0) each at five levels i.e. -1.821, -1.000, 0.000, 1.000 and 1.821 (Table 1). These variables were selected on the basis of earlier findings (Singh et al., 2007b). Exoinulinase activity and biomass yield after 72 h of fermentation were studied as responses, as there was no significant increase in either of the responses after this time. The software design expert (version 7.0.3, Stat-Ease Inc., Minneapolis, USA) was used for statistical analysis of the results. Exoinulinase activity and biomass yield were analyzed using analysis of variance (ANOVA) in combination with Fischer test to evaluate if a given term possesses a significant effect (P≤0.05).
Measurement of biomass
terms of OD at 600 nm against cell-free fermented medium as blank and expressed as OD600/10.
Recovery of crude exoinulinase
The fermented broth was centrifuged (2500 × g, 10 min, 4 °C) in a refrigerated centrifuge (AvantiTM 30, Beckman, USA) and supernatant was taken as crude enzyme.
Exoinulinase assay
A reaction mixture containing 0.1 mL of the crude enzyme and 0.9 mL of sodium acetate buffer (0.1 M, pH 5.5) containing 2% inulin was incubated at 50 °C for 15 min. Thereafter, the reaction mixture was kept at 100 °C for 10 min to inactivate the enzyme and then assayed for reducing sugars using 3,5-dinitrosalicylic acid method (Miller, 1959). One unit of exoinulinase activity (IU) was defined as the amount of enzyme that produced one micromole of reducing sugars per minute under standard assay conditions.
RESULTS AND DISCUSSION
In order to optimize the exoinulinase production and growth by a statistically based experimental design, inulin; meat extract; calcium chloride; sodium dodecyl sulphate and pH were chosen as important factors based on earlier findings (Singh et al., 2007b). A central composite rotatable design (CCRD) with five coded levels for all five factors i.e. inulin (A), meat extract (B), calcium chloride (C), sodium dodecyl sulphate (D) and pH (E) were
used for this purpose and a total of 27 experiments in two blocks with appropriate combinations of all factors were conducted. The range of the variables is depicted in Table 1. The experimental design and the results obtained for exoinulinase production and biomass yield are presented in Table 2. The experimental results of the CCRD were fitted with a second order polynomial equation. Regression coefficients were calculated and the fitted equations (in terms of coded values) predicting exoinulinase activity (X) and biomass yield (Y) were as given below regardless of the significance of the coefficients:
X = 48.93 + 6.56*A – 3.70*B + 1.21*C + 3.53*D – 1.88*E – 4.59*A2 – 10.22*B2 – 6.34*C2 – 3.40*D2 + 4.81*E2 + 7.02*A*B – 2.56*A*C + 4.02*A*D – 3.66*A*E + 0.70*B*C – 2.69*B*D – 6.61*B*E + 1.20*C*D –
1.34*C*E + 3.31*D*E (1) Y = 9.17 + 0.74*A + 0.46*B + 0.24*C – 0.16*D +
0.12*E – 0.16*A2 – 0.32*B2 – 0.26*C2 – 0.23*D2 – 0.074*E2 – 0.67*A*B – 0.54*A*C – 0.35*A*D – 0.11*A*E – 0.25*B*C – 0.36*B*D – 0.13*B*E – 0.29*C*D + 0.062*C*E + 0.66*D*E (2)
where A represents inulin concentration; B, meat extract concentration; C, calcium chloride concentration; D, sodium dodecyl sulphate concentration and E, pH. The analysis of variance (ANOVA) for the refined model is summarized in Table 3.
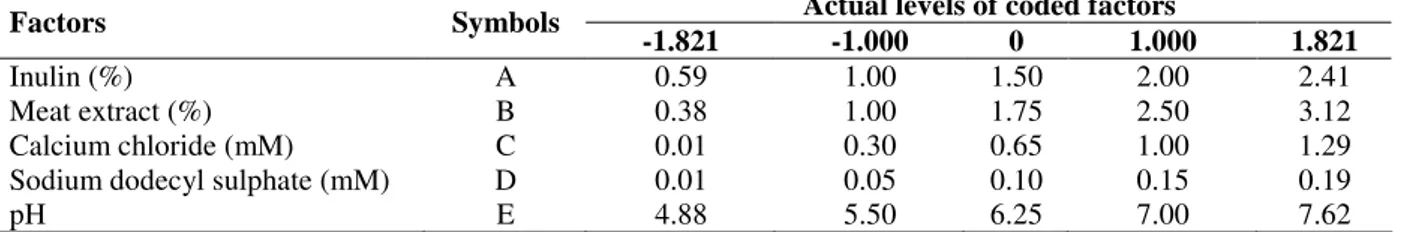
Table 1 - Experimental range and levels of independent variables in terms of coded and actual factors.
Actual levels of coded factors Factors Symbols
-1.821 -1.000 0 1.000 1.821
Inulin (%) A 0.59 1.00 1.50 2.00 2.41
Meat extract (%) B 0.38 1.00 1.75 2.50 3.12
Calcium chloride (mM) C 0.01 0.30 0.65 1.00 1.29
Sodium dodecyl sulphate (mM) D 0.01 0.05 0.10 0.15 0.19
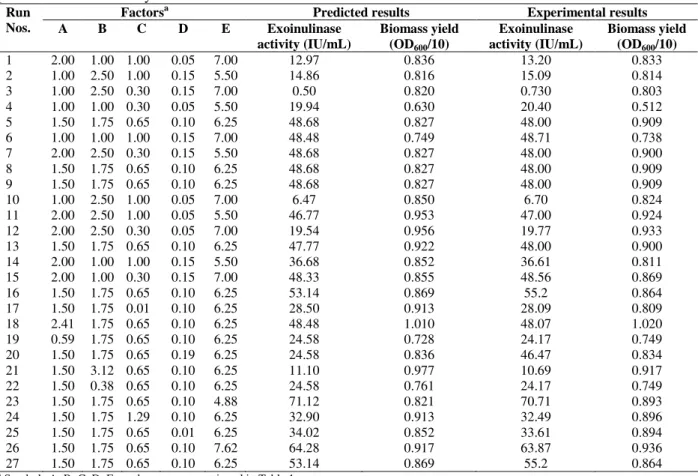
Table 2 - Central composite design matrix for the experimental design and predicted results for exoinulinase production and biomass yield.
Factorsa Predicted results Experimental results
Run
Nos. A B C D E Exoinulinase
activity (IU/mL)
Biomass yield (OD600/10)
Exoinulinase activity (IU/mL)
Biomass yield (OD600/10)
1 2.00 1.00 1.00 0.05 7.00 12.97 0.836 13.20 0.833
2 1.00 2.50 1.00 0.15 5.50 14.86 0.816 15.09 0.814
3 1.00 2.50 0.30 0.15 7.00 0.50 0.820 0.730 0.803
4 1.00 1.00 0.30 0.05 5.50 19.94 0.630 20.40 0.512
5 1.50 1.75 0.65 0.10 6.25 48.68 0.827 48.00 0.909
6 1.00 1.00 1.00 0.15 7.00 48.48 0.749 48.71 0.738
7 2.00 2.50 0.30 0.15 5.50 48.68 0.827 48.00 0.900
8 1.50 1.75 0.65 0.10 6.25 48.68 0.827 48.00 0.909
9 1.50 1.75 0.65 0.10 6.25 48.68 0.827 48.00 0.909
10 1.00 2.50 1.00 0.05 7.00 6.47 0.850 6.70 0.824
11 2.00 2.50 1.00 0.05 5.50 46.77 0.953 47.00 0.924
12 2.00 2.50 0.30 0.05 7.00 19.54 0.956 19.77 0.933
13 1.50 1.75 0.65 0.10 6.25 47.77 0.922 48.00 0.900
14 2.00 1.00 1.00 0.15 5.50 36.68 0.852 36.61 0.811
15 2.00 1.00 0.30 0.15 7.00 48.33 0.855 48.56 0.869
16 1.50 1.75 0.65 0.10 6.25 53.14 0.869 55.2 0.864
17 1.50 1.75 0.01 0.10 6.25 28.50 0.913 28.09 0.809
18 2.41 1.75 0.65 0.10 6.25 48.48 1.010 48.07 1.020
19 0.59 1.75 0.65 0.10 6.25 24.58 0.728 24.17 0.749
20 1.50 1.75 0.65 0.19 6.25 24.58 0.836 46.47 0.834
21 1.50 3.12 0.65 0.10 6.25 11.10 0.977 10.69 0.917
22 1.50 0.38 0.65 0.10 6.25 24.58 0.761 24.17 0.749
23 1.50 1.75 0.65 0.10 4.88 71.12 0.821 70.71 0.893
24 1.50 1.75 1.29 0.10 6.25 32.90 0.913 32.49 0.896
25 1.50 1.75 0.65 0.01 6.25 34.02 0.852 33.61 0.894
26 1.50 1.75 0.65 0.10 7.62 64.28 0.917 63.87 0.936
27 1.50 1.75 0.65 0.10 6.25 53.14 0.869 55.2 0.864
a Symbols A, B, C, D, E are the same as mentioned in Table 1.
Table 3 - Analysis of variance (ANOVA) for response surface quadratic model obtained from experimental design.
Exoinulinase activity Biomass yield
Sourcea
Sum of squares DF Prob.>F Sum of squares DF Prob.>F
Model 8613.83 20 0.0001 22.23 20 0.0265
A 285.61 1 0.0004 3.67 1 0.0064
B 2.04 1 0.5103 1.84 1 0.0243
C 9.68 1 0.1834 0.38 1 0.2082
D 82.69 1 0.0063 0.18 1 0.3639
E 23.29 1 0.0617 0.092 1 0.5081
A2 488.34 1 0.0039 0.40 1 0.3413
B2 3125.40 1 0.6104 2.28 1 0.0163
C2 910.19 1 0.0027 1.14 1 0.0537
D2 277.94 1 0.2842 0.83 1 0.0852
E2 443.24 1 0.6739 0.046 1 0.3700
AB 104.07 1 0.0198 0.20 1 0.8369
AC 1.20 1 0.0010 0.59 1 0.6410
AD 122.36 1 0.2415 1.973E-004 1 0.8617
AE 5.84 1 0.4216 0.72 1 0.3565
BC 0.81 1 0.0176 0.17 1 0.4605
B D 46.30 1 0.0001 8.715E-003 1 0.1983
BE 188.23 1 <0.0001 0.044 1 0.1295
CD 7.17 1 <0.0001 5.878E-003 1 0.9790
CE 3.11 1 0.0004 0.19 1 0.5593
DE 49.27 1 0.0001 0.11 1 0.6350
Residual 20.32 5 0.92 5
Lack of fit 20.32 1 0.92 1
Pure error 0.000 4 0.000 4
Core total 8998.56 26 23.64 26
A very low model P-value (Pmodel < 0.05) for exoinulinase production and biomass yield suggested the model to be significant. The multiple correlation coefficient R was 0.9976 and 0.9605 for exoinulinase production and biomass yield, respectively, which being very close to one, justified an excellent correlation between the predicted and experimental values. The model F-value of 105.96 for exoinulinase production and 6.16 for biomass yield suggested that the model was significant. The quadratic models in Eq. (1) and (2) with twenty terms contained five linear, five quadratic and ten two-factorial interactions. Insignificant terms were neglected on the basis of
P-values, which were more than 0.1000 for each response (Table 3) thus, modifying the model Eq. (1) and (2) to reduced fitted model Eq. (3) and (4) as:
X = 48.93 + 6.56*A + 3.53*D – 1.88*E – 4.59*A2 – 10.22*B2 – 6.34*C2 + 7.02*A*B – 2.56*A*C + 0.70*B*C – 2.69*B*D – 6.61*B*E + 1.20*C*D – 1.34*C*E +
3.31*D*E
(3)
Y = 9.17 + 0.74*A + 0.46*B – 0.32*B2 – 0.26*C2
– 0.23*D2 (4)
The biomass yield and exoinulinase production as predicted by the final quadratic model along with the corresponding observed values are given in Table 4. A comparison of these values indicated that there was an excellent agreement between the predicted and experimental data. The optimum values obtained by the differentiation of the
quadratic model for achieving maximum
exoinulinase production and biomass yield were A = 2% (w/v), B = 2.17% (w/v), C = 0.65 mM, D = 0.10 mM and E = 5.5. The predicted optimal exoinulinase production and biomass yield was confirmed by performing additional experiments in triplicates using the optimized medium components. These experiments yielded an average exoinulinase production and biomass yield
of 64.05 IU/mL and 0.965 (OD600/10),
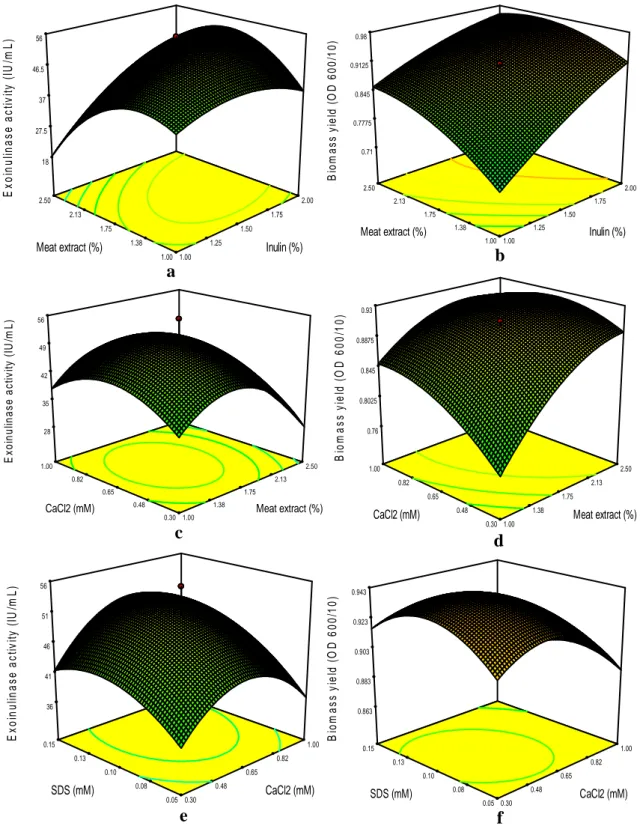
respectively. The good agreement between the predicted and experimental values verified the validity of the model along with the existence of the optimal point. The fitted response surface plots for exoinulinase production and biomass yield by the above model were generated using the design expert program and presented in Figs. 1 and 2. The graphical representation provides a method to visualize the relation between the response and
experimental levels of each variable, and the type of interactions between test variables in order to deduce the optimum conditions. Figs. 1a and 1b depicted the three-dimensional plot showing the quadratic effect of inulin and meat extract concentration on exoinulinase production and biomass yield, while other three variables, i.e., calcium chloride, sodium dodecyl sulphate and pH were fixed at their mid values, 0.65 mM, 0.10 mM and 6.25, respectively. It was observed that at low concentration of inulin (1%, w/v), exoinulinase production and biomass yield of K. marxianus
increased gradually with increasing meat extract concentration upto 2.5% (w/v), but decreased with further increase in inulin concentration. Inhibition in exoinulinase synthesis above 1.75% (w/v) inulin could be due to catabolite repression by more rapidly utilizable substrate. It has been established that higher substrate concentration could lead to catabolite repression, consequently lowering the enzyme activity (Groot-wassnik and Fleming, 1980; Cruz-Guerrero et al., 1995; Jing et al., 2003). The quadratic effect of meat extract and inulin concentration is given in Figs. 1a and 1b. An increase in biomass yield was observed with increase in the concentration of meat extract upto 2.5% (w/v). Higher concentration of meat extract was inhibitory for exoinulinase synthesis which could be due to the complex nature of this nitrogen source and some of its constituents might have a toxic effect on the responses. Xiao et al. (1988) reported 4% meat extract as the best nitrogen source for the production of inulinase from
Chrysosporium pannorum. However, maximum inulinase activity from Kluyveromyces sp. Y-85 was obtained using 1% pork extract (Wei et al., 1998). Figs. 1e and 1f show a similar plot at various concentrations of calcium chloride and sodium dodecyl sulphate at fixed inulin (1.5%, w/v), meat extract (1.75%, w/v) and pH (6.25). Calcium chloride showed a stimulatory effect on exoinulinase production, thereby indicating its requirement for exoinulinase production by K. marxianus. The use of calcium chloride has been reported for inulinase synthesis from K. marxianus
Figure 1 - Three-dimensional contour plots showing the effect of (a) inulin and meat extract on exoinulinase activity (b) inulin and meat extract on biomass yield (c) calcium chloride and meat extract on exoinulinase activity (d) calcium chloride and meat extract on biomass yield (e) sodium dodecyl sulphate (SDS) and calcium chloride on exoinulinase activity (f) sodium dodecyl sulphate (SDS) and calcium chloride on biomass yield (When the effect of two variables were plotted, the other three variables were set at their middle values).
1.00 1.25 1.50 1.75 2.00 1.00 1.38 1.75 2.13 2.50 18 27.5 37 46.5 56 E x o in u li n a s e a c ti v it y ( IU /m L ) Inulin (%) Meat extract (%)
1.00 1.38 1.75 2.13 2.50 0.30 0.48 0.65 0.82 1.00 28 35 42 49 56 E x o in u lin a s e a c ti v it y ( IU /m L )
Meat extract (%) CaCl2 (mM) 0.30 0.48 0.65 0.82 1.00 0.05 0.08 0.10 0.13 0.15 36 41 46 51 56 E x o in u lin a s e a c ti v it y ( IU /m L ) CaCl2 (mM) SDS (mM) 1.00 1.25 1.50 1.75 2.00 1.00 1.38 1.75 2.13 2.50 0.71 0.7775 0.845 0.9125 0.98 B io m a s s y ie ld ( O D 6 0 0 /1 0 ) Inulin (%) Meat extract (%)
1.00 1.38 1.75 2.13 2.50 0.30 0.48 0.65 0.82 1.00 0.76 0.8025 0.845 0.8875 0.93 B io m a s s y ie ld ( O D 6 0 0 /1 0 )
Meat extract (%) CaCl2 (mM) 0.30 0.48 0.65 0.82 1.00 0.05 0.08 0.10 0.13 0.15 0.863 0.883 0.903 0.923 0.943 B io m a s s y ie ld ( O D 6 0 0 /1 0 ) CaCl2 (mM) SDS (mM)
a
b
c
d
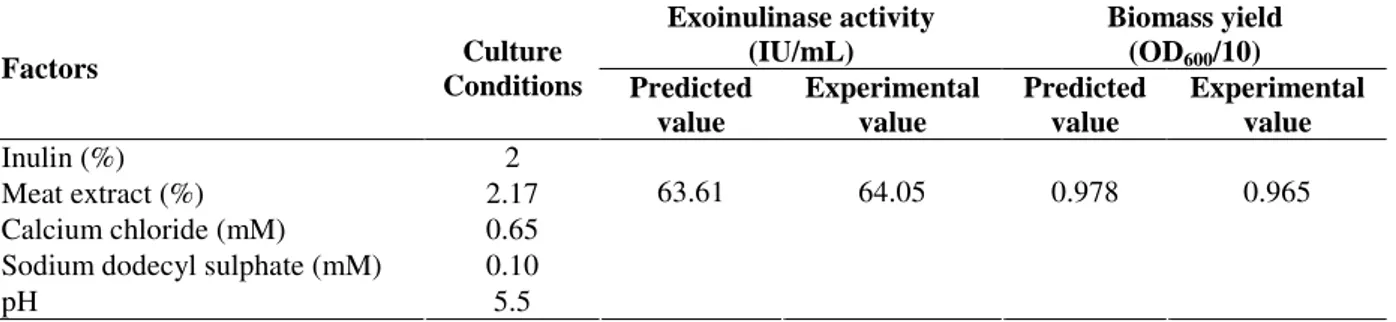
Figure 2 - Three-dimensional contour plots showing the effect of (a) pH in combination with inulin on biomass yield (b) pH in combination with meat extract on biomass yield (c) pH in combination with sodium dodecyl sulphate (SDS) on biomass yield (When the effect of two variables were plotted, while remaining variables were kept at their middle values).
Table 4 - Predicted values vs. experimental values for maximum exoinulinase activity and biomass yield.
Exoinulinase activity (IU/mL)
Biomass yield (OD600/10)
Factors Culture
Conditions Predicted value
Experimental value
Predicted value
Experimental value
Inulin (%) 2
Meat extract (%) 2.17
Calcium chloride (mM) 0.65 Sodium dodecyl sulphate (mM) 0.10
pH 5.5
63.61 64.05 0.978 0.965
b
1.00 1.38
1.75 2.13
2.50
5.50 5.88 6.25 6.63 7.00 0.81 0.84 0.87 0.9 0.93
B
io
m
a
s
s
y
ie
ld
(
O
D
6
0
0
/1
0
)
Meat extract (%) pH
1.00 1.25
1.50 1.75
2.00
5.50 5.88 6.25 6.63 7.00
0.8 0.83 0.86 0.89 0.92
B
io
m
a
s
s
y
ie
ld
(
O
D
6
0
0
/1
0
)
Inulin (%) pH
0.05 0.08
0.10 0.13
0.15
5.50 5.88 6.25 6.63 7.00 0.838 0.857 0.876 0.895 0.914
B
io
m
a
s
s
y
ie
ld
(
O
D
6
0
0
/1
0
)
SDS (mM) pH
a
This could be due to lethal effect of solubilization of membrane bound proteins and phospholipids at higher concentrations of sodium dodecyl sulphate. The response also varied at different levels of pH along the axis suggesting that there was a considerable interaction between pH, inulin, calcium chloride and meat extract (Fig. 2). The response surfaces shown in Figs. 2a, 2b and 2c depict the combined effect of pH and inulin, pH and meat extract, pH and sodium dodecyl sulphate, respectively on biomass yield. A significant increase in biomass yield with increase in pH upto 6.5 was obtained. However, the optimum pH 5.5 for exoinulinase production was predicted by the
experimental design and it was proved
experimentally. The hydrogen ion concentration of the medium has a strong influence on the microbial growth.
The results obtained are in corroboration with the findings of Cazetta et al. (2005). Response surface
optimization supported 64.05 IU/mL of
exoinulinase production by K. marxianus YS-1 as compared to 30.8 IU/mL obtained by single variable study reported earlier (Singh et al., 2007b). Thus, a very significant increase in exoinulinase production was achieved using a statistical technique.
CONCLUSIONS
Statistical optimization of a process or formulation of a fermentation medium can overcome the limitations of classical empirical methods. A successful application of RSM to enhance exoinulinase production from K. marxianus by optimizing the fermentation medium has been reported. The existence of interactions between the independent variables with the responses was observed. The optimized fermentation medium composition was 2% inulin, 2.17% meat extract, 0.65 mM calcium chloride, 0.10 mM sodium dodecyl sulphate and pH 5.5. Applying the RSM
medium, the maximum productivity of
exoinulinase (64.05 IU/mL) at shake-flask level was more than double as reported in earlier findings using single variable optimization technique (Singh et al., 2007a).
ACKNOWLEDGEMENTS
Authors are grateful to Department of
Biotechnology, Punjabi University, Patiala for providing necessary laboratory facilities to execute the present work. The financial assistance received from UGC in the form of a major research project [F. No.33-239/2007 (SR)] for this work is duly acknowledged.
RESUMO
Foi investigada a optimização de componentes criticos do meio de cultivo para a produção de exoinulinase por Kluyveromyces marxianus YS-1 em frascos agitados utilizando a metodologia de superficie de resposta (RSM), com base em um delineamento composto central rotativo. As variáveis independentes, com cinco niveis, foram as concentrações de inulina, de extrato de carne, de cloreto de cálcio e de dodecil sulfato de sódio, bem como o pH do meio de cultivo. Os valores ótimos, obtidos pela RSM, foram com 2% de inulina, 2.17% de extrato de carne, 0.65 mM de cloreto de cálcio, 0.10 mM de dodecil sulfato de sódio e pH 5.5. As estimativas de produção de exoinulinase e de rendimento em biomassa no meio otimizado foram de 63.61 UI/ml e de 9.65 (em termos de OD600/10), respectivamente. Os coeficientes de correlação múltipla R foram de 0.9976 e 0.9605 para produção de exoinulinase e biomassa, respectivamente, e, sendo próximos de um, indicam uma excelente correlação entre os valores estimados e experimentais. A máxima productividade de exoinulinase (64.05 UI/ml) obtida experimentalmente por RSM foi mais que o dobro em comparação com nossos resultados anteriores utilizando uma técnica de otimização clássica de uma variável por vez.
REFERENCES
Cazetta, M. L.; Martins, P. M. M.; Monti, R. and Contiero, J. (2005), Yacon (Polymnia sanchifolia) extract as a substrate to produce inulinase by
Cochran, W. G. and Cox, G. M. (1992), Experimental
Designs, Wiley, New York, USA.
Cruz-Guerrero, A.; Garcia-Pena, I.; Barzana, E.; Gracia-Garibay, M. and Gomez-Ruiz, L. (1995),
Kluyveromyces marxianus CDBB-L-278: A wild
inulinase hyperproducing strain. J. Ferment. Bioengg.,80, 159-163.
Elibol, M. (2004), Optimization of medium composition for actinorhodin production by
Streptomyces coelicolor A3(2) with response surface methodology. Process Biochem.,39, 1057-1062. Groot-wassnik, J. W. D. and Fleming, S. E. (1980),
Non-specific β-fructofuranosidase (inulinase) from
Kluyveromyces fragilis: batch and continuous
fermentation, simple recovery method and some industrial properties. Enzyme Microb. Technol.,2, 45-53.
Gupta, A. K. and Kaur, N. (1997), Fructan storing plants - a potential source of high fructose syrups. J. Sci. Ind. Res.,56, 447-452.
Jing, W., Zhengyu, J., Bo, J. and Xueming, X. (2003), Separation and identification of exo- and endoinulinase from Aspergillus ficuum. Curr. Microbiol.,47, 109-112.
Kaur, N. and Gupta, A. K. (2002), Applications of inulin and oligofructose in health and nutrition. J. Biosci.,27, 703-714.
Miller, G. L. (1959), Use of dinitrosalicylic acid reagent for the determination of reducing sugars. Anal. Chem.,31, 426-428.
Myers, R. H. and Montgomery, D. C. (1995), Response
Surface Methodology: Process and Product
Optimization using Designed Experiments.
Wiley-Interscience Publication, New York, USA.
Pessoa, A. J. and Vitolo, M. (1999), Inulinase from
Kluyveromyces marxianus: Culture medium
composition and enzyme extraction. Braz. J. Chem. Engg.,16, 1-14.
Reddy, P. R. M.; Ramesh, B.; Mrudula, S.; Reddy, G. and Seenayya, G. (2003), Production of thermostable β-amylase by Clostridium thermosulfurogenes SV2 in solid-state fermentation: optimization of nutrient levels using response surface methodology. Process Biochem.,39, 267-277.
Sangeetha, P. T.; Ramesh, M. N. and Prapulla, S. G. (2005), Recent trends in microbial production, analysis and application of fructooligosaccharides.
Trends Food Sci. Technol.,16, 442-457.
Singh, P. and Gill, P. K. (2006), Production of inulinases: recent advances. Food Technol. Biotechnol., 44, 151-162.
Singh, R. S.; Dhaliwal, R. and Puri, M. (2007a), Production of high fructose syrup from Asparagus
inulin using immobilized exoinulinase from
Kluyveromyces marxianus YS-1. J. Ind. Microbiol. Biotechnol., 34, 649-655.
Singh, R. S.; Dhaliwal, R. and Puri M. (2008), Development of a stable continuous flow immobilized enzyme reactor for the hydrolysis of inulin. J. Ind. Microbiol. Biotechnol.,35, 777-782. Singh, R. S.; Sooch, B. S. and Puri, M. (2005), An
improved process for inulinase production. Indian Patent Application No. 962/DEL/2005.
Singh, R. S.; Sooch, B. S. and Puri, M. (2007b), Optimization of medium and process parameters for the production of inulinase from a newly isolated
Kluyveromyces marxianus YS-1. Biores. Technol.,
98, 2518-2525.
Wei, W.; Zhonghui, Z.; Yuenying, L. and Xinsheng, Z. (1998), Optimizing the culture conditions for higher
inulinase production by Kluyveromyces sp. Y-85 and scaling-up fermentation. J. Ferment. Bioengg., 86, 395-399.
Xiao, R.; Tanida, M. and Takao, S. (1988), Inulinase from Chrysosporium pannorum. J. Ferment. Technol., 66,553-558.