Enhancing inulinase yield by irradiation mutation associated
with optimization of culture conditions
Yafeng Gou, Jianhua Li, Junbao Zhu, Wanyun Xu, Jianfeng Gao
College of Life Science, Shihezi University, Xinjiang, China.
Submitted: November 3, 2014; Approved: January 27, 2015.
Abstract
A new inulinase-producing strain was isolated from rhizosphere soils of Jerusalem artichoke col-lected from Shihezi (Xinjiang, China) using Jerusalem artichoke power (JAP) as sole carbon source. It was identified as anAspergillus nigerstrain by analysis of 16S rRNA. To improve inulinase pro-duction, this fungus was subjected to mutagenesis induced by60Cog-irradiation. A genetically stable mutant (designated E12) was obtained and it showed 2.7-fold higher inulinase activity (128 U/mL) than the parental strain in the supernatant of a submerged culture. Sequential methodology was used to optimize the inulinase production of stain E12. A screening trial was first performed using Plackett-Burman design and variables with statistically significant effects on inulinase bio-produc-tion were identified. These significant factors were further optimized by central composite design ex-periments and response surface methodology. Finally, it was found that the maximum inulinase production (185 U/mL) could be achieved under the optimized conditions namely pH 7.0, yeast ex-tract concentration of 5.0 g/L, JAP concentration of 66.5 g/L, peptone concentration of 29.1 g/L, so-lution volume of 49.4 mL in 250-mL shake flasks, agitation speed of 180 rpm, and fermentation time of 60 h. The yield of inulinase under optimized culture conditions was approximately 1.4-fold of that obtained by using basal culture medium. These findings are of significance for the potential industrial application of the mutant E12.
Key words: inulin, ethanol fermentation, inulinase, central composite design, response surface methodology.
Introduction
Jerusalem artichoke (Helianthus tuberosus L.) is a native plant of North America and its tubers contain about 75-85% (dry weight) of total sugars (Wanget al., 2013). As an excellent source of sugar and renewable raw material, Jerusalem artichoke grows well in poor soil and even in sand, and has a high tolerance to frost and various plant dis-eases. Inulin is the primary storage carbohydrate of Jerusa-lem artichoke. As a natural carbohydrate, inulin occurs in plants mainly as an energy reserve and as a cryoprotectant with beneficial nutritional and technological properties (Saengthongpinit and Sajjaanantakul, 2005). Inulin has a polymerization degree (DP) 2-60 or higher, consisting of linearb-2, 1-linked polyfructose chains displaying a termi-nal glucose unit. Recently, the production of ethanol by
fer-mentation of Jerusalem artichoke tubers has become a hot research issue (Yuanet al., 2008; Zhanget al., 2010; Huet al., 2012; Liet al., 2013).
Recently, inulinases have received much attention as they can be widely applied to hydrolyze inulin for the pro-duction of fuel ethanol, fructose, and fructo-oligosaccha-rides (Gaoet al., 2009). Inulinases are a group of hydrolas-es which target on theb-2,1 linkage of inulin and hydrolyze it into fructose and glucose. Inulinases can be divided into endo-inulinase and exo-inulinase. The endo-inulinase hydrolyzes the internal linkages in inulin to produce inu-lotriose, inulotetraose, and inulopentaose as the main prod-ucts. The exo-inulinase hydrolyzes inulin into fructose and glucose, then, the formed fructose and glucose can be fur-ther fermented into ethanol by specific microorganisms (Li
et al., 2013). DOI: http://dx.doi.org/10.1590/S1517-838246320140918
Send correspondence to J. Gao. College of Life Science, Shihezi University, Shihezi 832003 Xinjiang, China. E-mail: [email protected], [email protected].
Inulinases can be secreted by a variety of microbes in-cluding fungi, yeast, and bacteria. Among them,
AspergillusandKluyveromycesstrains are generally pre-ferred choices for commercial applications (Zhanget al., 2004). Recently, many studies have been conducted using inulinase from Aspergillus for enzymatic hydrolysis of inulin (Gillet al., 2006; Sirisansaneeyakulet al., 2006). Some efforts have been made to enhance enzyme activity ofAspergillussuch as transgene expression (Zhanget al., 2004) and coculture with other species (Geet al., 2009).
Irradiation mutagenesis by means of X-rays, ultravio-let rays, andg-rays can cause morphological and biochemi-cal alterations in microbial cells. Fenget al.(2014) found that nuclear irradiation could remarkably enhance the lipid yields ofNitzschiasp. Chenget al.(2014) reported that the biomass and lipid yields ofNitzschiasp. were increased by 53.8% and 28.1%, respectively, through60Co-g -ray-indu-ced mutation at 900 Gy. However, research on the utiliza-tion of nuclear irradiautiliza-tion to enhance the inulinase activity of microbes is very scarce.
Thereupon, the objectives of the present study were (1) to isolate an inulinase-producing strain and re-mutate it by using60Co-gradiation; (2) to optimize the conditions for inulinase production by the mutant.
Materials and Methods
Chemicals
Jerusalem artichoke dry powder was purchased from Xi’an Sinuote Biotechnology Co., Ltd., China. The Jerusa-lem artichoke powder (JAP) was used as carbon source for microbial screening, fermentation and inoculation. The JAP contains (w/w): 2.8% fructose, 3.2% sucrose, 80.7% inulin, 1.4% nitrogen, 4.9% crude fiber, 4.3% ash, and 2.7% water. Yeast extract and peptone, with nitrogen con-tents of 9.8% and 12.2% (w/w) respectively, were pur-chased from Aoboxing Biotechnology Co., Ltd. (Beijing, China). Inulin (³ 98% purity) was obtained from Sigma-Adrich (St Louis, MO, USA). All other chemicals were of analytical grade and commercially available.
Isolation of inulinase-producing fungus strain
The rhizosphere soils of Jerusalem artichoke collect-ing from Shihezi (Xinjiang, China) were chosen as natural isolation sources of microbes. Enrichment of microorgan-isms was carried out from 5 g of individual soil samples with 50 mL of selecting medium (JAP 40.0 g/L, Na2HPO4 10.0 g/L, NH4Cl 20.0 g/L, pH 7.0) in a 250-mL flask in a 28 °C incubator (180 rpm) for 4 days. Then an aliquot of cul-ture medium was streaked onto selecting agar medium (se-lecting medium with 2% agar) and incubated for 3-5 days at 28 °C. After incubation, all the plates were observed and morphologically different colonies (fungus-like) were se-lected and purified by streaking over the same medium. For purification, each isolate was transferred at least three
times. For further screening and identification, the isolates were maintained on Czapek yeast agar (CYA) medium (K2HPO41.0 g/L, yeast extract 5.0 g/L, sucrose 30.0 g/L, agar 15.0 g/L, Czapek concentrate 10.0 mL/L, distilled wa-ter 1000 mL) (Silva et al., 2011). The composition of Czapek concentrate is (g/L): NaNO3 300.0, KCl 50.0, FeSO47H2O 1.0, ZnSO47H2O 1.0, CuSO45H2O 0.5.
The isolates showing moderate to excellent activity were selected for secondary screening, which was per-formed by the spore cultivation method. For this reason, the isolates were transferred to potato dextrose agar (PDA) plates (peeled and sliced potato 200.0 g/L, glucose 20.0 g/L, agar 20.0 g/L). Following growth for 3-7 days at 28 °C, the mycelium was collected and mixed with sterile water (containing 0.05% (w/v) Tween 80) to prepare spore sus-pension (about 105conidia per mL). After this, 1 mL of each conidial suspension was inoculated in a 250-mL shake flask containing 100 mL of fermentation medium (JAP 40.0 g/L, yeast extract 5.0 g/L, peptone 10.0 g/L, pH 7.0). The flasks were incubated in a rotary shaker (180 rpm) at 28 °C for 3-5 days, and then the microorganisms were re-isolated by serial dilution of the culture and plated on the selecting agar medium by adopting standard spread plate method. In this study, all media were autoclaved at 121 °C for 15 min.
Species identification
The preferred isolates were transferred to CYA plates. Each plate was inoculated with three 5-mL drops of freshly prepared conidial suspension, incubated at 28 °C for 7 days and observed for species identification by macro-scopic and micromacro-scopic morphological characteristics as described by Maren (2002). The isolates were also sent to Shanghai Sangon Biotechnology Co., Ltd. (Shanghai, China) for molecular identification. Molecular identifica-tion was done by partial sequencing. Genomic DNA was isolated and about 500 bp rDNA fragments were amplified using primers CF1L (5’-GCCGACTCTTTGACYGAR GAR-3’) and CF4 (5’-TTTYTGCATCATRAGYTGG AC-3’) (Peterson, 2008). Sequencing PCR was done with the BigDye® Terminator v3.1 Cycle Sequencing Kit (ABI, Foster City, CA, USA). Sequence data was aligned with Lasergene sequence analysis software (DNASTAR, Inc., Madison, WI, USA) and homologies to sequences of refer-ence strains were determined by blast search.
Determination of inulinase activity
The isolates were inoculated into 250-mL shake flasks, each containing 50 mL of fermentation medium, and then cultured at 28 °C and 180 rpm for 60 h on a rotary shaker. Afterwards, the fermented liquid broth was centri-fuged at 12000 rpm and 4 °C for 10 min, and the super-natant was used as the crude enzyme preparation.
mod-ified 3,5-di nitro salicylic acid (DNS) method (Shenget al., 2007). In brief, 1.0 mL of suitably diluted crude enzyme so-lution was mixed with 4.0 mL of acetate buffer (0.1 M, pH 5.0) containing 1.5% (w/v) inulin. After incubation at 55 °C for 10 min in a water bath, each reaction mixture was mixed with 5.0 mL of DNS reagent and then kept in boiling water for 5 min. The same mixtures but with inactivated enzyme crude extracts (heated at 100 °C for 10 min) were used as blank controls. After quick cooling on ice, the reaction mix-ture was assayed for reducing sugars at 540 nm using a UV-2100 UV/VIS spectrophotometer (UNICO, Shanghai, China). The calibrating curve was drawn for DNS using fructose. One unit of inulinase activity (U) was defined as the amount of enzyme responsible for the production of 1 mmol of reducing sugar per minute under the above con-ditions. All enzymatic reactions were performed in tripli-cates.
Mutagenesis
The cells of isolate exhibiting the highest inulinase activity were mutated by nuclear irradiation. For this, the mycelium was harvested and suspended in sterile water. Five mL of the suspension in aliquots was transferred to sterile tubes and irradiated at room temperature using a 60
Co g-ray irradiator, with dosages of 800, 1000 and 1200 Gy respectively (92-99% kill rate). FivemL of each conidial suspension were inoculated to the solid fermenta-tion culture medium for single cell separafermenta-tion after irradia-tion. After incubation at 28 °C for 48 h, formed individual colonies were then picked up into 96 micro-well-plates with 0.2 mL of sterile water. Afterwards, the cell suspen-sion was inoculated to the solid selecting culture medium, incubated at 28 °C for 36 h. The mutants were grouped to three categories (forward mutation, negative mutation and non-mutation) on the basis of colony diameters. The inu-linase activity of mutants was measured as described above.
Plackett-Burman experimental design
Factors including JAP concentration, yeast extract concentration, peptone concentration, duration, tempera-ture, solution volume, inoculation size and pH were exam-ined for the fermentation production of inulinase in 250-mL Erlenmeyer flasks. The level of each factor was first estimated through single factor experiments. All ex-periments were carried out in triplicate and the averages of inulinase activity were taken as the response. The fermenta-tion time was 60 h.
An initial screening test was conducted on all eight components of the medium and culture conditions using Plackett-Burman experimental design. Each variable was defined at two levels, namely a low level (coded by -1) and a high level (coded by 1) as listed in Table 1. The three dummy variables (X4, X8and X11) were adopted to investi-gate the experimental errors. The results of Plackett-Burman experimental design were fitted by the first-order model as follows (Reddyet al., 2008):
Y =b0+
å
biXi(i=1 2, ,... )k (1)whereYis the estimated target function,b0the model inter-cept,bithe regression coefficient,Xithe coded independent
factor.
Path of steepest ascent method
Based on the results of Plackett-Burman experimen-tal design, the optimum level scope of each selected factor was examined by path of steepest ascent method. A path of steepest ascent method was designed using the direction of Plackett-Burman experimental value as the uphill direc-tion. The changing step size was confirmed according to the effect value of Plackett-Burman design. High value was se-lected when the effect value of variable was positive, and low value was selected when the effect value of variable was negative.
Table 1- The Plackett-Burman design for screening the variables, and the statistical analysis of variables.
Factor Variable Low level (-1) High level (1) F value p value
JAP (g/L) X1 40.0 60.0 23.24 0.0170*
pH X2 5.0 7.0 0.65 0.4790
Yeast extract (g/L) X3 5.0 7.5 4.78 0.1168
Fermentation time (h) X5 60 96 0.33 0.6080
Peptone (g/L) X6 10.0 15.0 50.43 0.0057**
Temperature (°C) X7 27 29 0.48 0.5385
Solution volume (mL) X9 40 60 25.97 0.0146*
Inoculation size (%) X10 4 6 0.14 0.7352
Dummy variable X4, X8, X11 -1 1 -
-- Model - - 13.25 0.0285*
Central composite design
A central composite design with three variables (Ta-ble 2) was used to evaluate the response pattern and to de-termine the optimum combination of JAP content, peptone content and solution volume for maximizing inulinase pro-duction (Plackett-Burman design had shown significant curvature and confirmed the significance of all four param-eters). The variables with that were predicted to produce highest inulinase activity by the path of steepest ascent method were used as center-point for the central composite design. Experimental results were fitted to a predictive qua-dratic polynomial equation as the correlation between the response variable and the independent variables (Xieet al., 2014):
Y X X X X
X X X X
= + + + + +
+ + +
b b b b b
b b b b
0 1 1 2 2 3 3 11 1
2
22 2 2
33 3 2
12 1 2 13 1 3
23 2 3
X X X X
+
b
(2)
whereYis the predicted response;b0, intercept;b1,b2,b3, linear coefficients;b11,b22,b33, quadratic coefficients; and b12,b13,b23are interactive coefficients. The experimental design was developed using Design Expert 8.0.7.1 (Statease, Inc., Minneapolis, MS, USA).
Results and discussion
Isolation and identification of theAspergillus
After the isolation period, a total of 12 inulinase-producing isolates were recovered from 42 soil samples. These strains could solubilize inulin particles in the agar plates and form clear surrounding zones. This was further confirmed by growing the isolates in liquid medium con-taining inulin as sole carbon source. Among the 12 isolates tested, one gave maximum enzyme activity (34.4 U/mL) and it was designated as G-60. The partial 1400 bp 16S rRNA gene sequence of the G-60 isolate exhibited 99.3% homology withAspergillus nigerstrain AF10 (Gen-Bank number AF369388). Thus the strain was identified asA. nigerG-60.
Screening single-celled mutants with high inulinase productivity
Compared with the limited penetration effect of ultra-violet rays,g-rays can generate free radicals, which may
al-ter the composition of biological cells (Kovacs and Keresztes, 2002). Thereupon,A. nigerG-60 was mutated with60Co-g-rays in this study because of their strong pene-tration capability. Random selection and screening of mu-tants is a time-consuming laborious process. To reduce labour intensity, the rational selection approach was adopted basing on the selection of mutants having higher growth capability in selecting medium agar plates than the parental strain. After two days of incubation, the diameter of mutant colonies was measured and compared with the colony diameter of parental strain G-60. A single colony of mutant with a diameter³3.3 cm,£2.7 cm, or between 2.7 and 3.3 cm was considered a forward-, negative- or non-mutation strain, respectively.
As shown in Figure 1, the colony counts with for-ward-mutation (namely having enhanced enzyme-pro-ducing ability) were 5, 6 and 2 for 800, 1000 and 1200 Gy irradiation, respectively. Similarly, the colony counts with negative mutation (namely having decreased enzyme-pro-ducing ability) were 22, 8 and 33 for 800, 1000 and 1200 Gy irradiation, respectively. Thus it can be seen, low to moderate doses ofg-ray irradiation (800 and 1000 Gy) could produce more forward mutants relative to high dose of irradiation (1200 Gy). Both the lowest rate of forward mutation (2.1%) and the highest rate of negative mutation (34.4%) occurred under 1200 Gy irradiation. This indicates that high irradiation doses seriously damage cell metabo-lism regulation system, and cell growth deteriorates due to the loss of self-repair ability of cells during damage recov-ery (Agarwalet al., 2008).
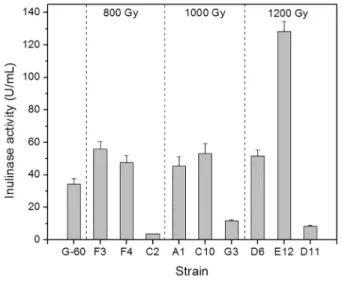
To further examine inulinase productivity of mutants, six forward mutants (designated A1, C10, D6, E12, F3 and F4 respectively) and three negative mutants (designated C2, D11 and G3 respectively) were selected for enzyme ac-tivity assays. Figure 2 demonstrates inulinase acac-tivity pro-duced by both parental strain G-60 and 9 mutants obtained with different doses of irradiation. As shown, the three neg-ative mutants (C2, G3 and D11) had significantly lower en-zyme productivity than strain G-60. The other six forward mutants exhibited higher inulinase activity than the paren-tal one. Among them, mutant E12 possessed the maximum inulinase productivity (128 U/mL), about 2.7 times higher than that of the parent strainA. nigerG-60. Thereupon, the mutant E12 was finally selected for optimization of inuli-nase production conditions in the following experiments.
Plackett-Burman experimental design
The Plackett-Burman experimental design for 12 tri-als with two levels for each variable and the corresponding inulinase production are presented in Table 3. To approach the neighborhood of the optimum response, a fitted first-order model for inulinase production was obtained from the Plackett-Burman experimental design as follows:
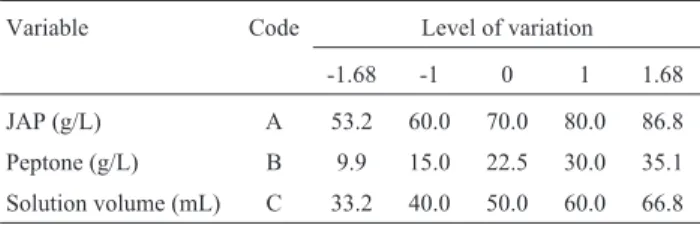
Table 2- Range of variation of the independent factors used in the central composite design.
Variable Code Level of variation
-1.68 -1 0 1 1.68
JAP (g/L) A 53.2 60.0 70.0 80.0 86.8
Peptone (g/L) B 9.9 15.0 22.5 30.0 35.1
Y X X X
X X
= - + + - +
+ +
78 60 9 23 154 33 46
012 54 39 133
1 2 3
5 6
. . . .
. . . X7 -0 98. X9 +0 71. X10
(3)
The coefficient of each variable in Eq. (3) represents the influential degree of this variable on inulinase yield. The results of statistical analyses are shown in Table 1. A factor with a confidence level greater than 95% (p£0.05) was considered to have a significant effect on inulinase yield and was selected for further study. The linear regres-sion coefficientR2was 0.9350 and the p value was 0.0285 (< 0.05) for the model. These results indicate that the model was suitable for Plackett-Burman experimental design. The p value for peptone concentration (X6) was less than 0.01
with a 99% confidence, indicating that peptone concentra-tion had an extremely significant effect on inulinase yield. The p values for JAP concentration (X1) and solution vol-ume (X9) were both less than 0.05 with a 95% confidence. These results clearly suggest that, in all the factors exam-ined, peptone concentration, JAP concentration and solu-tion volume were the most significant for inulinase production, and other factors had no significant effect on inulinase production. Peptone concentration was found to be the most influential factor, followed by solution volume and JAP concentration. Of the three significant variables identified, solution volume exerted a negative influence, while peptone concentration and JAP concentration exerted a positive influence on inulinase yield. Thus, these vari-ables were selected as studied objects for the following ex-periments.
Figure 1- Colony number of surviving cells grown in selecting medium agar plates after two days of incubation under different irradiation doses. Error bars represent the standard error associated with triplicate experi-ments. A single colony of mutant with a diameter³3.3 cm,£2.7 cm, or between 2.7 and 3.3 cm was considered a forward-, negative- or non-mu-tation strain, respectively.
Figure 2- Inulinase yield of parental strain G-60 and mutants after culti-vation at 28 °C and 180 rpm for 60 h using the fermentation medium.
Table 3- The design and results of Plackett-Burman design.
No. X1 X2 X3 X4 X5 X6 X7 X8 X9 X10 X11 Inulinase yield (U/mL)
1 -1 -1 1 -1 1 1 -1 1 1 1 -1 125
2 1 1 -1 -1 -1 1 -1 1 1 -1 1 91.0
3 1 -1 1 1 -1 1 1 1 -1 -1 -1 156
4 1 1 -1 1 1 1 -1 -1 -1 1 -1 110
5 -1 1 1 1 -1 -1 -1 1 -1 1 1 77.4
6 -1 1 1 -1 1 1 1 -1 -1 -1 1 133
7 -1 -1 -1 1 -1 1 1 -1 1 1 1 93.3
8 -1 1 -1 1 1 -1 1 1 1 -1 -1 122
9 -1 -1 -1 -1 -1 -1 -1 -1 -1 -1 -1 107
10 1 -1 -1 1 1 -1 -1 -1 1 -1 -1 104
11 1 -1 -1 -1 1 -1 -1 1 -1 1 1 115
The path of steepest ascent
The above results indicate that compared with other factors, peptone concentration, JAP concentration, and so-lution volume can significantly influence inulinase yield. Moreover, Eq. (3) shows that the coefficient of X9was neg-ative while the coefficients of X1 and X6 were positive, which means that the decrease in solution volume and the increase in concentrations of JAP and peptone can exert positive effect on inulinase production. The path of the steepest ascent was used to search for the proper direction to change the levels of these three factors while keeping the other factors constant at the levels found in basal fermenta-tion medium. The experimental design and corresponding results are listed in Table 4. The results indicate that the yield of inulinase was maximum when the concentrations of JAP and peptone, and solution volume were selected to be 70.0 g/L, 22.5 g/L and 50.0 mL, respectively. These re-sults suggest that this level for each of the three factors was near the region of maximum inulinase production response.
Central composite design and response surface methodology
To further enhance inulinase production by the mu-tant E12, central composite design and the response surface methodology were employed to analyze the interactive ef-fect of JAP concentration, peptone concentration and solu-tion volume and to obtain an optimum for the inulinase production by the mutant E12. The values of the three vari-ables in the run 3 obtained from the steepest ascent path (Table 4) were taken as the center points with the other vari-ables fixed at low level (Table 1). The design and results of the experiments carried out with the central composite de-sign are listed in Table 5.
The analysis of variance (ANOVA) was employed for the determination of the significant parameters. The re-sults obtained were submitted to ANOVA on De-sign-Expert 8.0 and the regression model was given as the following equation:
Y A B C
A B C
= - + + +
--
-3650 52 55 28 4246 54 08
0 45 2 101 2 0 55
. . .
. . . 2
0 29 012 036 + -. . AB AC BC (4)
whereYis inulinase activity,Ais JAP concentration,Bis peptone concentration,Cis solution volume (Table 2). The ANOVA of the quadratic regression model demonstrates that Eq. (4) is a highly significant model, as is evident from the Fisher’sF-test with a very low probability value (F
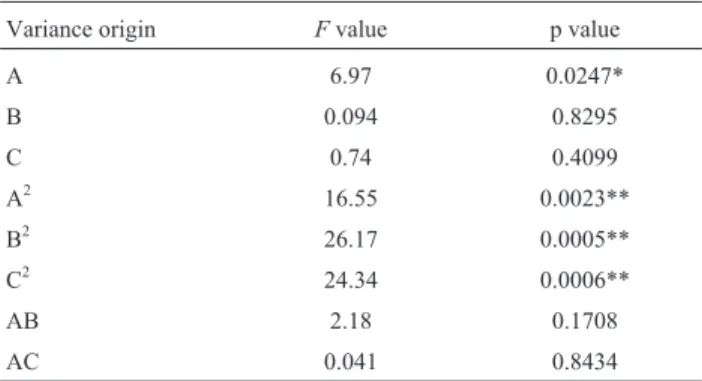
value = 7.70) (Table 6). The p value (0.0013) was less than 0.01 with a 99% confidence (Table 6), indicating model terms were extremely significant. Of the first terms (A,B,
C), JAP concentration (A) had significant effect on inuli-nase yield (p < 0.05). Of the quadratic terms (A2,B2,C2), concentrations of JAP and peptone and solution volume had extremely significant effect on inulinase yield (p < 0.01). However, the interaction terms (AB,AC,BC) had no significant effect on inulinase yield (p > 0.05).
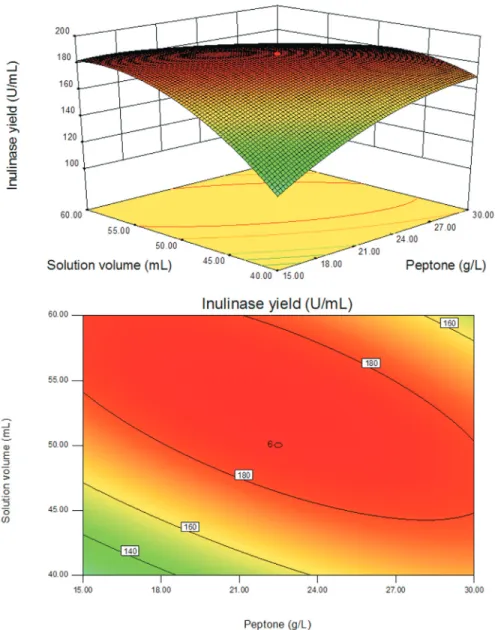
The interactions of the three components and their op-timum level in inulinase production were further analyzed through response surface methodology. The three-dimen-sion response surface curves and respective contour plots are presented in Figures 3-5. Three-dimensional graphs were generated for the combination of the two variables, while keeping the other one at their optimum levels deter-mined by the path of steepest ascent for inulinase produc-tion by the mutant E12. It can be seen that the response surface was convex, suggesting that the optimum condi-tions are well-defined and there existed a maximum for each variable. According to the results of the response sur-face analysis, the predicted maximum production of
inuli-Table 4- The designs and results of path of steepest ascent.
No. JAP (g/L) Peptone (g/L) Solution volume (mL)
Inulinase yield (U/mL)
1 50.0 12.5 60 97.0
2 60.0 17.5 55 138
3 70.0 22.5 50 166
4 80.0 27.5 45 120
5 90.0 32.5 40 104
6 100.0 37.5 35 81.7
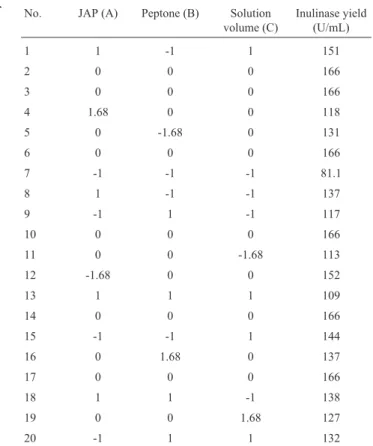
Table 5- The designs and results of central composite design.
No. JAP (A) Peptone (B) Solution volume (C)
Inulinase yield (U/mL)
1 1 -1 1 151
2 0 0 0 166
3 0 0 0 166
4 1.68 0 0 118
5 0 -1.68 0 131
6 0 0 0 166
7 -1 -1 -1 81.1
8 1 -1 -1 137
9 -1 1 -1 117
10 0 0 0 166
11 0 0 -1.68 113
12 -1.68 0 0 152
13 1 1 1 109
14 0 0 0 166
15 -1 -1 1 144
16 0 1.68 0 137
17 0 0 0 166
18 1 1 -1 138
19 0 0 1.68 127
nase was 193 U/mL when the concentrations of JAP and peptone, and solution volume were 66.5 g/L, 29.1 g/L and
49.4 mL, respectively, and the rest of the variables were kept at zero level (Table 2). In the present study, inorganic
Figure 3- The response surface plot and the corresponding contour plot showing the effects of JAP and peptone on inulinase production by mutant E12. Solution volume level, 50.0 mL.
Table 6- Analysis of variance (ANOVA) for regression of central composite design.
Variance origin Fvalue p value
A 6.97 0.0247*
B 0.094 0.8295
C 0.74 0.4099
A2 16.55 0.0023**
B2 26.17 0.0005**
C2 24.34 0.0006**
AB 2.18 0.1708
AC 0.041 0.8434
Variance origin Fvalue p value
BC 3.20 0.1040
Model 7.70 0.0013**
First term 0.58 0.6375
Quadratic term 18.71 0.0002
Interaction term 0.35 0.7864
Lack of fit 2.22 0.2007
salts such as ammonium, magnesium and sulfate ions were not included in the fementation medium composition. This is because the carbon source used (JAP) is a crude material containing a variety of inorganic nutrients.
The mutant E12 was cultured with the optimized me-dium to examine the effectiveness of the model equations in successfully predicting the optimum response values. The set of conditions predicted by response surface meth-odology as optimum was used for experimental validation. The inulinase yield obtained from experiments using the mutant E12 culture was 185 U/mL, a value that was similar to that predicted by response surface methodology model (193 U/mL), indicating that the model can be indeed em-ployed for optimizing culture conditions for inulinase pro-duction. Thus, the yield of inulinase using the optimized
culture medium was approximately 1.4-fold of that ob-tained when basal culture medium was used.
Optimal medium composition is vital for increasing inulinase production using submerged cultures. Statistical experimental design provides a systematic and efficient means of realizing desired goals, and it helps in understand-ing the interactions among the process parameters at vary-ing levels and in calculatvary-ing an optimaum level of each variable for the maximum product yield (Trivedi et al., 2012). Many previous studies have demonstrated that inuli-nase production byAspergillus species could be remark-ably enhanced by the optimization of cultivation conditions and medium compositions (Skowronek and Fiedurek, 2004; Kumaret al., 2005; Trivediet al., 2012; Abd El Aty
et al., 2014).
In this study, the mutant E12 showed higher inulinase production ability than some otherAspergillusspecies. For example, the highest extracellular enzyme activity ofA. niger13/36 (Skowronek and Fiedurek, 2004) andA. niger
AUP19 (Kumaret al., 2005) was found to be 80 and 176 U/mL, respectively. Moreover, the mutant E12 had a lower nutrient demand than strains 13/36 and AUP19, as they needed sucrose or galactose as additional carbon source.
Conclusions
Results from this study have demonstrated that A. nigerG-60 was an efficient inulinase producer. Also, it was effective to enhance inulinase yield of the strain by nuclear irradiation mutation. A mutant strain ofA. nigerG-60 (des-ignated as E12), with inulinase yield improved more than
2.7-fold compared to the parental strain, was obtained by 60
Co-gmutagenesis treatment in this study. The application of response surface methodology design resulted in an im-provement of inulinase yield. The mutant E12 could pro-duce inulinase at a high level and therefore had significant commercial potential. Further research is needed to explore the transformed functional genes and regulated metabolic network, which are related to inulinase porduction in A. nigerG-60 cells mutated by nuclear irradiation.
Acknowledgments
This study has been funded by the opening project of the State Key Laboratory of Bioreactor Engineering in the year 2011 (No. SKLBE-KF-019).
References
Abd El Aty AA, Wehaidy HR, Mostafa FA (2014) Optimization of inulinase production from low cost substrates using Plackett-Burman and Taguchi methods. Carbohyd Polym 102:261-268.
Agarwal R, Rane SS, Sainis, JK (2008) Effects of60Cogradiation
on thylakoid membrane functions inAnacystis nidulans. J
Photochem Photobiol B 91:9-19.
Cheng J, Feng J, Sun Jet al.(2014) Enhancing the lipid content of
the diatomNitzschiasp. by60Co-girradiation mutation and
high-salinity domestication. Energy DOI: 10.1016/j.en-ergy.2014.06.009.
Feng J, Cheng J, Cheng Ret al.(2014) Screening the diatom
Nitzschia sp. re-mutated by137Cs-girradiation and
optimiz-ing growth conditions to increase lipid productivity. J Appl Phycol DOI:10.1007/s10811-014-0367-6.
Gao W, Bao Y, Liu Yet al.(2009) Characterization of
thermo-stable endoinulinase from a new strainBacillus SmithiiT7.
Appl Biochem Biotechnol 157:498-506.
Ge XY, Qian H, Zhang WG (2009) Improvement of L-lactic acid production from Jerusalem artichoke tubers by mixed
cul-ture ofAspergillus niger and Lactobacillussp. Bioresour
Technol 100:1872-1874.
Gill PK, Manhas RK, Singh P (2006) Hydrolysis of inulin by im-mobilized thermostable extracellular exoinulinase from
Aspergillus fumigatus. J Food Eng 76:369-375.
Hu N, Yuan B, Sun Jet al.(2012) ThermotolerantKluyveromyces
marxianusandSaccharomyces cerevisiaestrains represent-ing potentials for bioethanol production from Jerusalem arti-choke by consolidated bioprocessing. Appl Microbiol Bio-technol 95:1359-1368.
Kovacs E, Keresztes A (2002) Effect of gamma and UV-B/C radi-ation on plant cells. Micron 33:199-210.
Kumar GP, Kunamneni A, Prabhakar Tet al.(2005) Optimization
of process parameters for the production of inulinase from a
newly isolatedAspergillus nigerAUP19. World J Microbiol
Biotechnol 21:1359-1361.
Li Y, Liu GL, Chi ZM (2013) Ethanol production from inulin and unsterilized meal of Jerusalem artichoke tubers by
Saccharomycessp. W0 expressing the endo-inulinase gene fromArthrobactersp. Bioresour Technol 147:254-259.
Maren AK (2002) Identification of CommonAspergillusSpecies.
Central Bureau Voor Schimmel Cultures Publishers, pp. 1-62.
Peterson SW (2008) Phylogenetic analysis ofAspergillusspecies
using DNA sequences from four loci. Mycologia 100:205-226.
Reddy LVA, Wee YJ, Yun JSet al.(2008) Optimization of
alka-line protease production by batch culture of Bacillus sp.
RKY3 through Plackett-Burman and response surface meth-odological approaches. Bioresour Technol 99:2242-2249. Saengthongpinit W, Sajjaanantakul T (2005) Influence of harvest
time and storage temperature on characteristics of inulin
from Jerusalem artichoke (Helianthus tuberosusL.) tubers.
Postharvest Boil Technol 37:93-100.
Sheng J, Chi Z, Li Jet al.(2007) Inulinase production by the
ma-rine yeastCryptococcus aureusG7a and inulin hydrolysis
by the crude inulinase. Process Biochem 42:805-811.
Silva DM, Batista LR, Rezende EFet al.(2011) Identification of
fungi of the genusAspergillussection nigri using polyphasic
taxonomy. Brazil J Microbiol 42:761-773.
Sirisansaneeyakul S, Worawuthiyanan N, Vanichsriratana Wet
al.(2006) Production of fructose from inulin using mixed
inulinases from Aspergillus niger and Candida
guilliermondii. World J Microbiol Biotechnol 23:543-552. Skowronek M, Fiedurek J (2004) Optimisation of inulinase
pro-duction by Aspergillus niger using simplex and classical method. Food Technol Biotechnol 42:141-146.
Trivedi S, Divecha J, Shah A (2012) Optimization of inulinase
production by a newly isolated Aspergillus tubingensis
CR16 using low cost substrates. Carbohyd Polym 90:483-490.
Wang L, Xue Z, Zhao Bet al.(2013) Jerusalem artichoke powder:
A useful material in producing high-optical-purity l-lactate
using an efficient sugar-utilizing thermophilic Bacillus
coagulansstrain. Bioresour Technol 130:174-180.
Xie H, Zhou Y, Hu Jet al.(2014) Production of astaxanthin by a
mutant strain ofPhaffia rhodozymaand optimization of
cul-ture conditions using response surface methodology. Ann Microbiol DOI:10.1007/s13213-013-0790-y.
Yuan WJ, Zhao XQ, Ge XMet al.(2008) Ethanol fermentation
with Kluyveromyces marxianus from Jerusalem artichoke grown in salina and irrigated with a mixture of seawater and freshwater. J Appl Microbiol 105:2076-2083.
Zhang L, Zhao C, Zhu Det al.(2004) Purification and
character-ization of inulinase fromAspergillus nigerAF10 expressed
inPichia pastoris. Protein Express Purif 35:272-275.
Zhang T, Chi Z, Zhao CHet al.(2010) Bioethanol production
from hydrolysates of inulin and the tuber meal of Jerusalem
artichoke by Saccharomyces sp. W0. Bioresour Technol
101:8166-8170.
Associate Editor: Gisele Monteiro de Souza